'Seeing Theory' that visualizes the mathematical theory of probability and statistics and makes it possible to understand by image
There are only a handful of people who can intuitively understand the theory of mathematics, and because of their difficulty in image, there are many people who are not good at it. By visualizing the phenomena that occurred , Dr. Daniel Kunin of Brown University developed and published the " Seeing Theory " site that helps understand the theory of mathematics such as probability and dispersion.
Seeing Theory
https://seeing-theory.brown.edu/
When you visit the above site and click "Start" ... ...

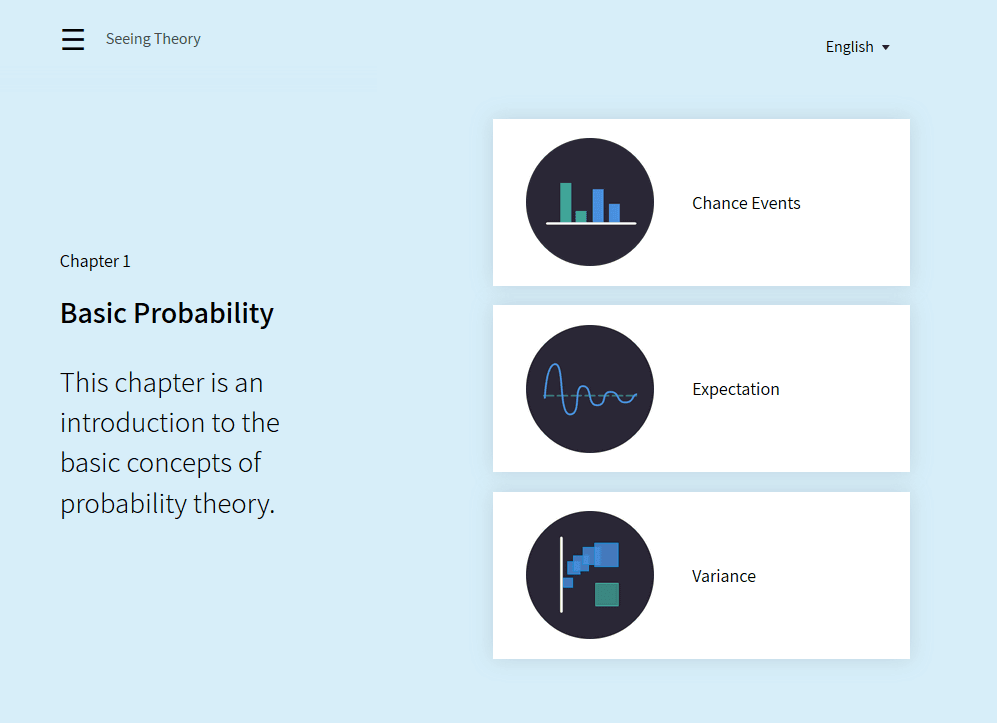
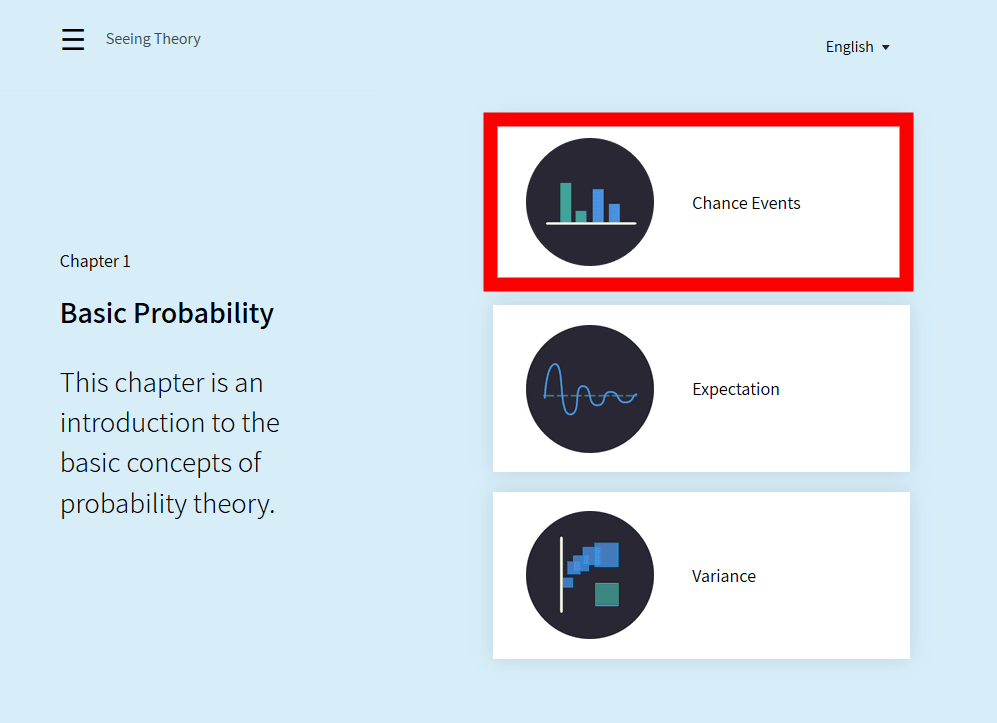
" Basic Probability " (probability basis) is displayed as "Chapter 1 (Chapter 1)". There are three items for each chapter, and the first chapter is "Chance Events" "Expectation" "Variance".
Click "Chance Events" ......
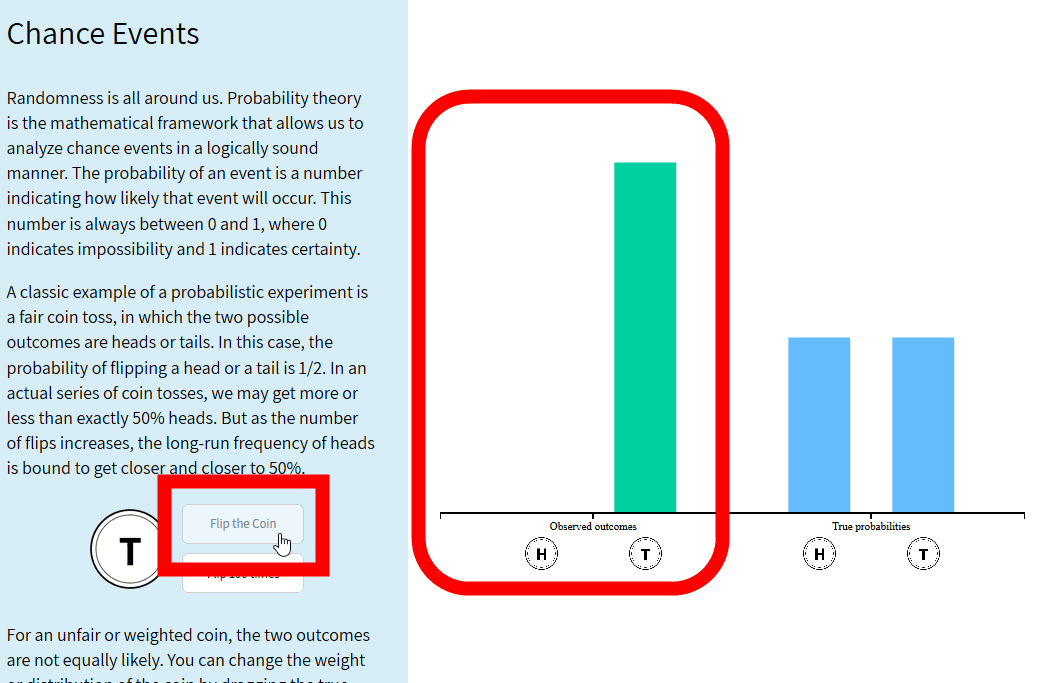
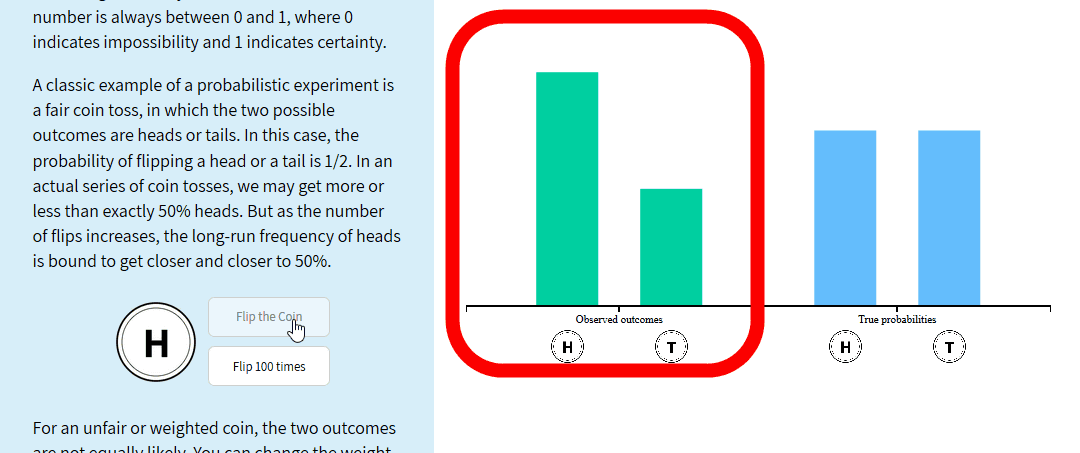
An explanation on the left and an image on the right are displayed. As an example in the explanatory note, it is written that throwing a coin and going out is either "table" or "reverse", and the probability of getting out is one-half.

"Button" for experiencing the probability of this coin's reverse side is in the explanation. When clicking the button, the coin is thrown and the table (H) or the back (T) comes out, and the proportion of whether the front or back of the coin comes out in the left bar graph will be recorded. Try clicking "Flip the Coin" once, since "T" came out, a bar graph appeared only in T part in the left bar graph.
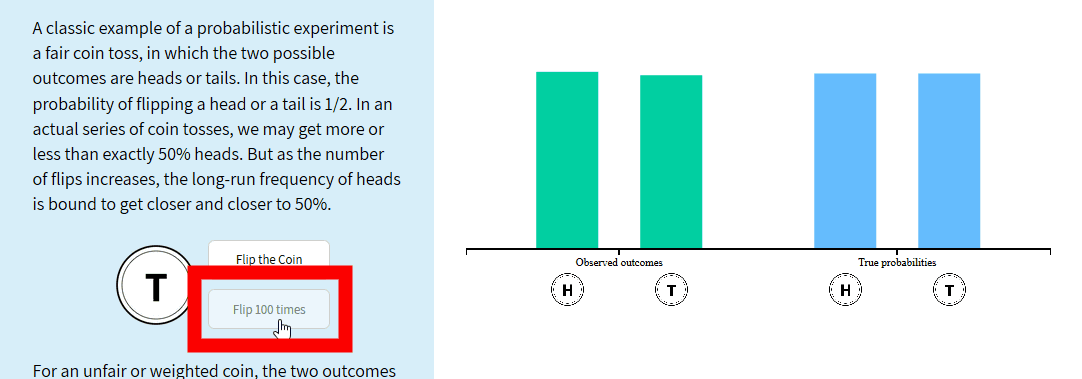
If you click "Flip the Coin" many times, the eyes will be unbalanced and the bar graph will change. "H" dominates at the time of the image below.
There are 100 continuous click buttons for those who say "It is troublesome to click a button". When you click "Flip 100 times", the state of throwing coins 100 times is played back fast, the bar graph has changed to nearly even state. The more you throw a coin, the more probability that the table and the back comes out will be equalized from the movement of the bar graph.
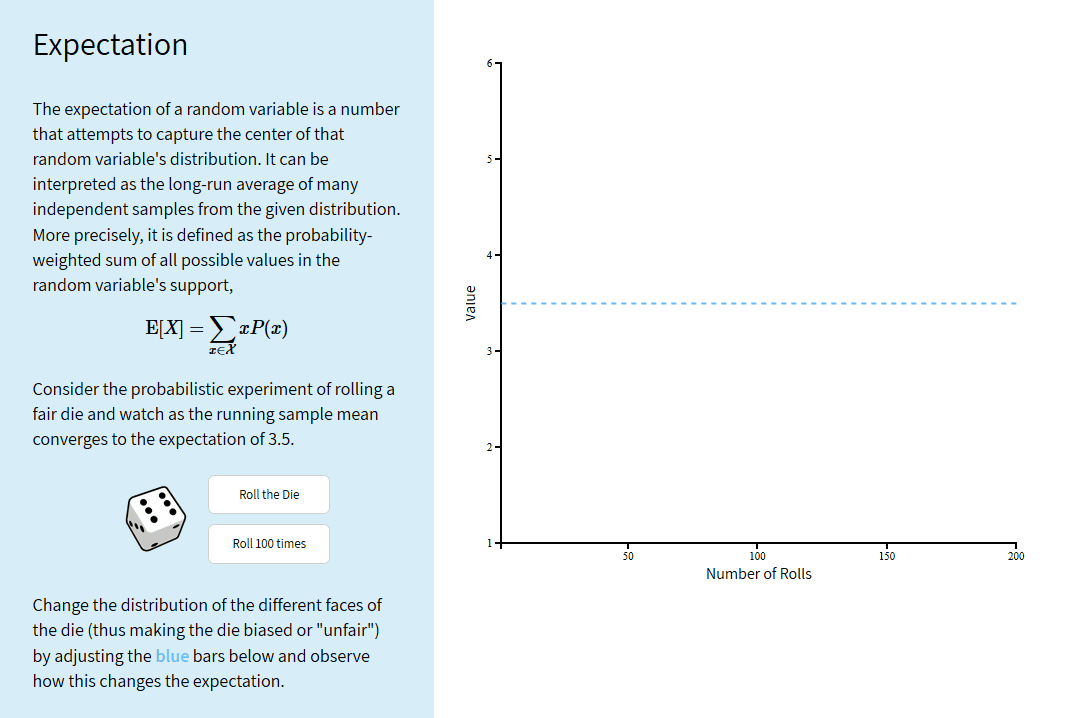
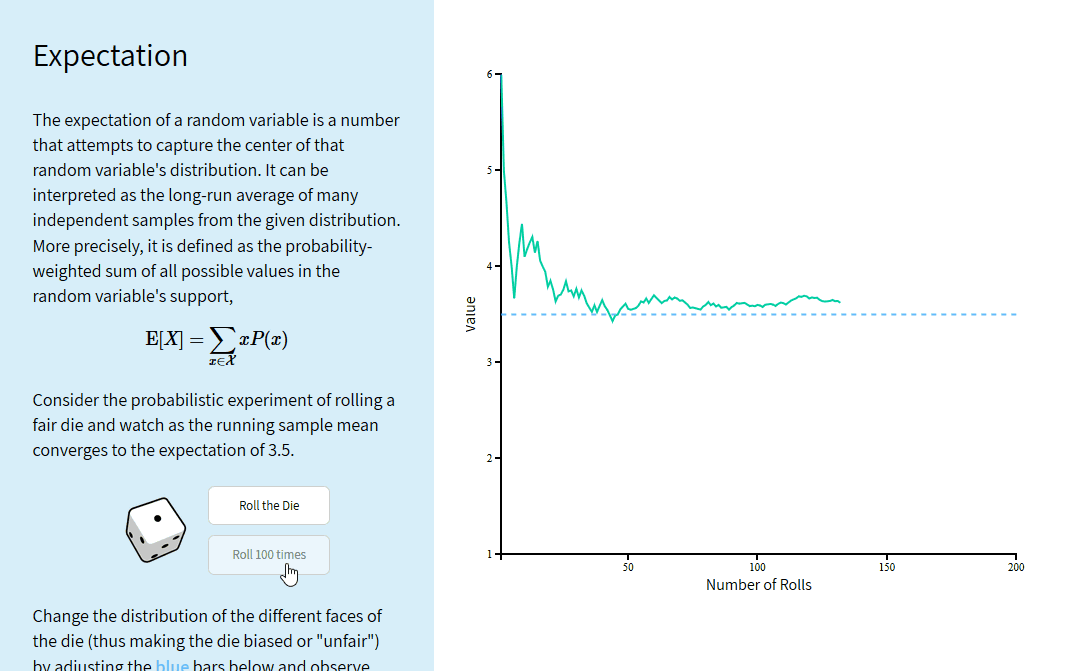
Next is the item "Expectation". Expectation is called " expected value " in Japanese. In the explanatory note, the definition is explained with an expression as an example of the expectation value with an eye as an example when the dice is shaken.
When clicking "Roll the Die" in the explanation, "6" eyes first came. Of course at this point average value is 6. When clicking again, "2" appears next and the average value has changed to 4.

As you repeat clicks, the average value changes. The value that converges by clicking indefinitely is the expected value.
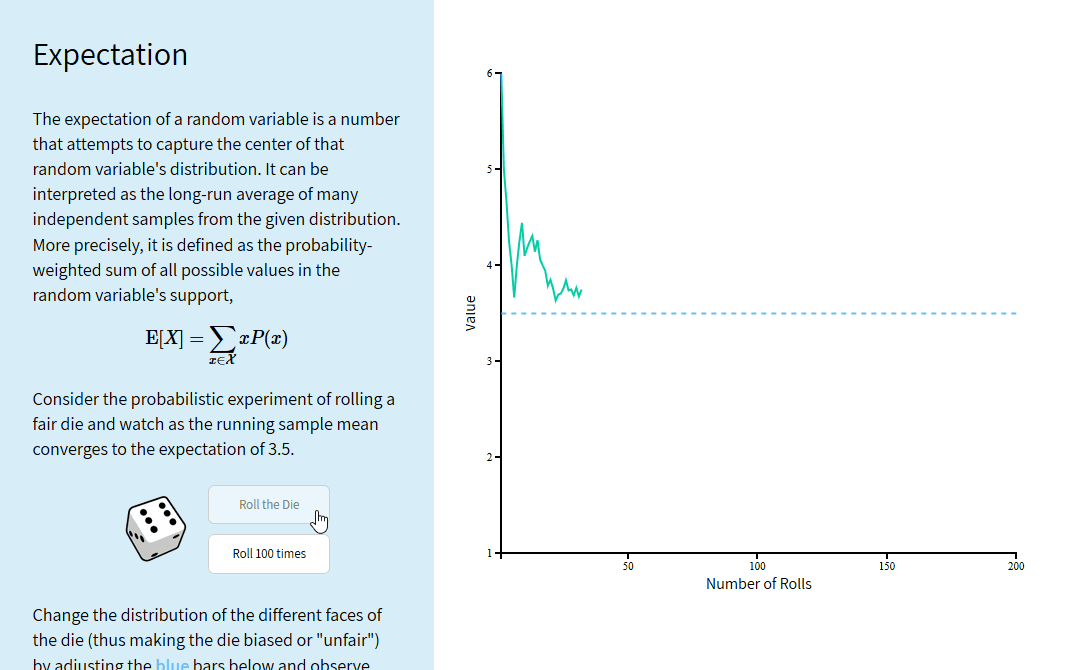
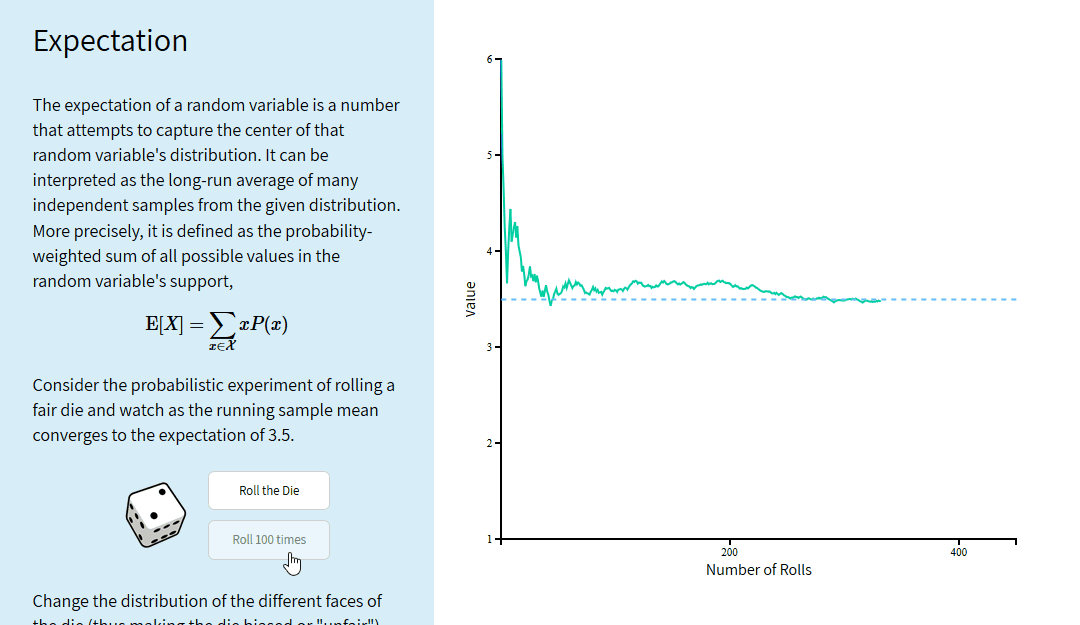
Click on "Roll 100 times" of 100 continuous click button as before.
When we roll the dice about 300 times, we found that the value approaches the expected value "3.5" of this example as much as possible.
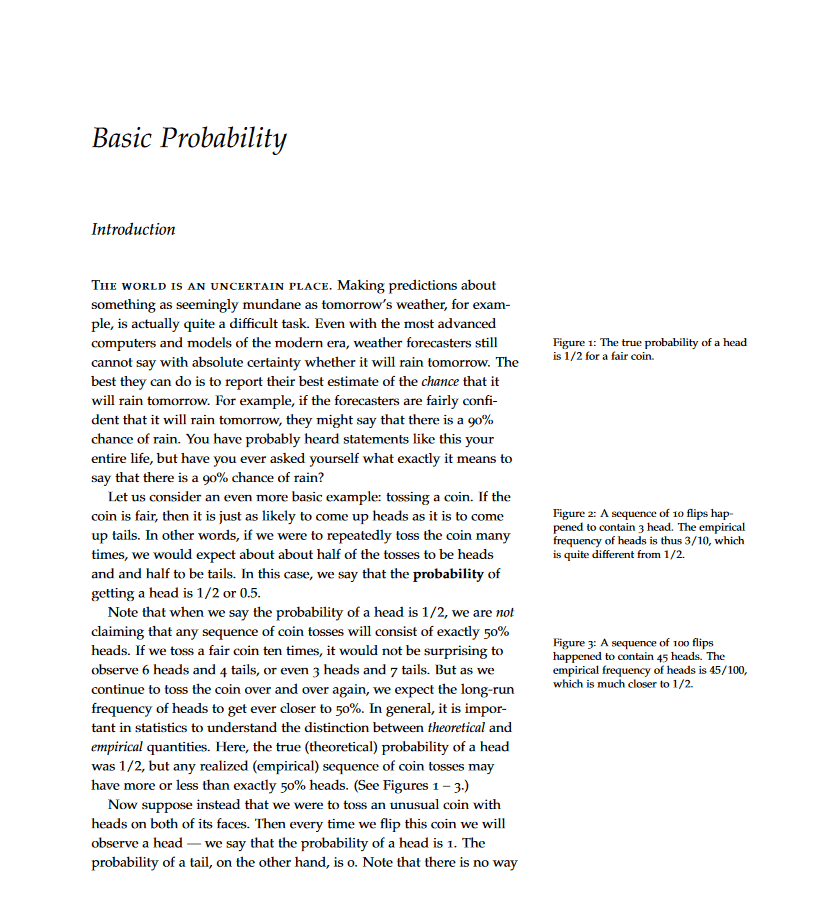
In addition, clicking "Download" at the end of each chapter ... ...
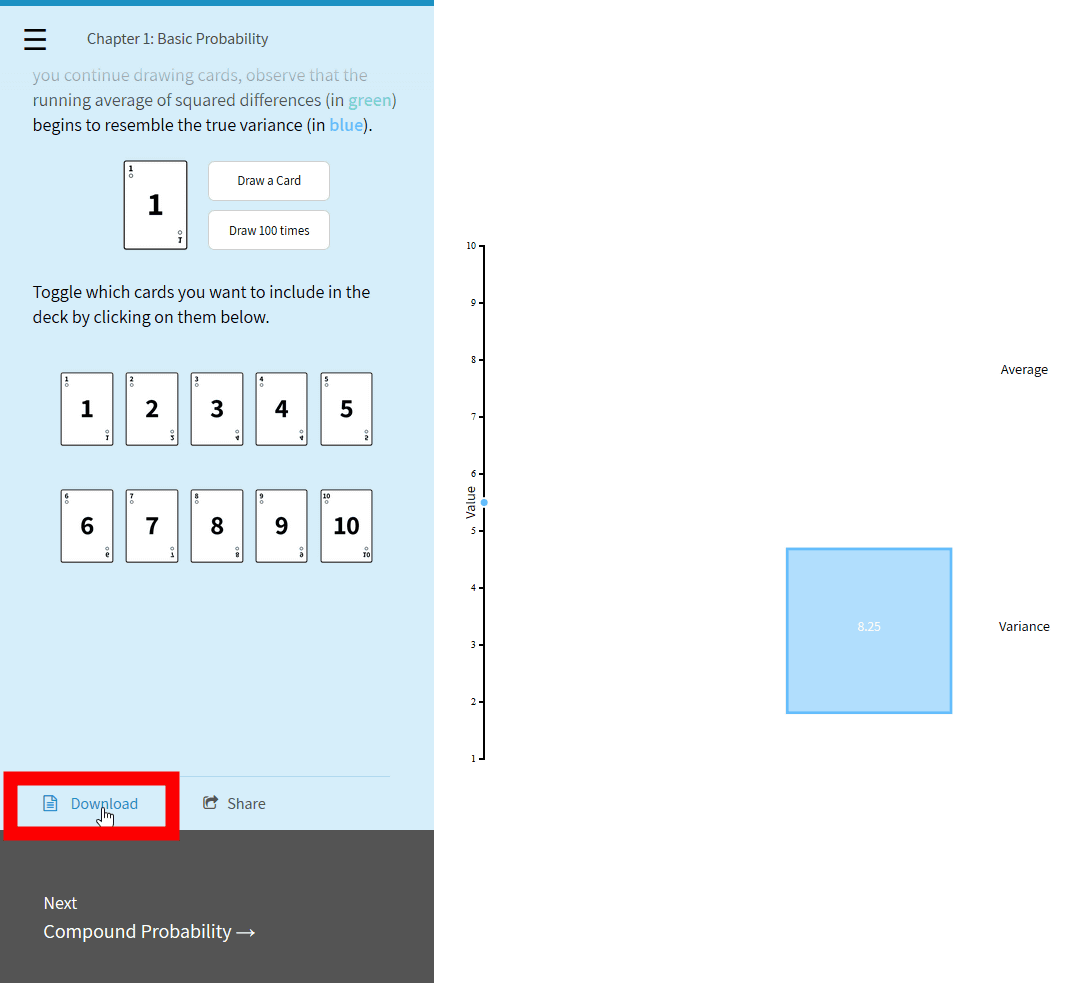
You can download PDF files of papers on each chapter.
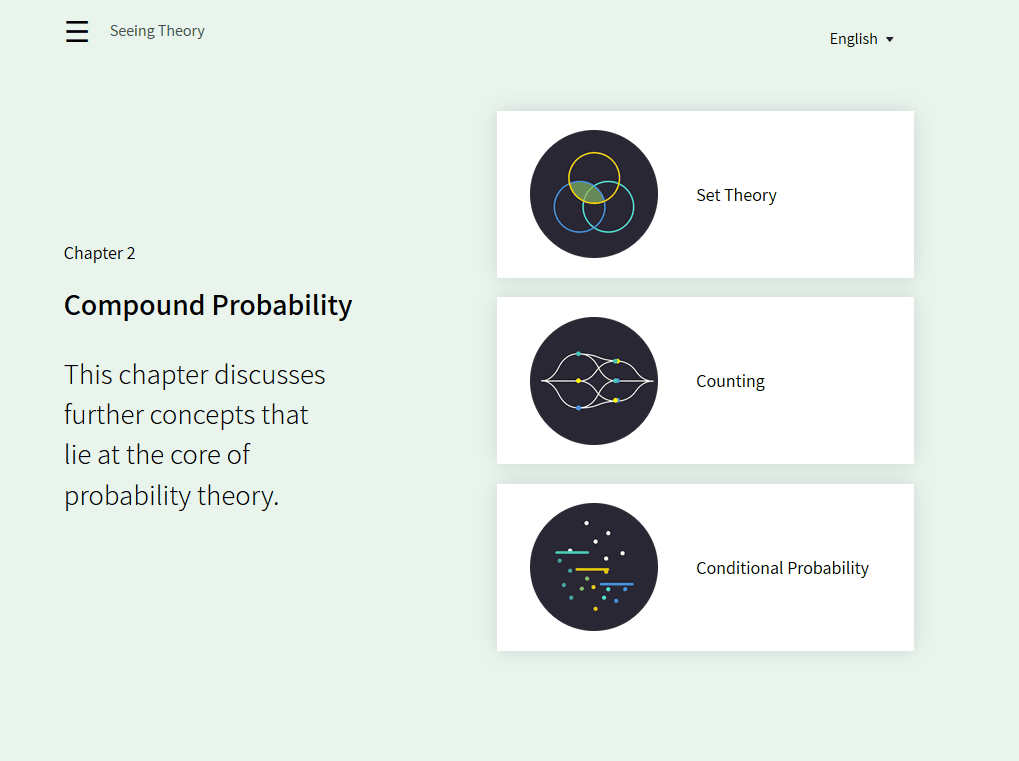
Chapter 2 has three items "Set Theory", "Counting" and "Conditional Probability" as " Compound Probability " (Multiple Probability).
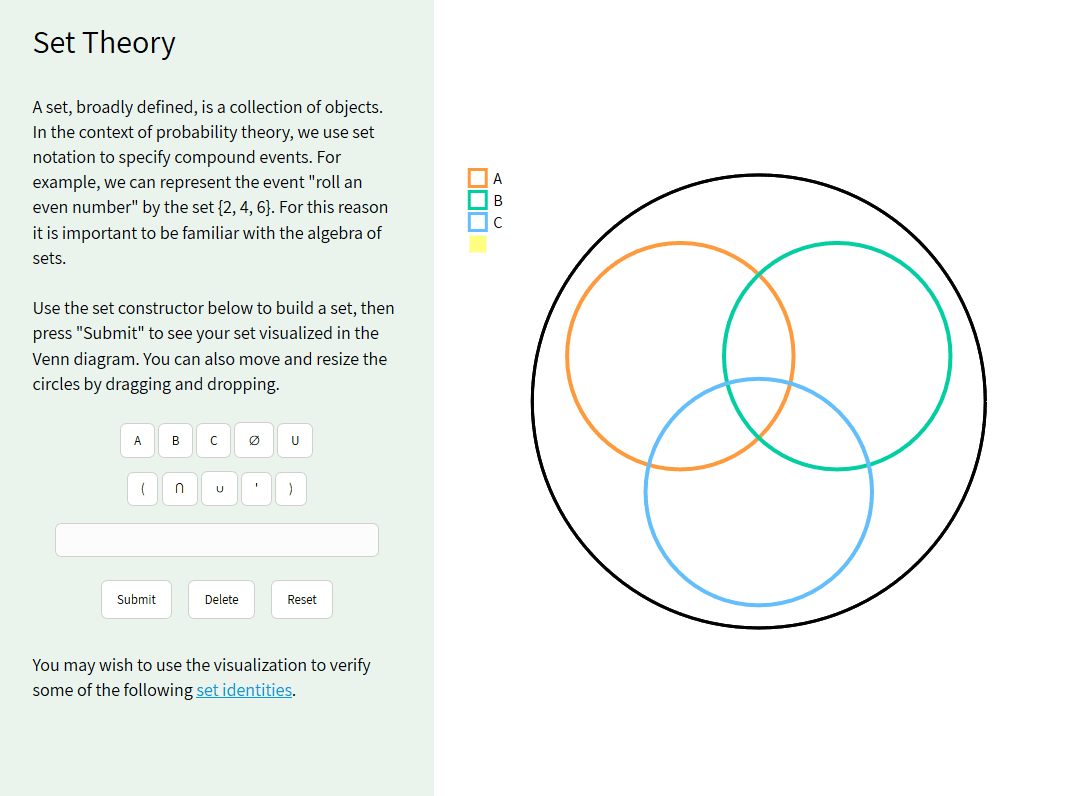
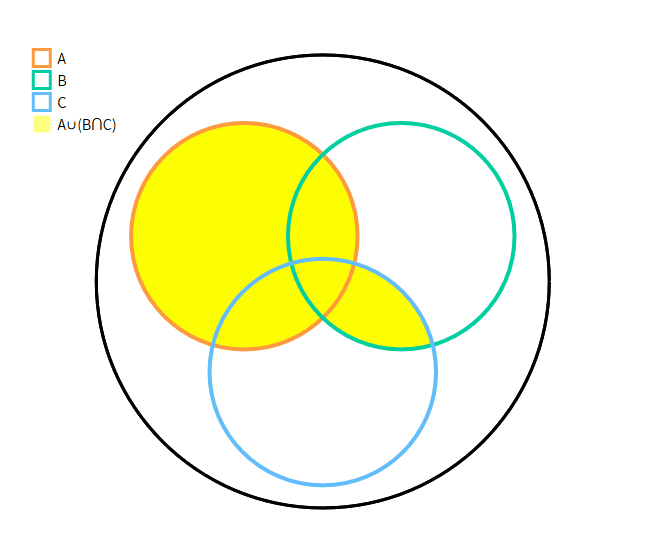
"Set Theory" relates to " collective ". The Venn diagram is displayed in the image on the right.
Enter "A∩ B" in the text field using the button under the explanation of the set and click "Submit" ...
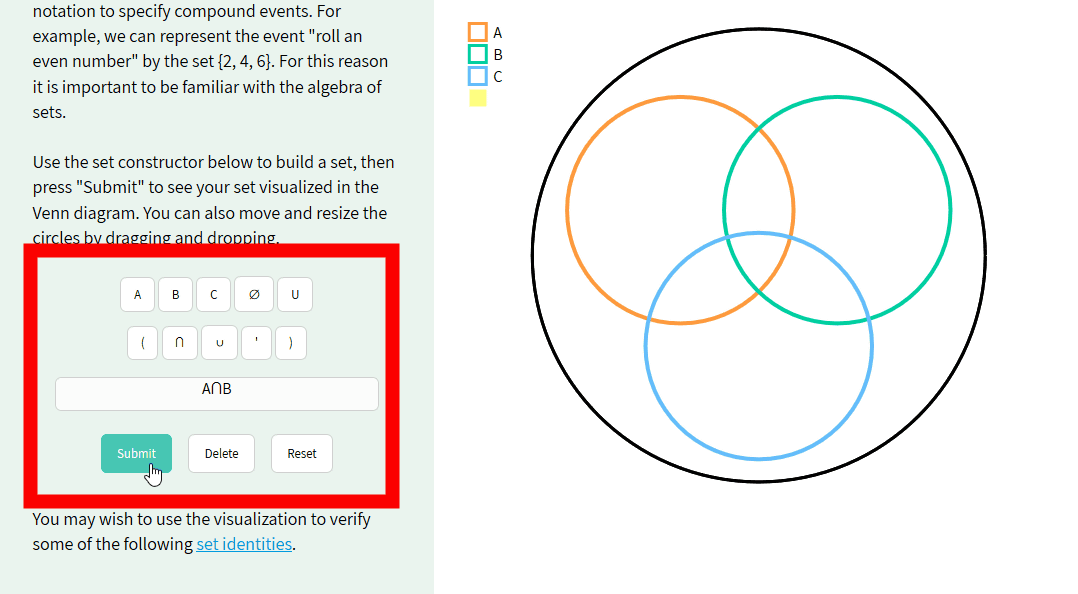
The intersection of A (orange) and B (green) is displayed in yellow.

If you enter "A ∪ (B ∩ C)" ...
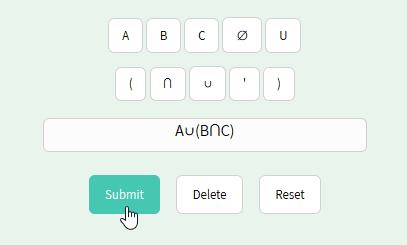
Like this.
"Conditional Probability" is described as " conditional probability " by an animation in which each condition of A to C is regarded as an obstacle, and the ball which bounces when the ball is dropped from above is treated as an event.
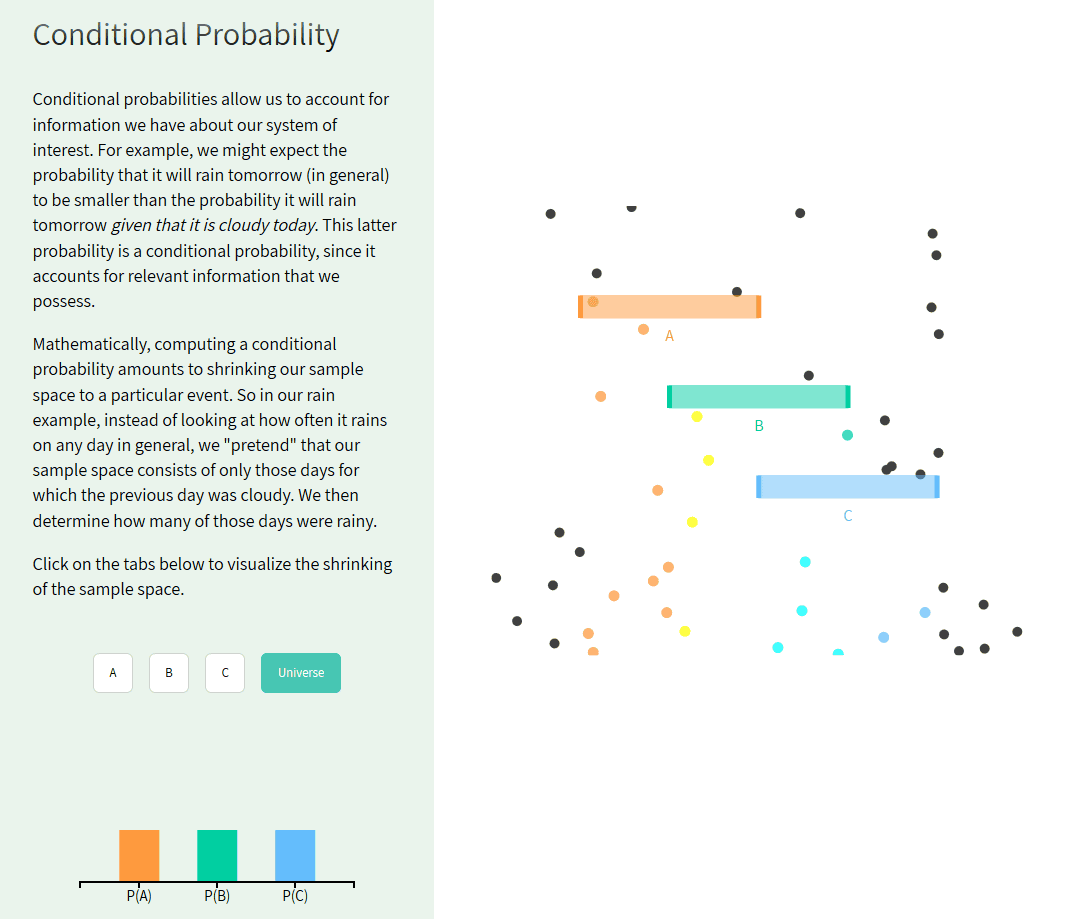
If you increase the probability of the condition by clicking each button, the length of the obstacle becomes longer. Looking at the animation, the notion of conditional probability is easier to imagine.

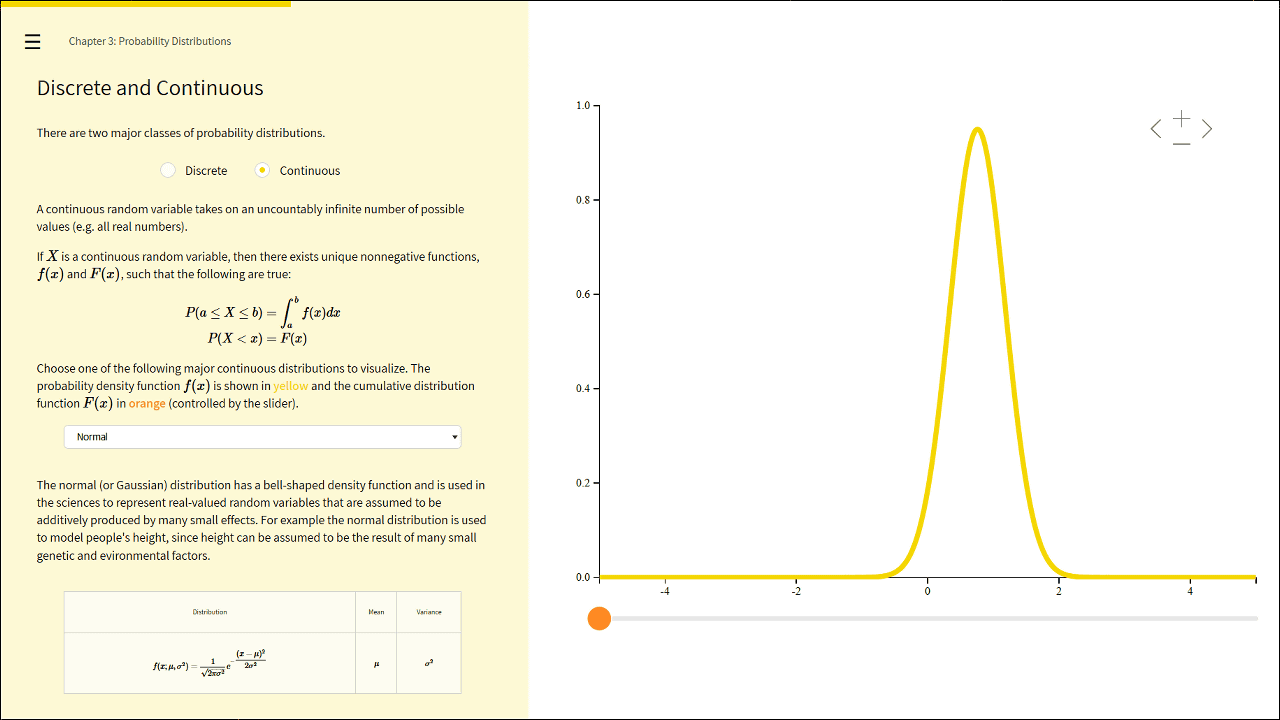
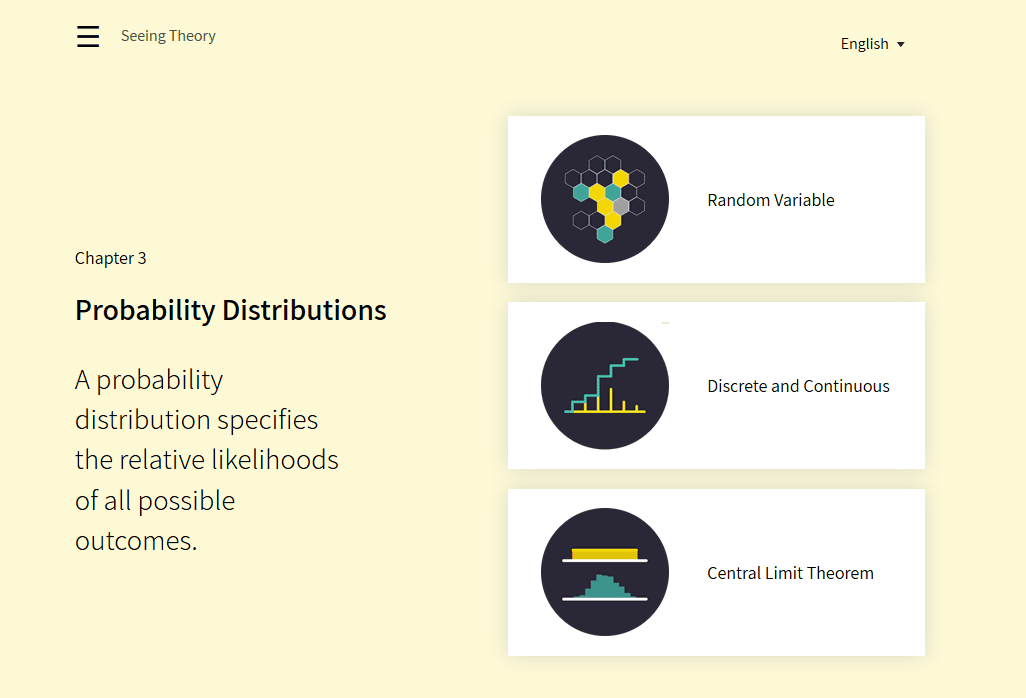
Chapter 3 is " Probability Distributions " (probability distribution), "Random Variable" "Discrete and Continuous" "Central Limit Theorem" 3 items.
"Discrete and Continuous" can visualize two discrete and continuous probability distributions, respectively.
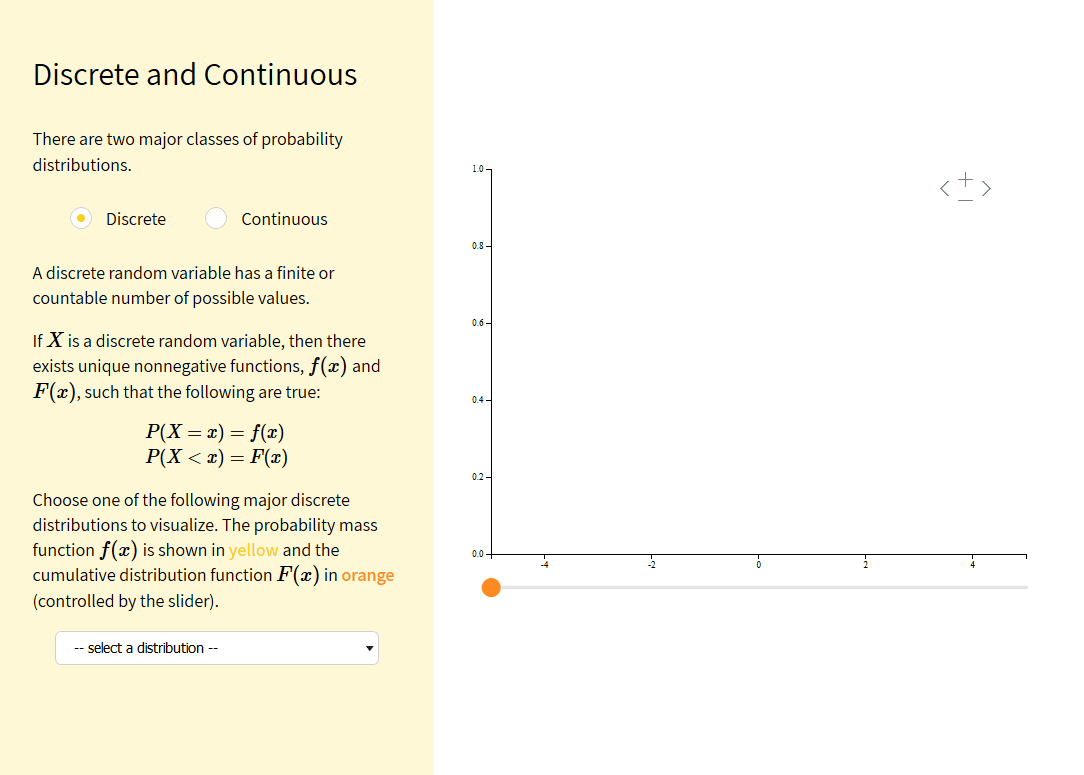
If you select 'Binomical' as discrete ... ...
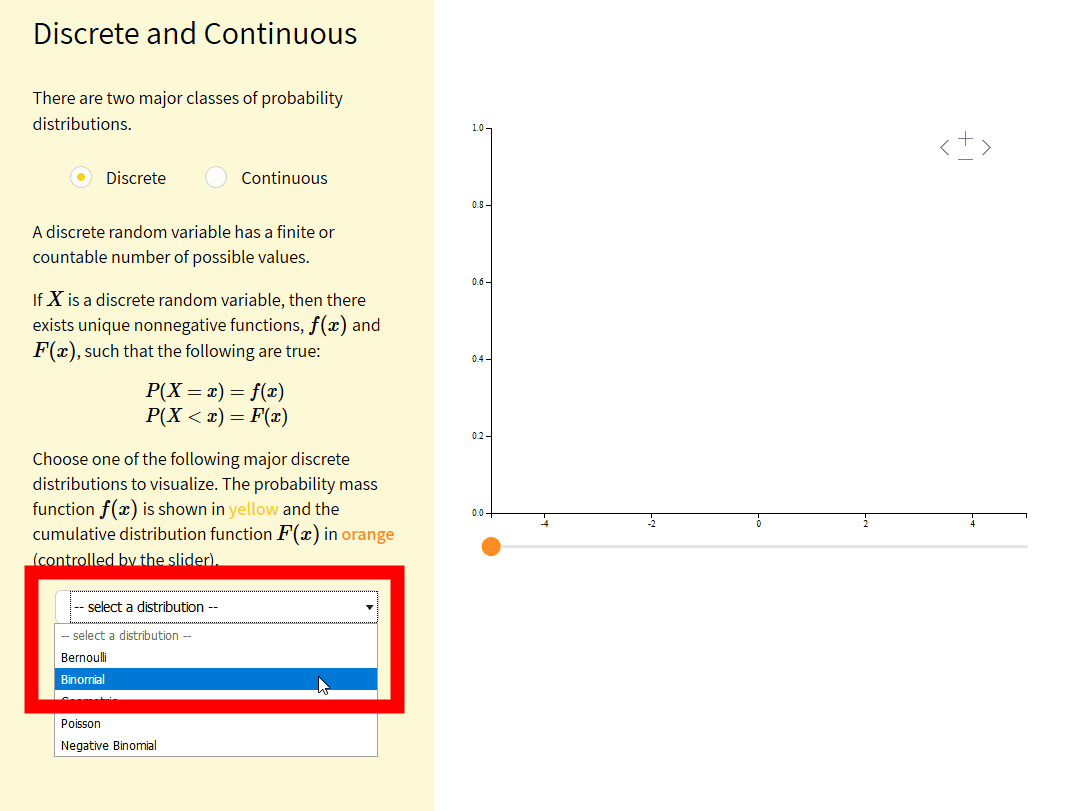
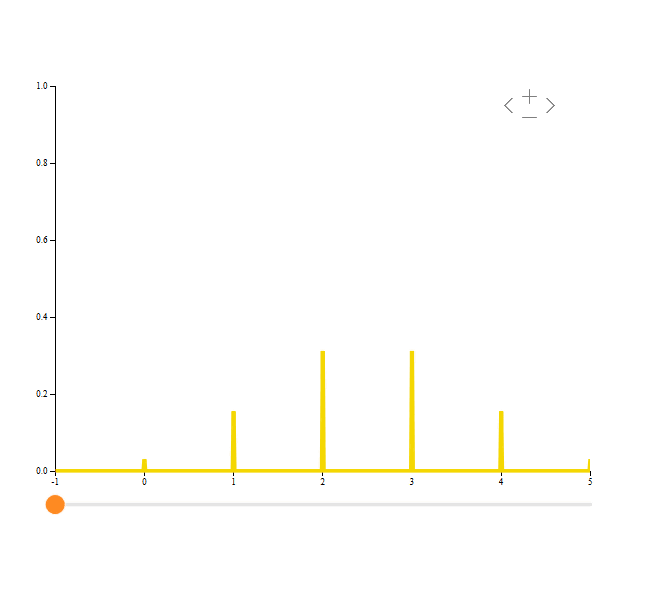
" Binomial distribution " (probability mass function) has been displayed in the graph.
The graph is enlarged / reduced ...
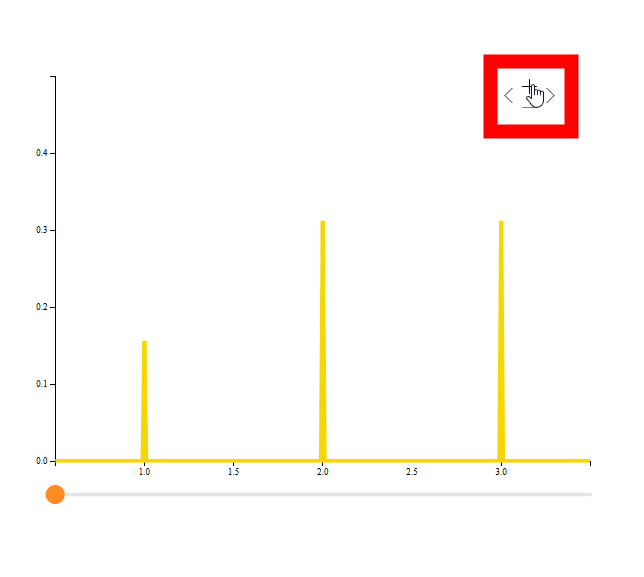
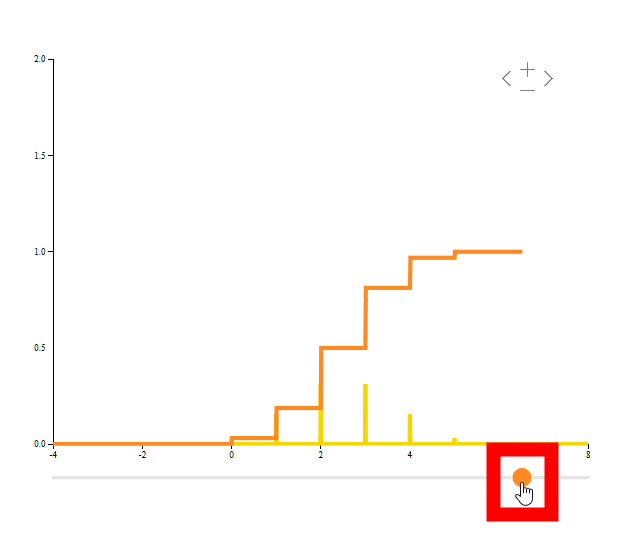
It is also possible to display the cumulative distribution function (orange) by adjusting the slider.
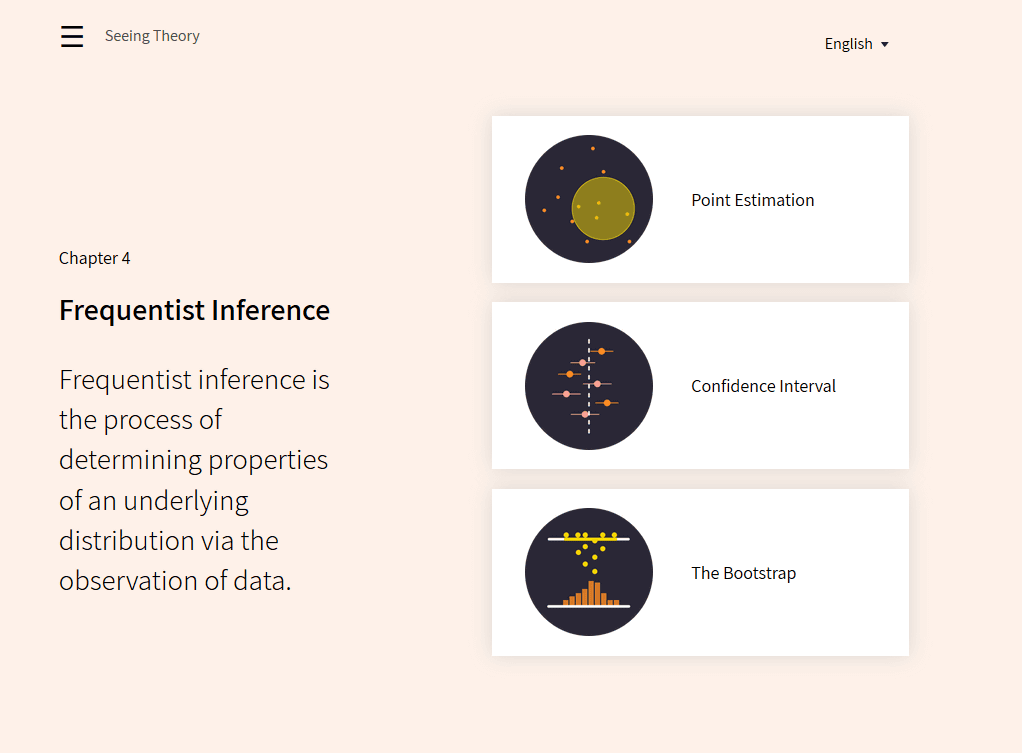
In addition, Chapter 4 " Frequentist Inference " includes "Point Estimation", "Confidence Interval", "The Bootstrap"
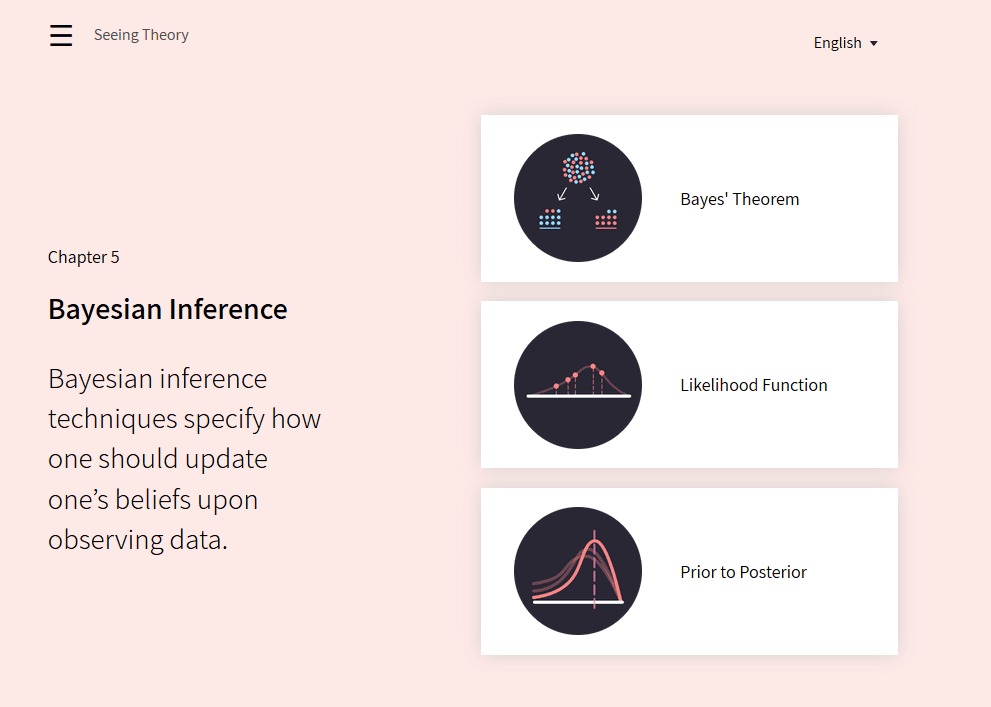
Chapter 5 " Bayesian Inference " includes "Bayes' Theorem" "Likelihood Function" "Prior to Posterior"
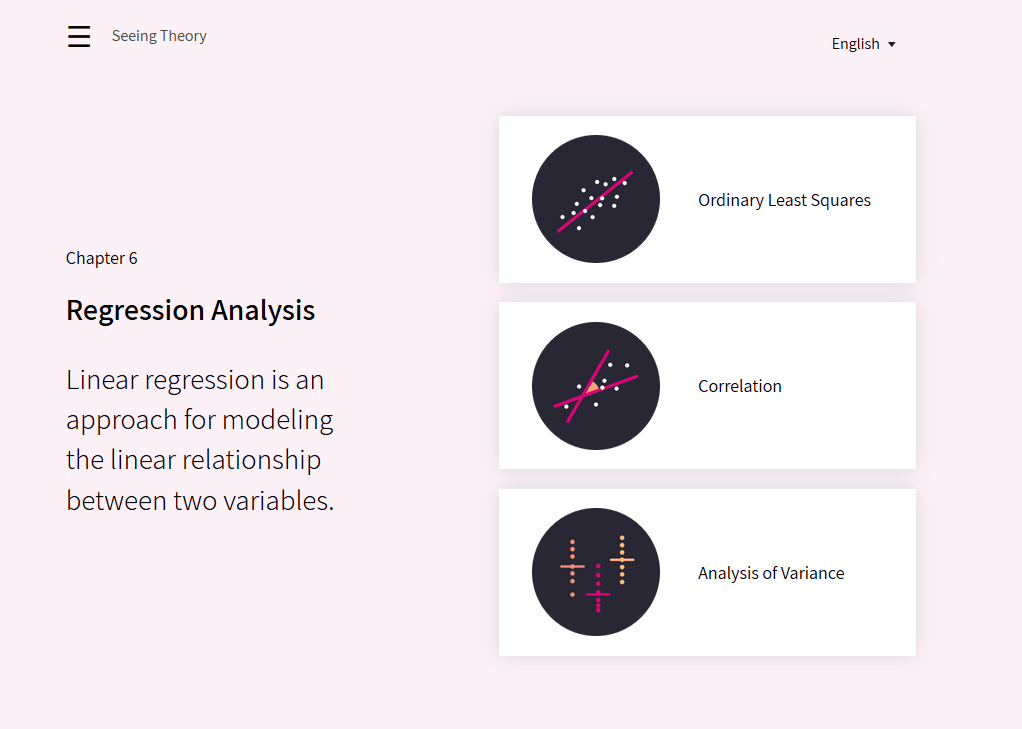
In chapter 6 " Regression Analysis ", you can learn about the theory of advanced probability and statistics by image as each chapter progresses, such as "Ordinary Least Squares" "Correlation" "Analysis of Variance".
Related Posts:


in Web Service, Science, Review, Posted by darkhorse_log