Free service "JSChart" to paste graphs on blog
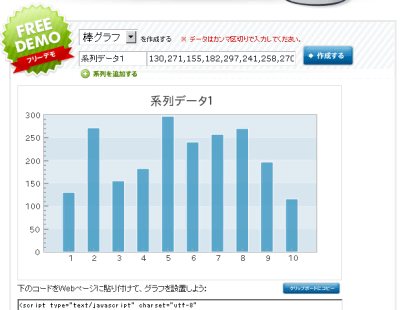
When explaining something on a blog, there are many cases that it is easier to understand who explained with images than describing with characters, but there are times when you think that "If you can create graphs right away ...". In such a case convenient is a free service "JSChart" where you can paste graphs on this blog. Simply entering the graph type, item name, and numerical value completes the graph quickly. An API is also provided.
The simple usage is as follows.
Easy, real-time graph drawing tool for web creators - JSChart -
http://www.jschart.jp/
There is a part with free demo written when accessing the top page, so you can create it there.
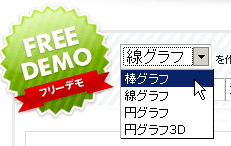
First, choose the type of graph. Selectable from 4 types of line graph, bar graph, pie chart, pie chart 3D
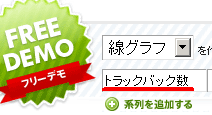
Next enter the name as it appears in the graph. Also, if you need more than one graph, you can increase it by "Add Series"
Finally enter numbers separated by commas and click "Create"

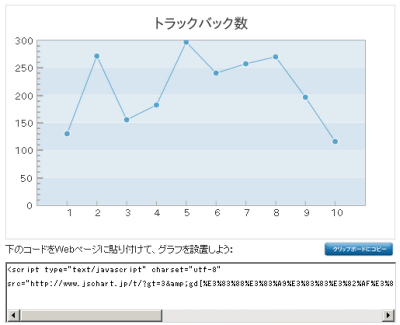
Completion. Since the code is displayed at the bottom, if you copy and paste it on your blog, the graph will be displayed
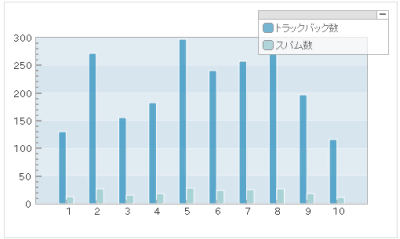
When you add a series as a bar graph and make the graph into two, it looks like this
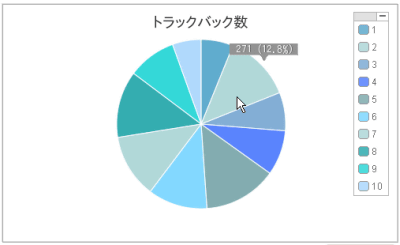
It is like a pie chart. When you move the mouse over the graph, the numerical value is displayed
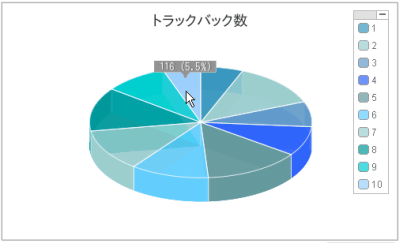
It becomes like this in pie chart 3D
Related Posts:
in Review, Web Service, Posted by darkhorse
