Thorough verification from questionnaire results 'Is it possible for humans to make completely random choices?'
Eliminating any regularity and creating a completely random state is extremely difficult, and it is also a challenge that mathematicians are seriously tackling in
How Random are you? | Danny James Williams
https://dannyjameswilliams.co.uk/post/randomchoices/
Williams posted a survey of four simple questions on the bulletin board site Reddit and conducted a survey to aggregate the answers. The final number of participants was 2,190.
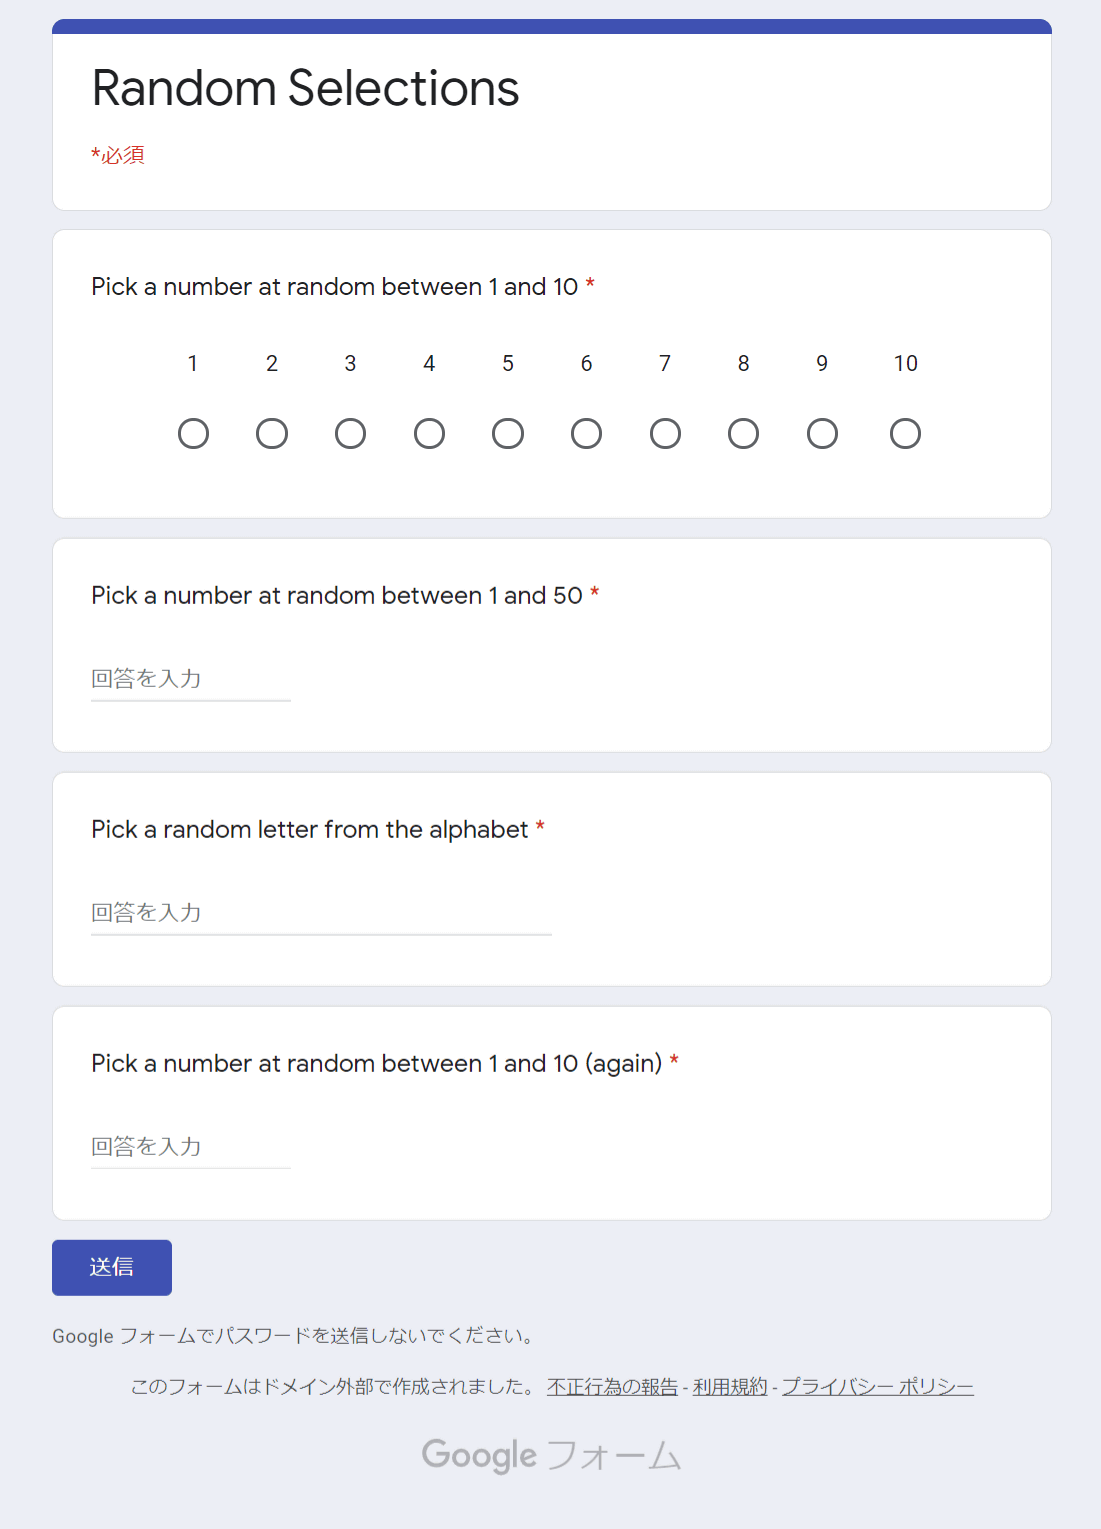
Below is the Google form that was actually posted to Reddit. Of the four questions asked, the first and fourth questions have exactly the same question, 'Please choose a number from 1 to 10 at random', but the first question is from '1' to '10'. The answer is to select up to ', and the fourth question is to answer by directly entering the selected number. In addition, the second question is a question of randomly selecting numbers from 1 to 50 and directly inputting them to answer, and the third question is a problem of randomly selecting and inputting one from 26 types of alphabets from A to Z. I am.
In a pre-survey forecast, Williams predicted that 'when choosing from numbers arranged like the first question, people are more likely to choose a more central number.' However, comparing the results of the first and fourth questions, it was said that the frequency with which each number was selected was almost the same.
◆ 1st and 4th questions
The following is a graph summarizing the results of the first question (left) and the fourth question (right). The horizontal axis is the number selected and the vertical axis is the number of people selected. Since the probability that one number will be selected is 10%, in theory, 219 people (thick dotted line) will be selected for each number. It was found that the difference in the actual number of people from the theoretical value of 219 was about 2.1% on average for both the first and fourth questions.
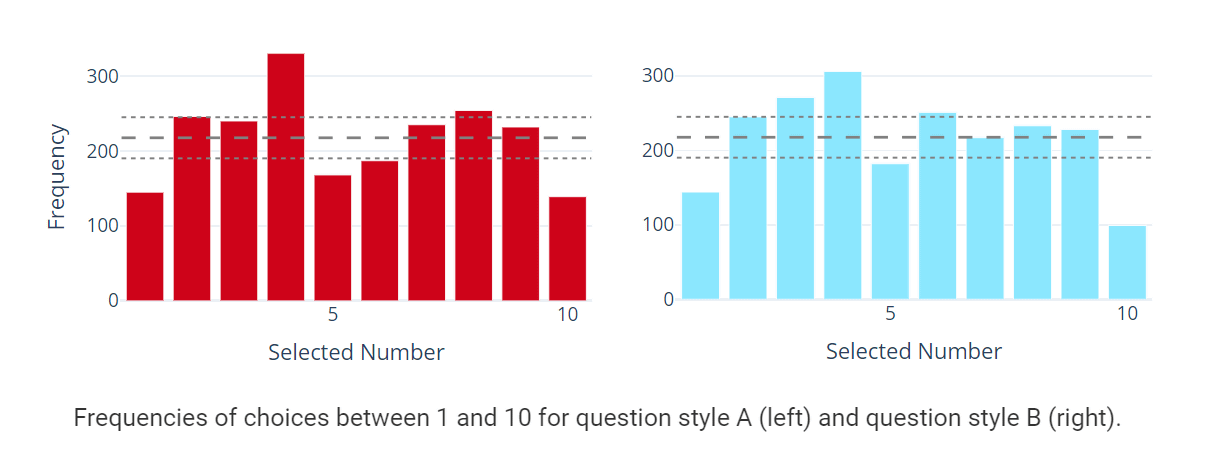
In both the first and fourth questions, the number most frequently selected was '4'. A similar
In addition, '1' and '10' at both ends of the options were selected less frequently than the numbers near the center. Williams advocated the ' edge effect ' that 'when people are forced to make a choice, they tend to avoid the ones at both ends of the choice.'
In addition, it seems that '10' was selected less frequently in the 4th question where you enter numbers directly than in the 1st question where the choices are lined up side by side. Williams says that since '10' is a two-digit number, it requires more effort to enter than other numbers, so '10' is often selected in the fourth question of entering numbers directly. I'm guessing it's getting lower.

In addition, when Williams performed a
In addition, Williams pointed out that numbers such as '1', '5' and '10' may have been chosen less frequently because they were considered 'too good' and avoided. 'We couldn't show the complete randomness of people from this study,' he argues.
On the other hand, if all the results did not go according to theory, that is not the case. For example, we found that 10.1% of all respondents chose the same number for both questions. In theory, there is a 10% chance that the same number will be chosen for both problems, so this result is fairly close to the theoretical value.
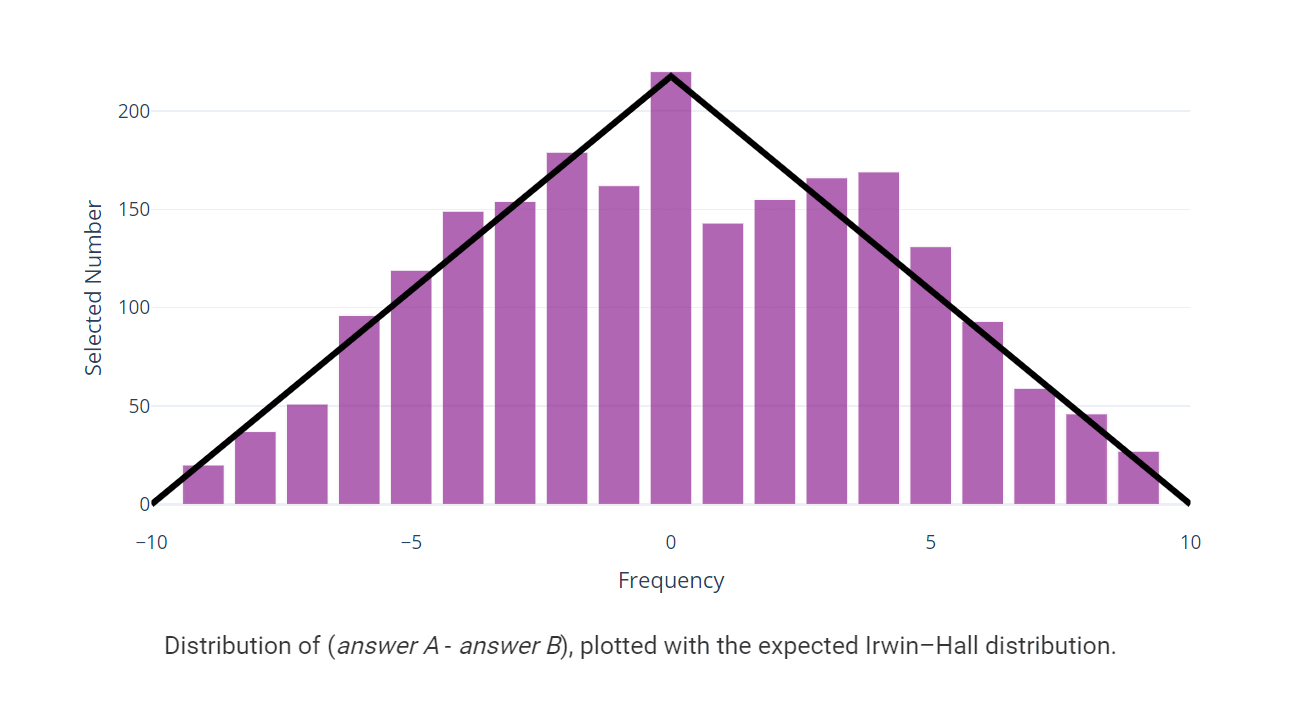
When the number answered in the first question is A and the number answered in the second question is B, the distribution of the difference between the answers expressed by 'AB' is shown in the figure below. The horizontal axis shows the values A to B, and the vertical axis shows the number of selected people. Williams says that the graph is close to the theoretically expected triangular distribution , giving a glimpse of human randomness in the 'choose a number twice' part.
◆ Third question
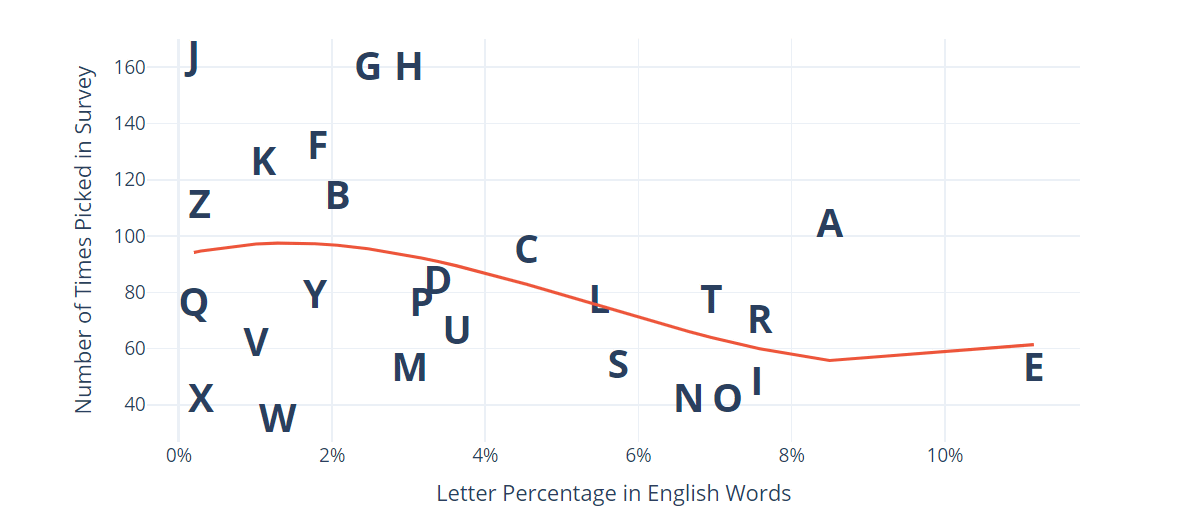
The result of the third question is as follows. The horizontal axis is the selected characters, and the vertical axis is the selected number of people. Theoretically, about 84 people (thick dotted line) should select each character, but if you look at the graph, you can see that the number of people selected varies depending on the character.

The third question, which randomly selects from a 26-character alphabet, is a system that selects letters instead of numbers, unlike other questions. If the 'edge effect' seen in the results of the first and fourth questions is certain, then the frequency of A and Z should be less than that of the other letters, but that is not the case at all, and the third question. The result does not appear to have edge effects.
The following is a graph that summarizes the frequency of the alphabet appearing in English (horizontal axis) and the frequency of the alphabet being selected in the actual survey (vertical axis). The 'E', which appears most often in English, was not very popular in the survey. On the other hand, the letters 'J', 'K', 'F', 'G', and 'H' do not appear very often in English, but the questionnaire shows that they are popular.
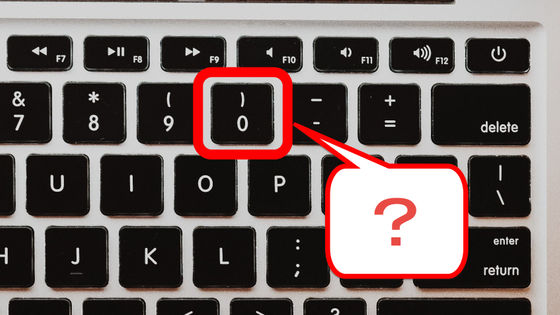
Williams argues that the keyboard layout has a major impact on this popularity. Below is a heat map showing the frequency selected in the questionnaire on the QWERTY layout of the keyboard. You can clearly see that the input of the center key is higher than the other keys. In other words, the edge effect is clearly visible on keyboard input.
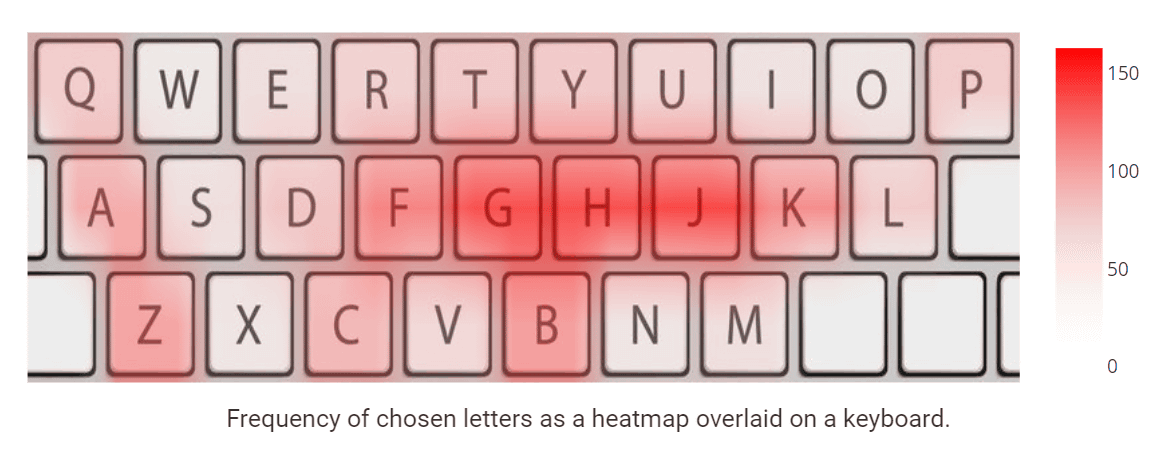
Also, the reason why the 'Q', 'A', and 'Z' parts are so popular is that 'when operating a PC, people hold the mouse with their right hand and put their left hand on the left side of the keyboard,' Williams explained. I am. 'Most people just push where they already have their hands. We can't choose randomly, we're just lazy,' said Williams.
◆ Second question
Then, what happened to the result of the second question, 'Randomly select from 1 to 50', is the graph below. The horizontal axis is the selected number, and the vertical axis is the selected number of people. Williams speculated that the second question had a wider range of choices than the other questions, so the edge effect might be less likely to appear.
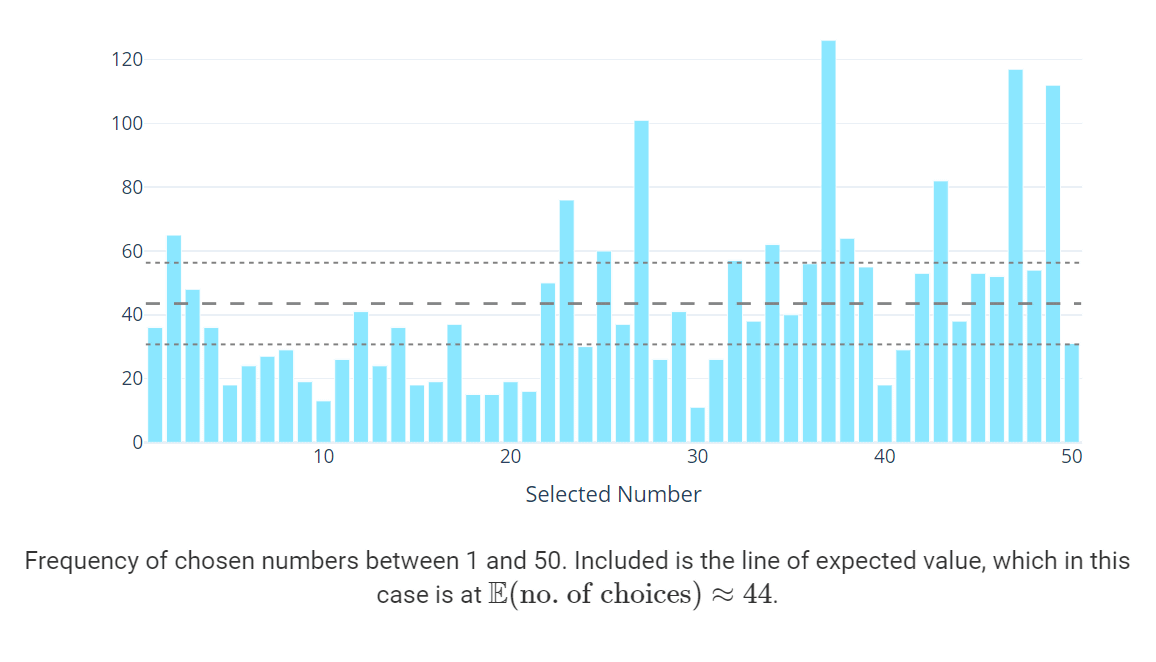
Theoretically, 2190 ÷ 50 = about 44 people (dotted line) will choose for each number, but in reality there is a considerable difference in frequency. The least frequently selected was '30', which was selected only in 0.5% of the total, the most frequently selected was '37', and 5.8% of the total was selected. did.
The total of those who selected '10', '20', '30', '40', and '50' from '1' to '50' should have been 10% of the total in theory, but actually 4.3%. was. In addition, 18.7% of the respondents chose '7', '17', '27', '37', and '47'. Williams predicts that many people probably avoided multiples of 10 because they thought it was too sharp. On the other hand, he says that choosing numbers that include '7' for some reason is a very interesting result. Although there is no edge effect, 'the tendency to avoid numbers with good sharpness' is a tendency that was also seen in the first and fourth questions.
◆ Summary
'As expected, humans are less accurate when viewed as a random number generator, and it turns out that it's quite difficult to randomly select items,' Williams said. In addition, although regular choices such as letters and numbers were used in this survey, Williams said, 'If you choose completely unrelated choices such as nose, calendar, people, dogs, politics, etc.' Is it chosen randomly? No, I think the order in which the choices are displayed will probably lose the randomness. Even if you have multiple items side by side, the first and last choices will be picked at other times. It's far less than an option. '
Related Posts:


in Science, Posted by log1i_yk