A service that displays economic indicators in real time such as American household debt and market capitalization of companies "Is the stock market going to crash?"

Although it is a strong US economy, if you look at economic indicators, it is possible to predict "Is there a backing for the economy?" "How about the long-term future?" Service that displays real-time preliminary report value on four indicators related to the American economy "Is the stock market going to crash?"You can grasp the realities of the American economy.
Is the stock market going to crash?
https://isthestockmarketgoingtocrash.com/
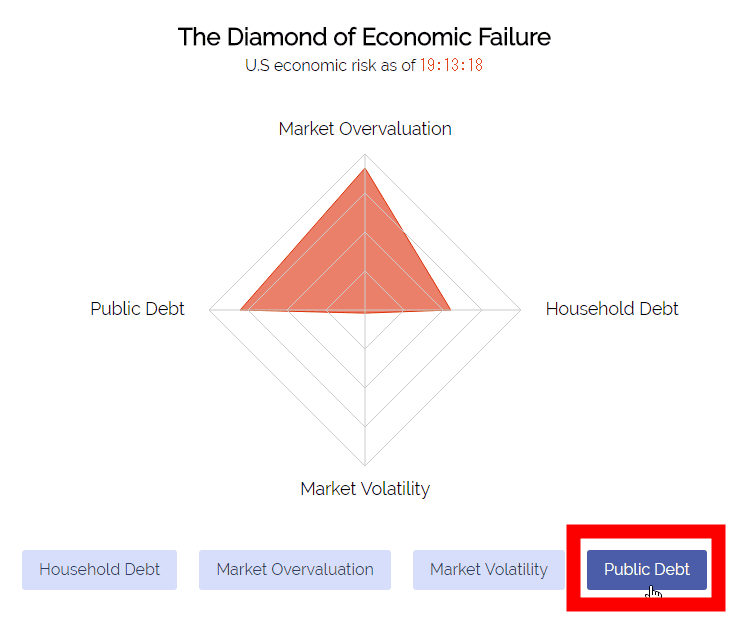
"Is the stock market going to crash?" Shows a radar chart on four indicators in the American economy, by default "Household Debt" (household debt) is specified.
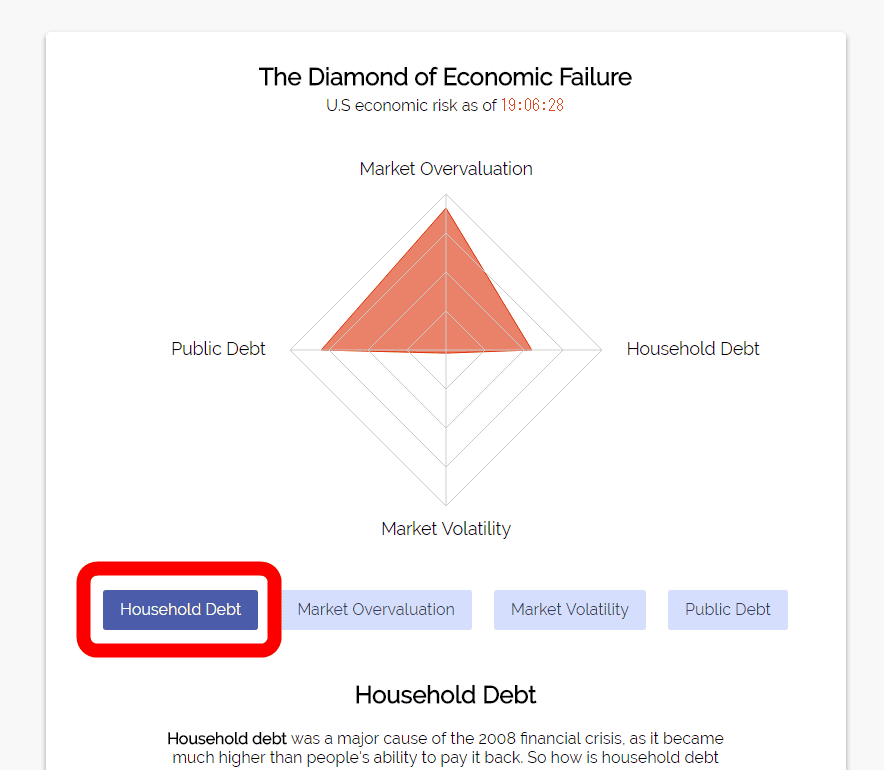
"Household Debt" is the amount of debt (debt) held by resident of the United States as its name, and at the time of article creation, the total amount was displayed as a tremendous amount of about 15.6 trillion dollars (about 1730 trillion yen) It was. The amount of money is changing in real time, but since the debt is mainly borrowed from financial institutions, it is understood that the amount increases with interest at an astounding rate, and it is a level to fear unexpectedly. If interest is on 1730 trillion yen, it is also unexpected that the amount of money will swell more than $ 10,000 (about 1.1 million yen) per second. Also, not only the total amount of liabilities but also "GDP" in the United States and "Household Debt as% of GDP" (ratio of liabilities to GPD) are displayed in real time. By the way, at the time of article creation, "Household Debt as% of GDP" was slightly decreasing as GDP growth rate exceeded debt interest rate.

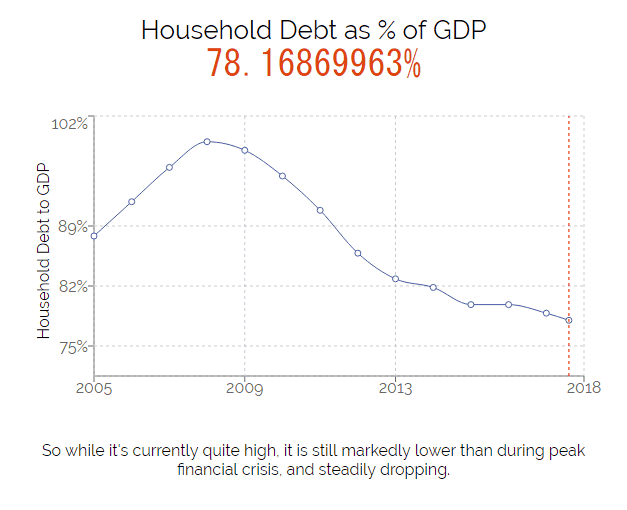
"Household Debt as% of GDP is graphed annually, which seems to be decreasing in recent years thanks to the strong US economy.
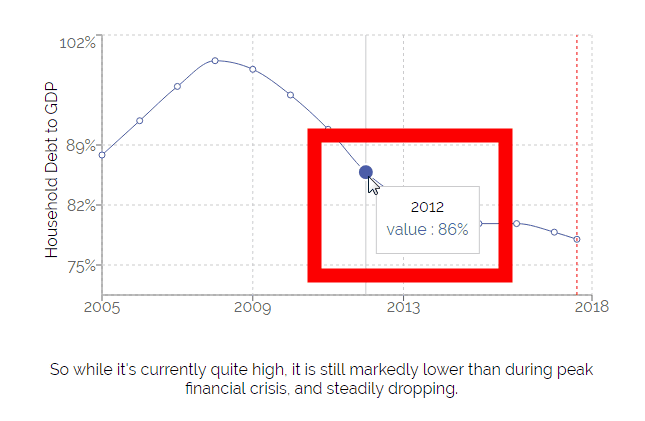
Click on the point on the graph to display the numerical value for that year.
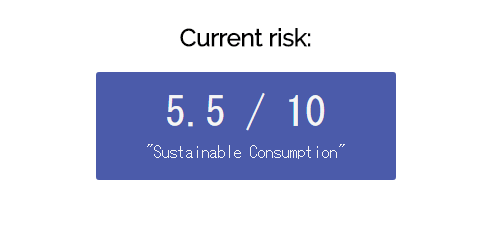
"Current risk" which indicates the crisis level of the current situation financially is "5.5" full of ten, is "Sustainable Consumption" (continuous consumption).
Click on the button under the radar chart and designate "Market Overvaluation" (over market rating) ...
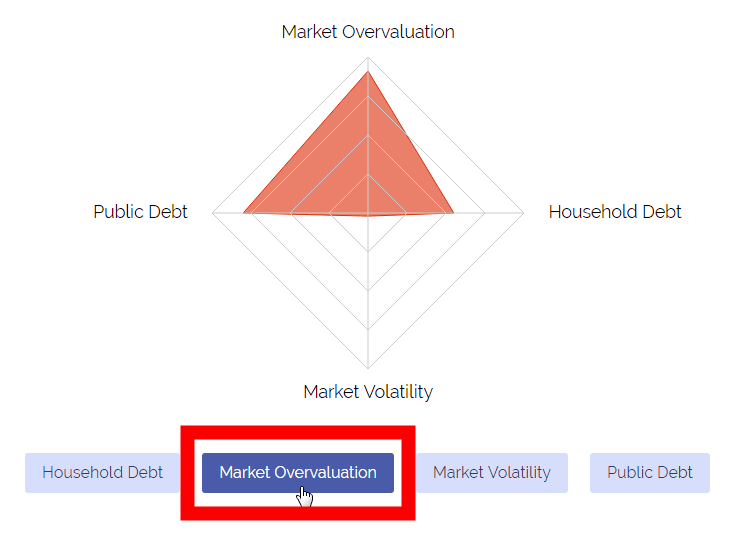
A numerical value related to "Market Overvaluation" was displayed. In addition, "Market Overvaluation" is calculated by contrasting the market market trend and supply. "CRSP total market index" to estimate market capitalization of US stock market from CRSP, "US total stock market value" and "GDP" which is the market capitalization value of companies considered by US stock market investors are displayed in real time I will.
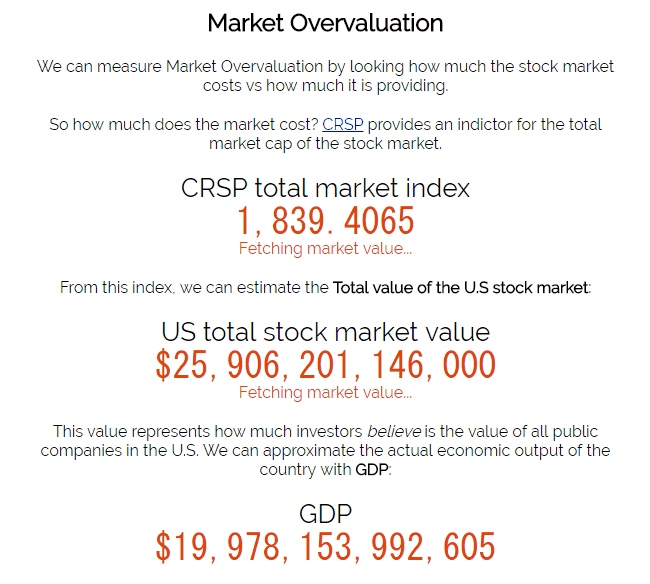
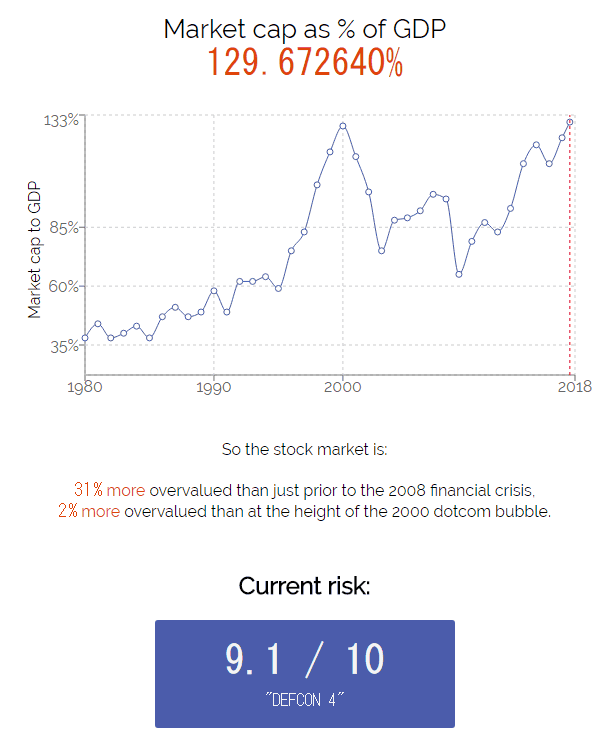
"Market cap as% of GDP" shows the ratio of "US total stock market value" to GDP. The value at the time of article creation is 129%, which means investors' expectations are above GDP, so you can see that the market is overestimating the American economy. The crisis level is "9.1" which is a perfect score of 10, "DEFCON 4From the comment of "It seems to be quite dangerous."
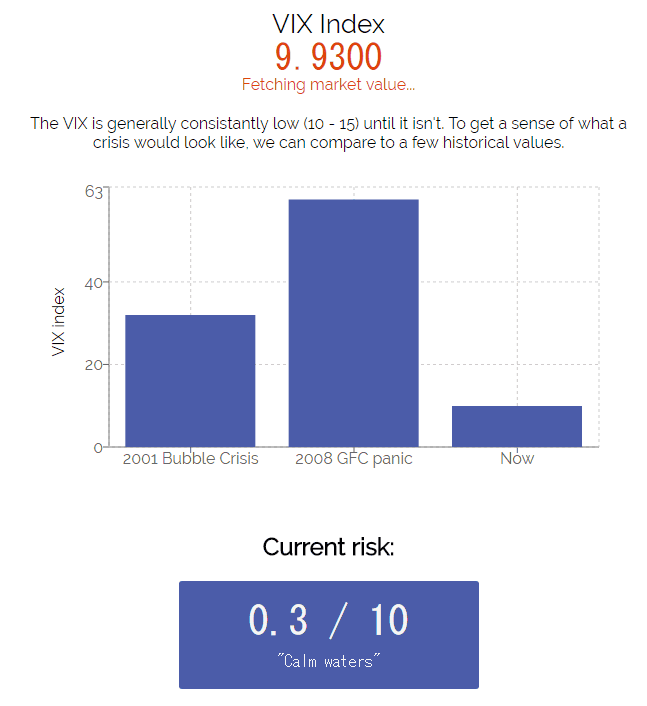
Choosing "Market Volatility" (financial market instability) ...
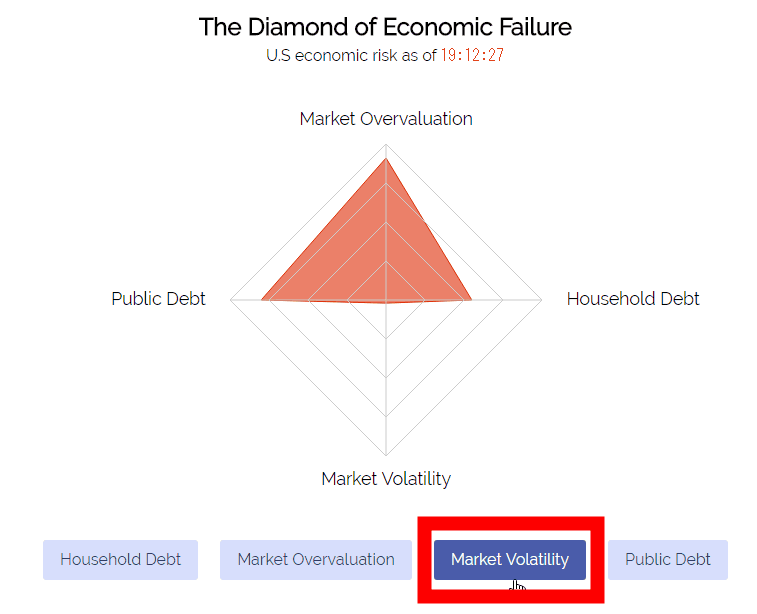
"VIX Index" of the index to compare with the past financial crisis will be displayed. "VIX Index" at the time of article creation is 9.9300, which is cute as compared with the Lehman shock in 2008 and the dot com bubble in 2001. The crisis level is 0.3 and it is "Calm waters" (Nagi).
If you select "Public Debt" (public debt) ...
"Public Debt as% of GDP" showing the ratio of Net Public Debt to GDP and the value of "Net Public Debt" of the total of the debt of the country and the local government is displayed in real time. From the graph, it has been confirmed that the Public Debt as% of GDP has been flat for the last few years.
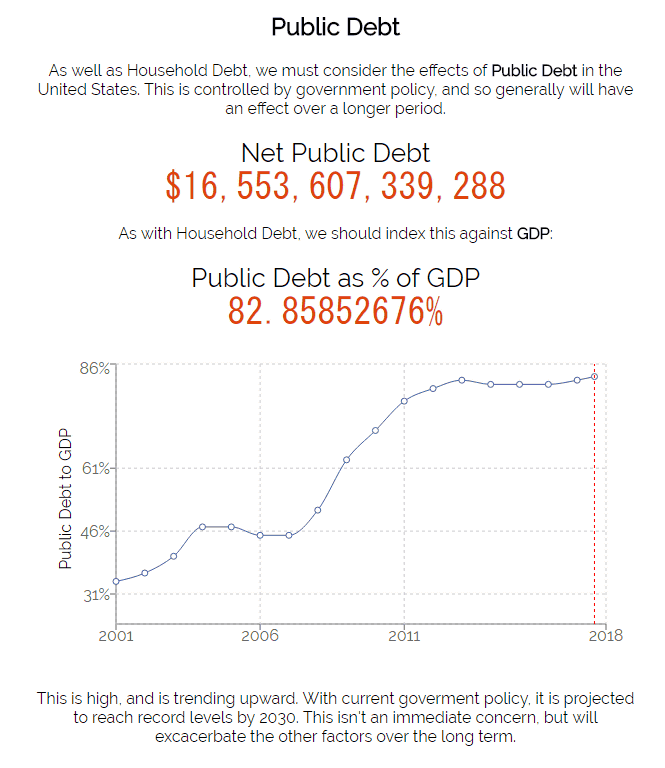
It seems that the crisis level of public debt is "10.1 point full" in "8.1" and "Time bomb" (time bomb), it seems to be a state of disappointment.

·bonus
"Real-time budget deficit counter" is known as a service that displays the budget deficit in Japan in real time.
Real time budget deficit counter 15
http://www.kh-web.org/fin/

It is like this when dividing the country's long-term debt balance at the time of article creation by the total population of Japan. The per capita debt amounted to 6,841,334 yen. The majority of long-term debtGovernment bondSo, it is not necessary to repay this much debt, but it is surprising that it is a considerable amount.

Related Posts:


in Review, Web Service, Posted by darkhorse_log