"Annual income map of household" that you can see at a glance which households have annual income "less than 3 million yen" or "10 million yen or more"

ByPersonal Creations
Ministry of Internal Affairs and Communications statistics bureau has publishedHeisei 20-year housing and land statistics surveyThere are data "household's annual income class (5 categories)", which is "less than 3 million yen, 3 million yen to 5 million yen, 5 million yen to 7 million yen, 7 million yen to 10 million yen, It is investigated how many households are 10 million yen or more ", but mapping the data on the map is"Household annual income map"is. By specifying "areas where households with annual income of 10 million yen or more exceeds 5%", it becomes clear at a glance what kind of annual income households are in which area.
Household annual income map
http://shimz.me/datavis/mimanCity/
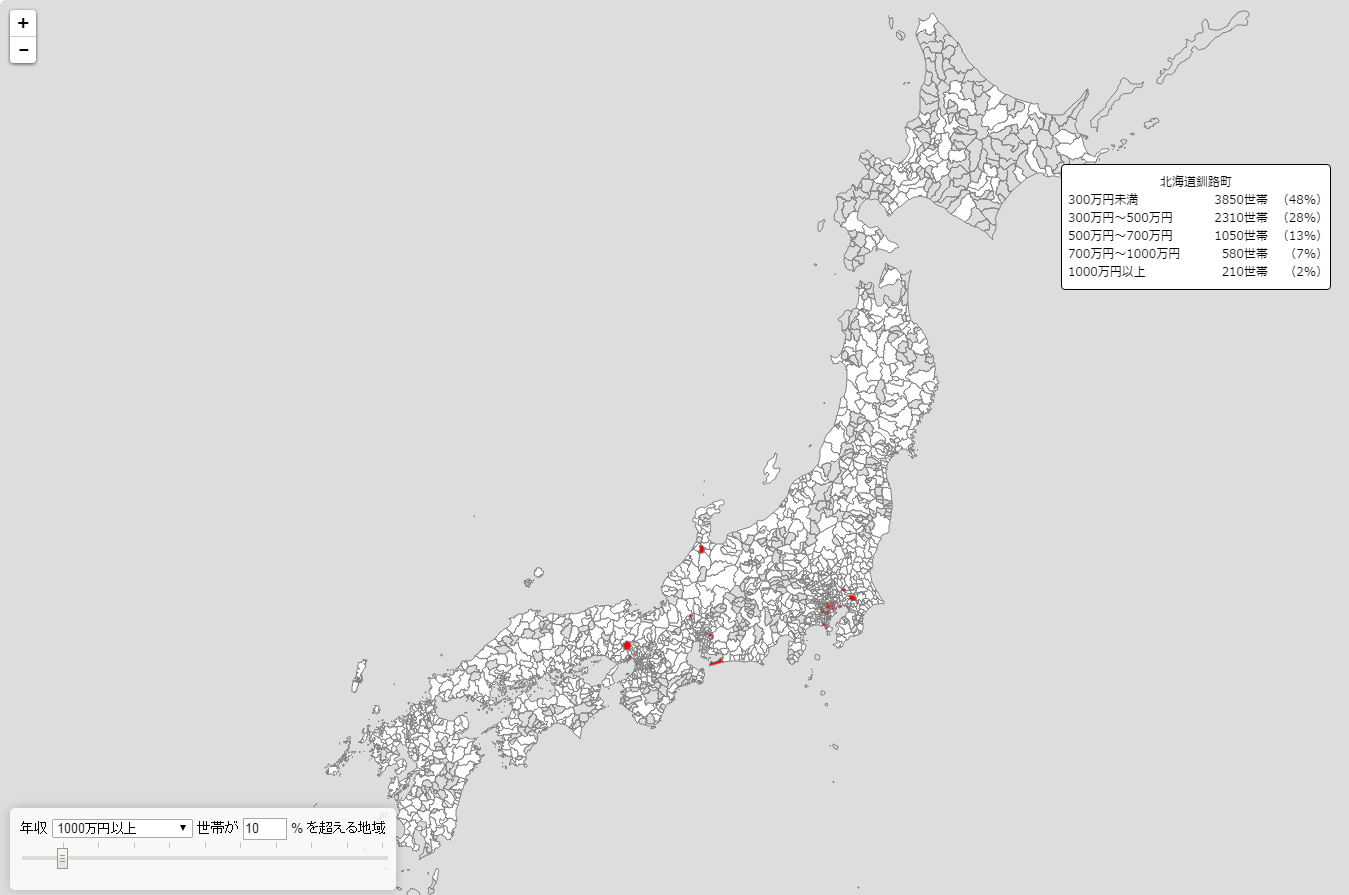
The website looks something like this.
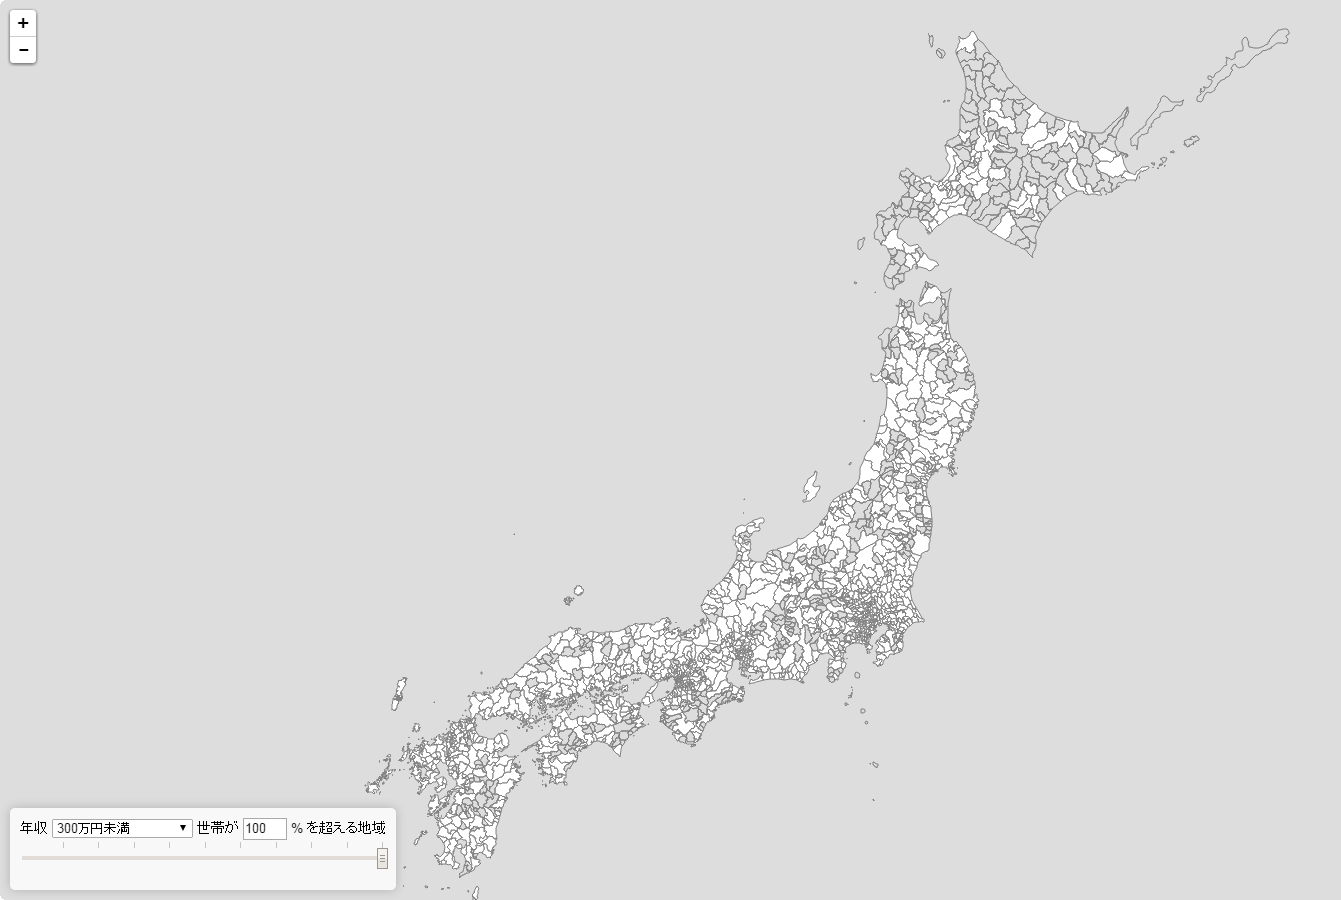
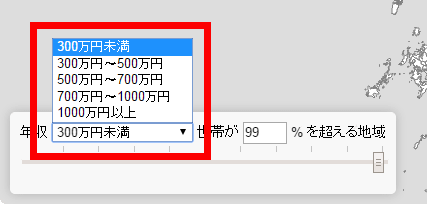
Household annual income from the bottom left of the screen can be set to "less than 3 million yen", "3 million yen to 5 million yen", "5 million yen to 7 million yen", "7 million to 10 million yen", "over 10 million yen" ... ...
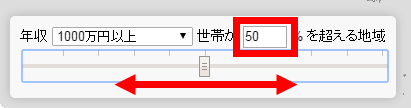
By sliding the bar, you can change the proportion of the household with the specified annual income to the area.
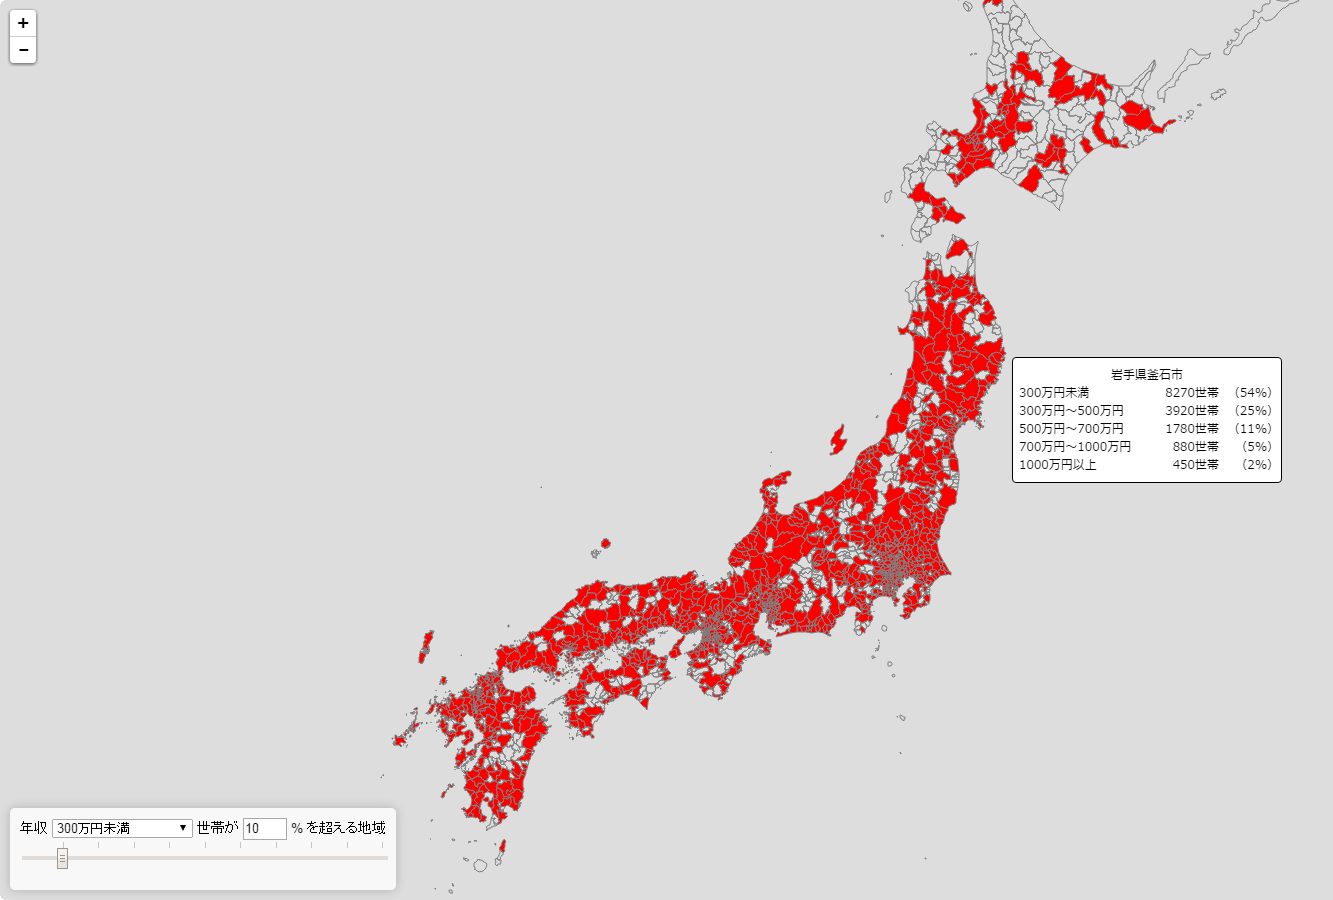
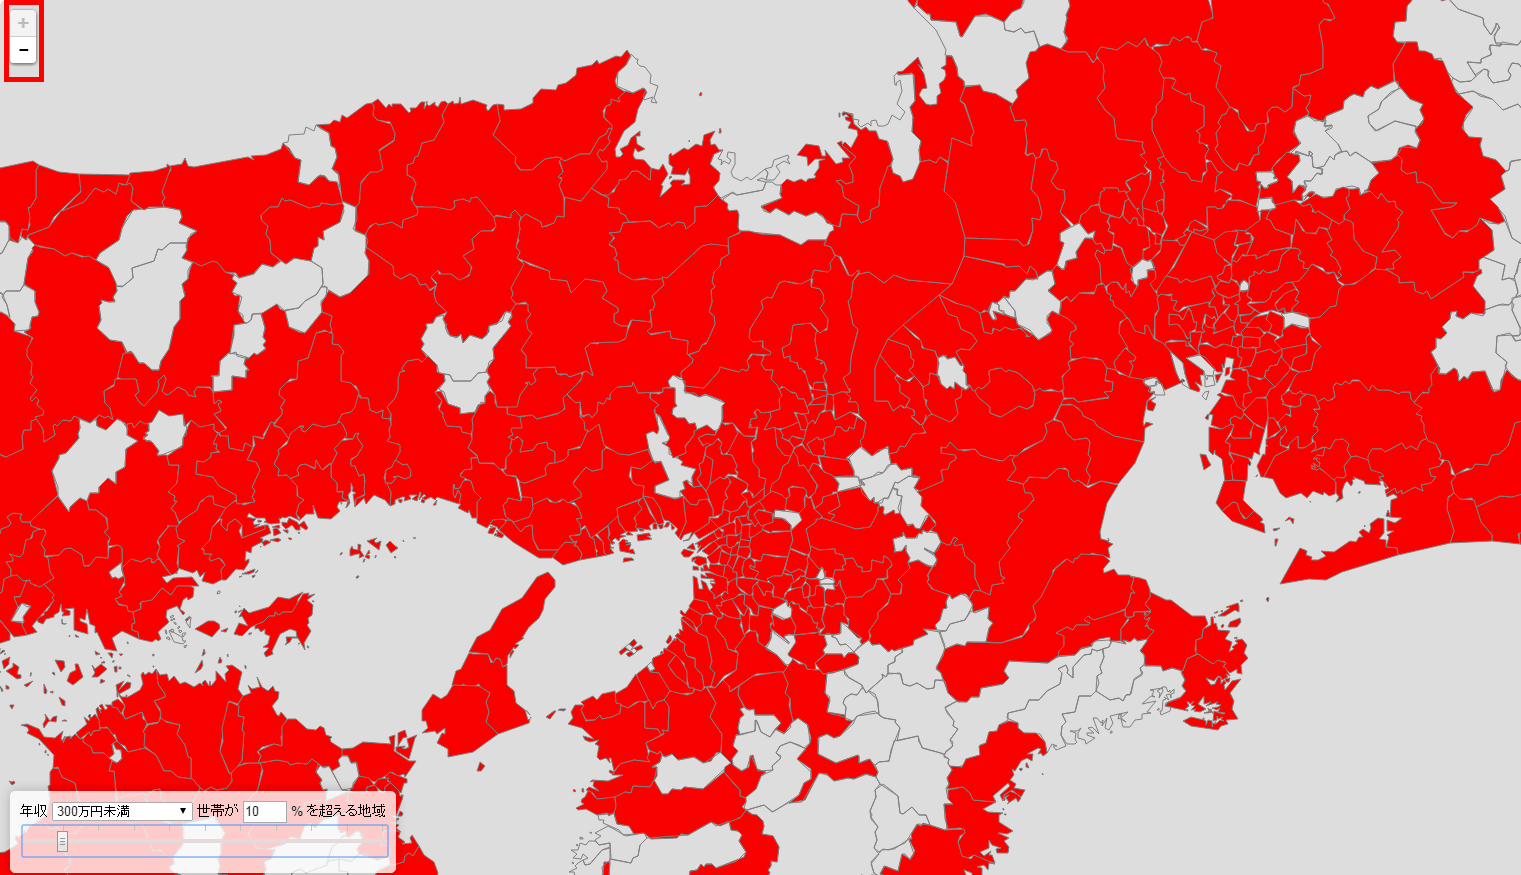
For example, if you designate "a household with an annual income less than 3 million yen exceeds 10%", the relevant area changes to red.
If you use the zoom in / zoom out button on the upper right of the screen, you can also take a closer look at specific areas only. If you designate "a household with an annual income less than 3 million yen exceeds 10%", the Kansai area turns red. The gray area on the map is a part without data.
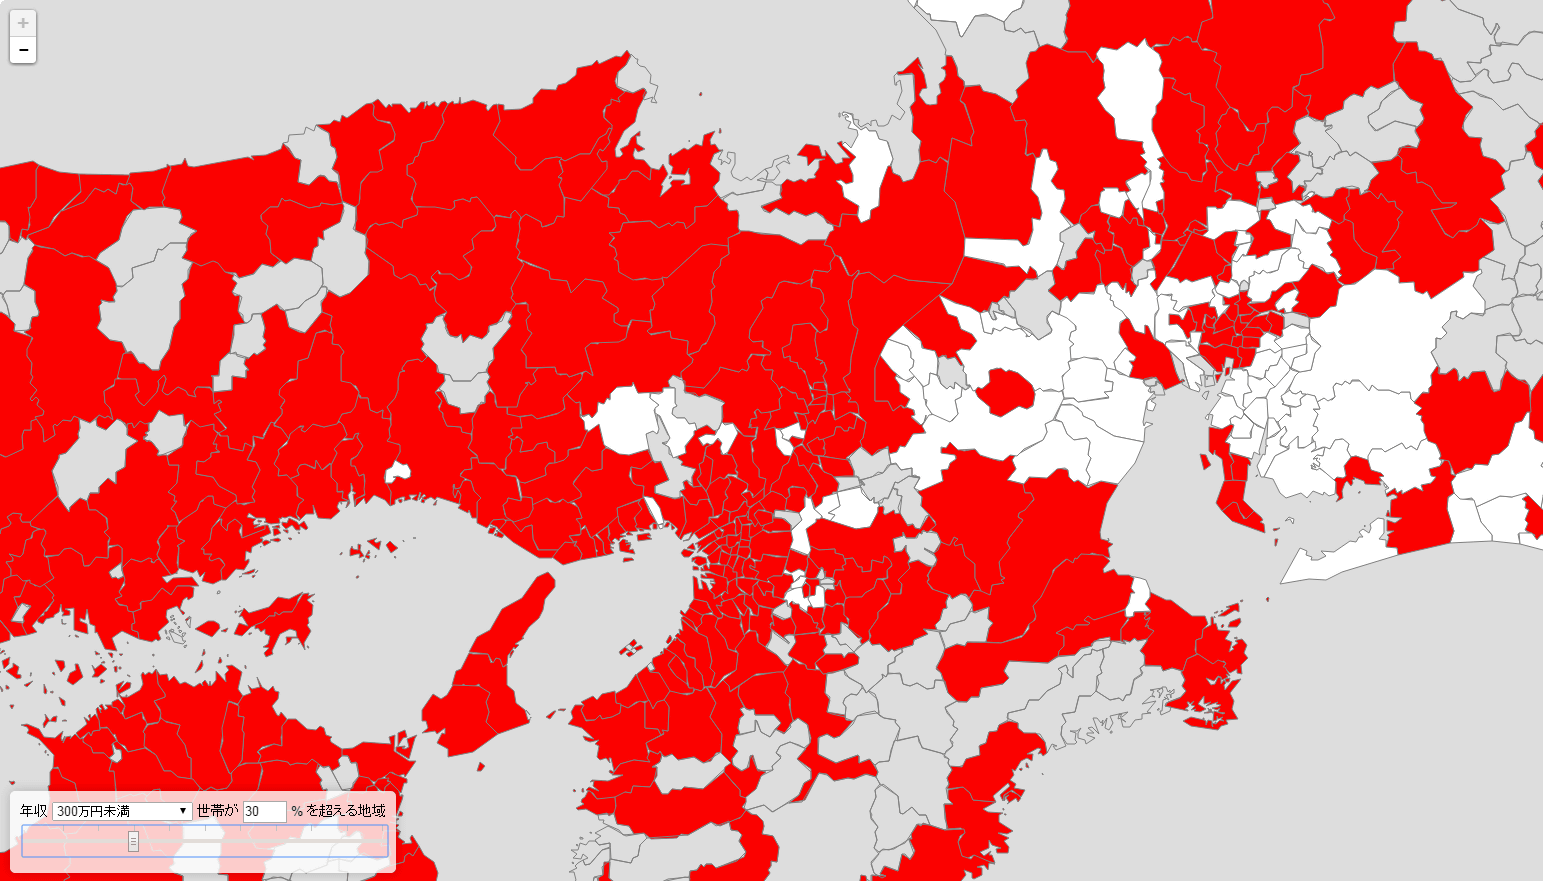
If you designate "a household with an annual income less than 3 million yen exceeds 30%", the area in the east side has come off.
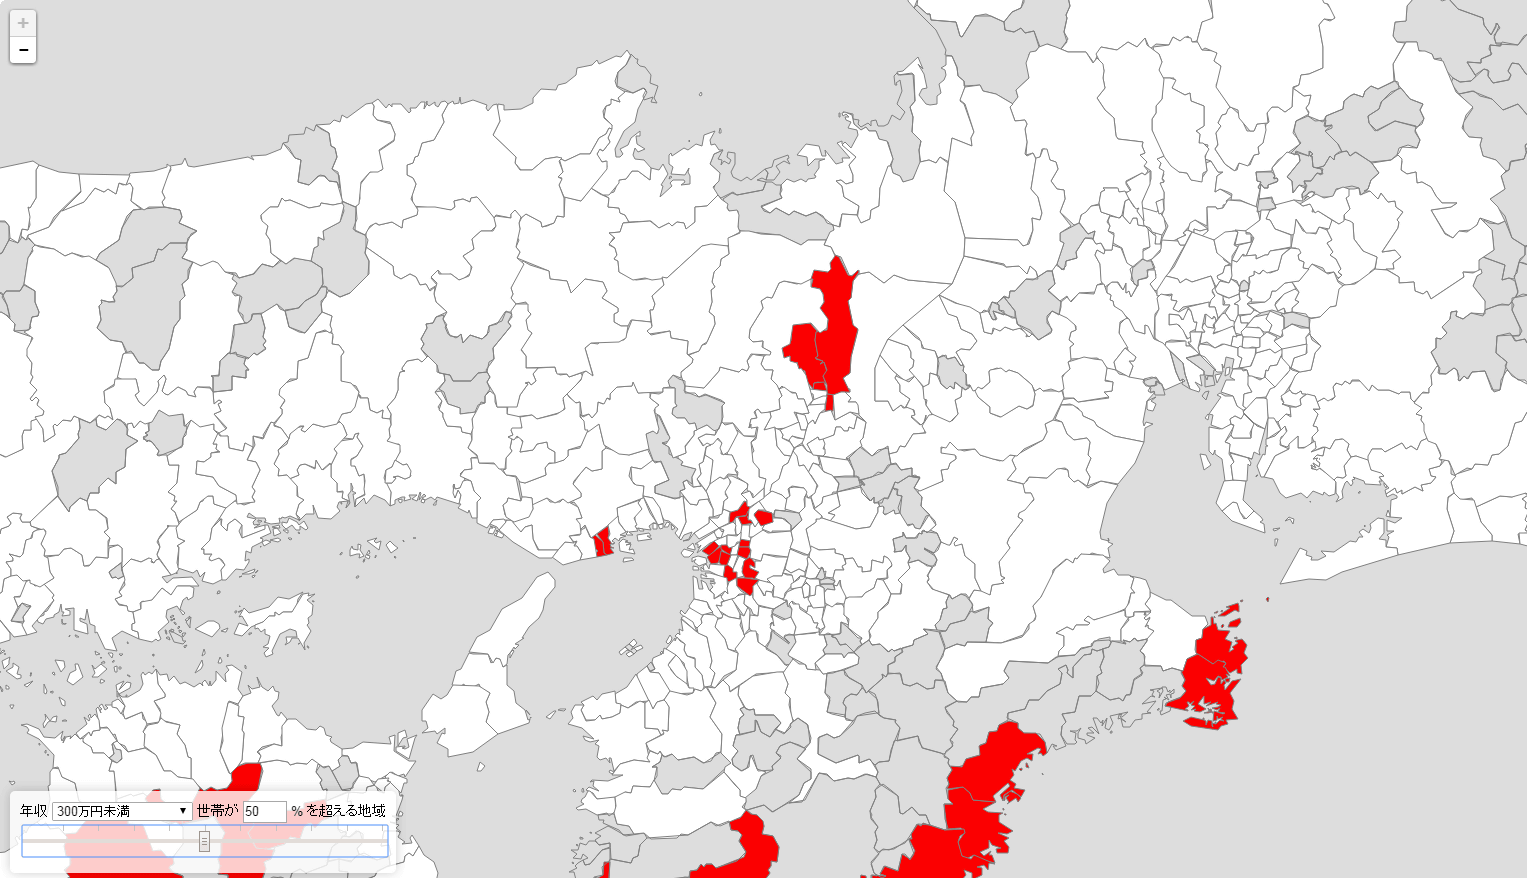
"Area where household with annual salary less than 3 million yen exceeds 50%" is like this.
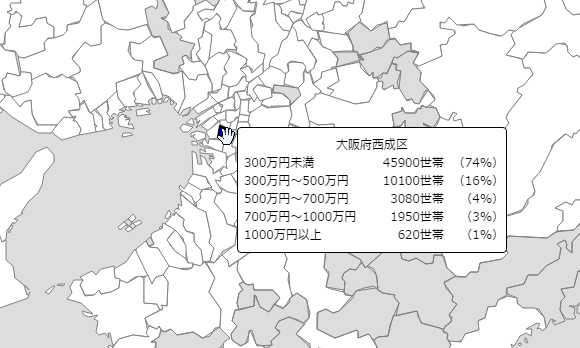
If "households with annual income less than 3 million yen exceeds 70%", only one place turned red red ... ...

I held the cursor and looked at the details, it was Osaka prefecture Nishinari ku. Households with annual income less than 3 million yen are 74% of the total, 16% of households of 3 million yen to 5 million yen, 4% of households of 5 million yen to 7 million yen, and households of 7 million yen to 10 million yen 3%, households with 10 million yen or more was 1%.
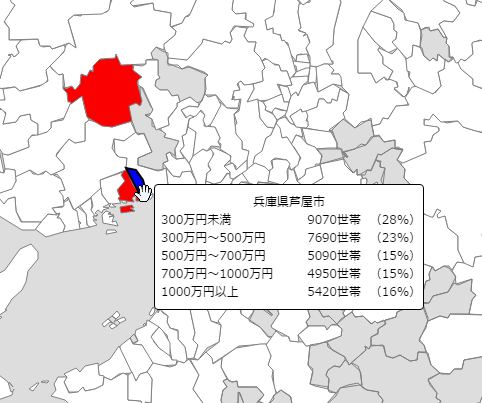
Next time, if you designate it as "a household with more than 10% annual income over 10 million yen", it is a small number nationwide.
Of course, Ashiya-shi, Hyogo Prefecture, which has an image that "money rich madams are gathering" is applicable, and households with annual income of 10 million yen or more occupied 16% of the total.
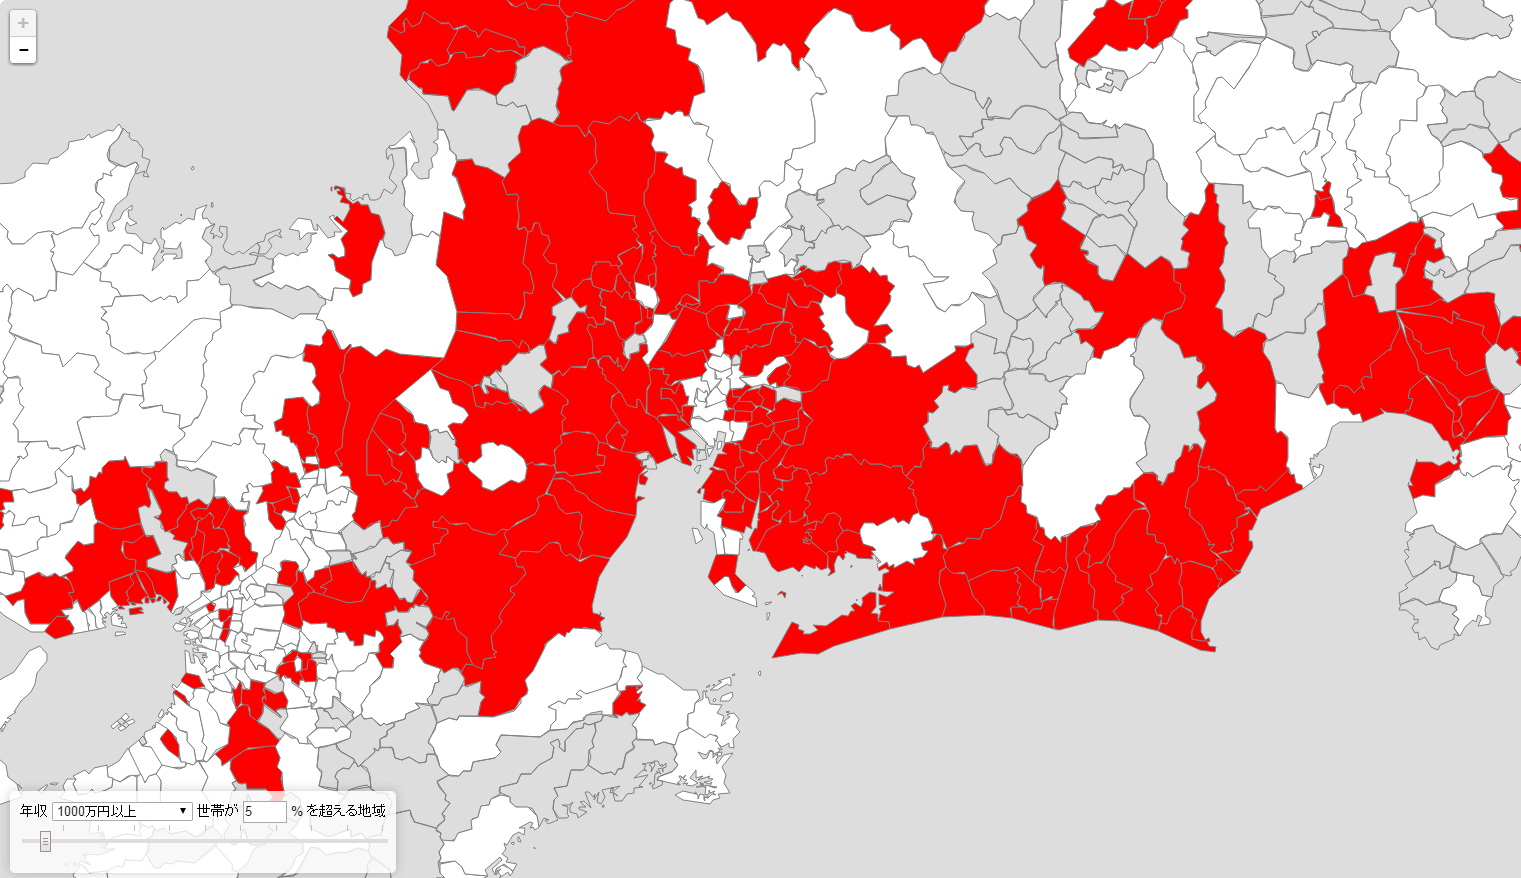
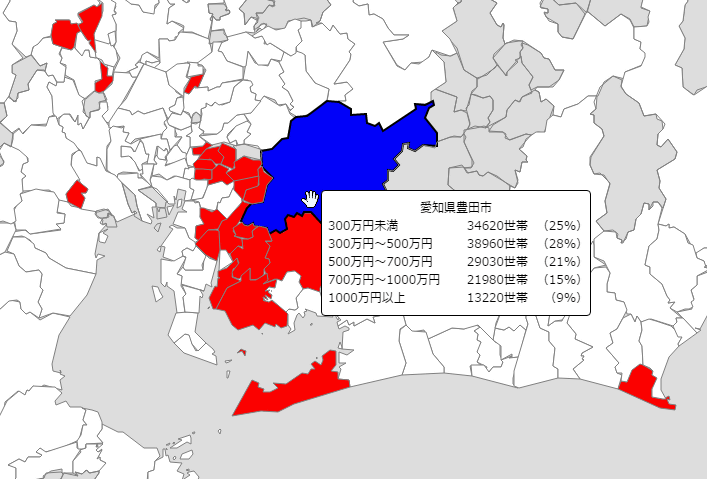
Next, I will look at the Chubu region. "A region where households with annual income over 10 million yen exceeds 5%" is like this.
When you try to "Area where households with annual income over 10 million yen exceeds 8%".
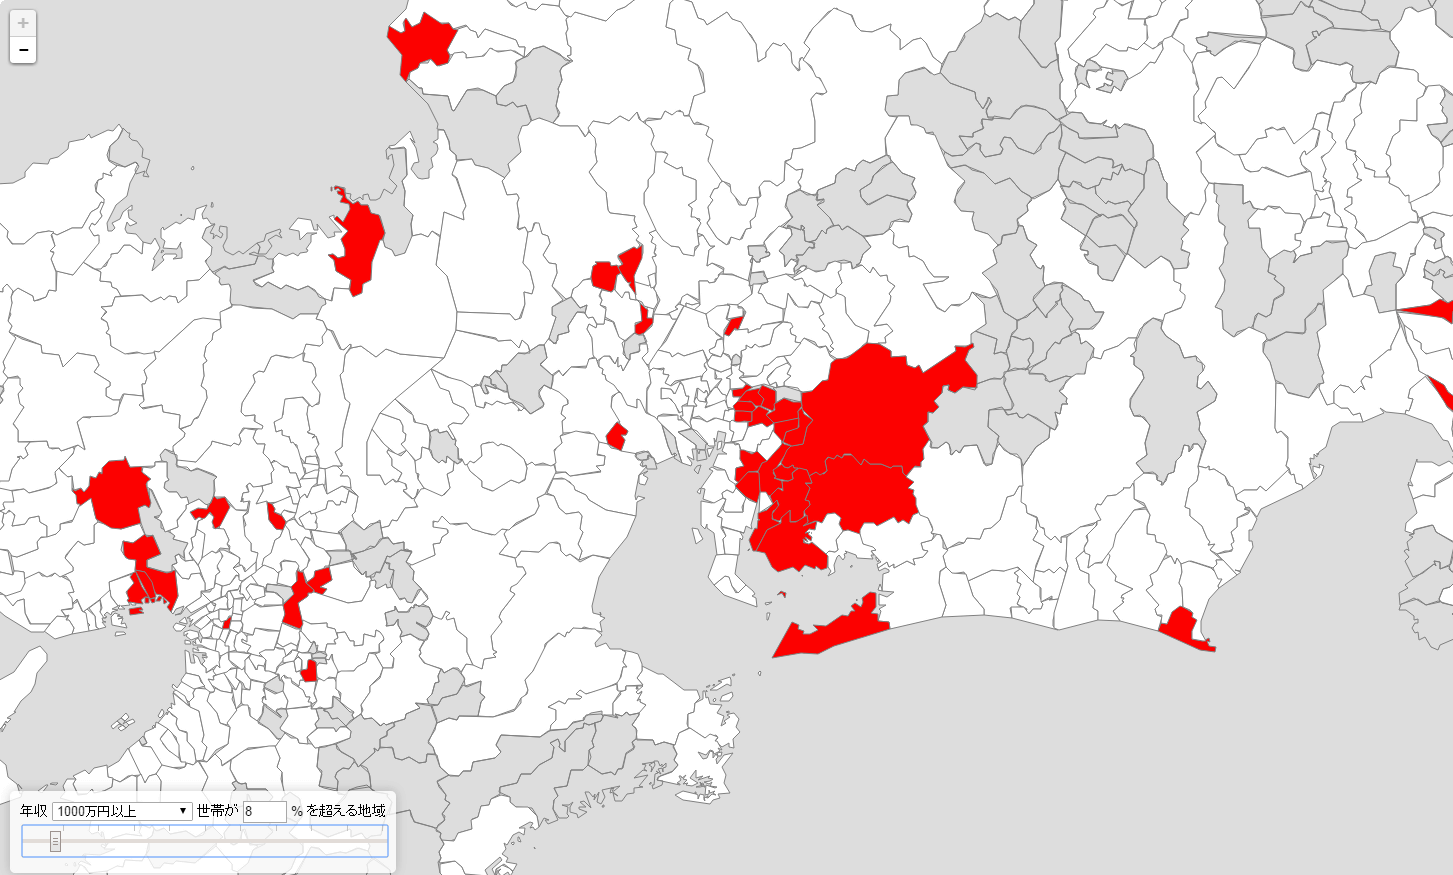
I thought that "Do not concentrate on burning" and held the cursor over, Aichi Prefecture's Toyota-shi, Okazaki-shi, Nishio-shi etc. were lined up. Households with annual income of 10 million yen or more in Toyota City, Aichi Prefecture, accounted for 9%.
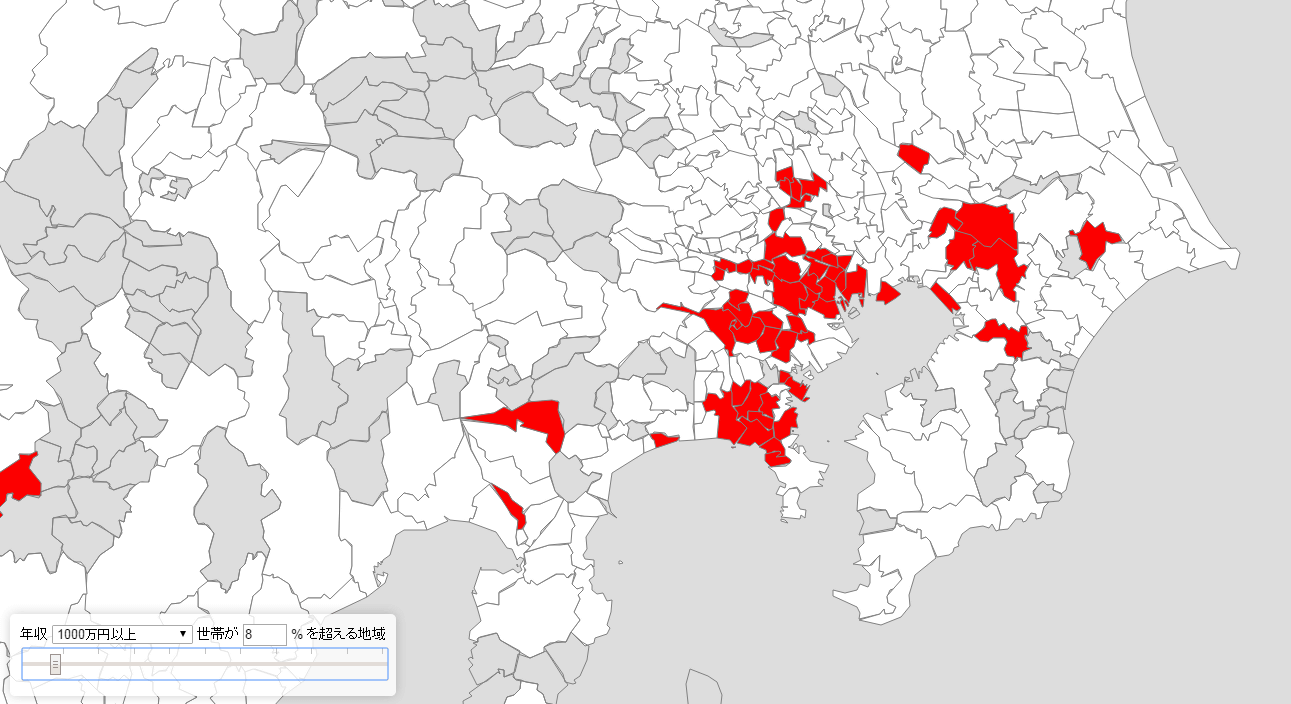
Finally I will look at Kanto. "Regions in which households with annual income over 10 million yen exceeds 8%" are still concentrated in urban areas.
There was also "a region where households with annual income over 10 million yen exceeds 20%".
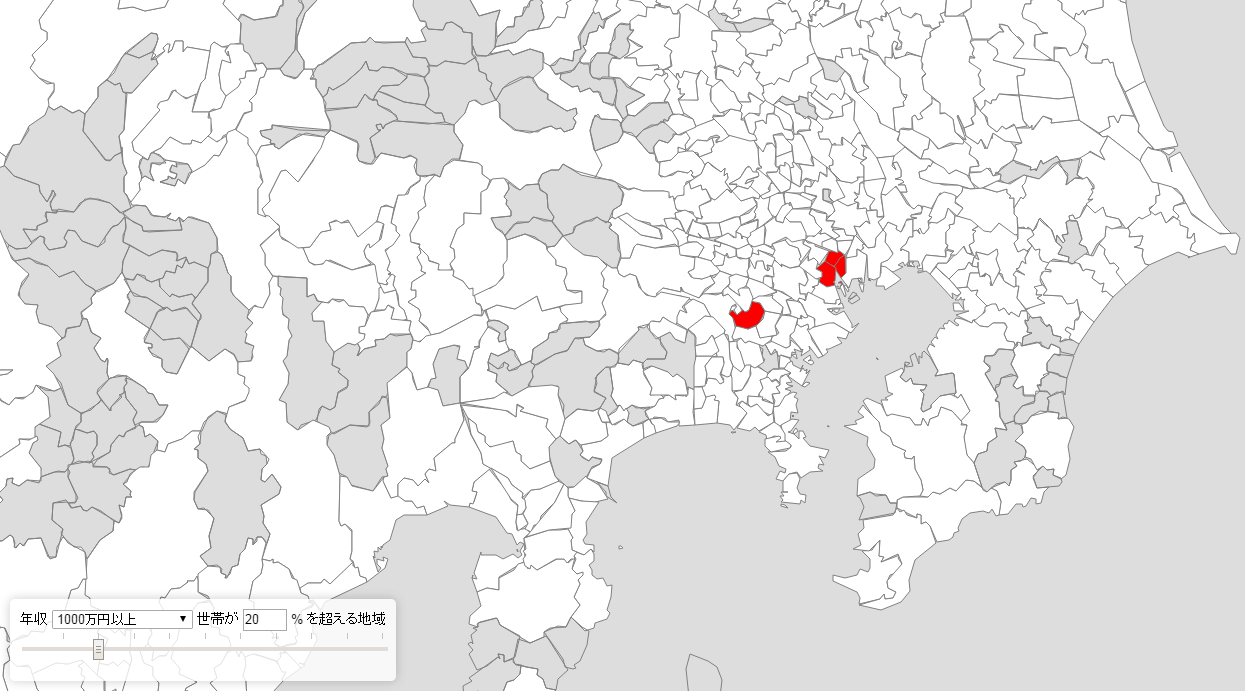
When you hit the cursor, it corresponds to Minato-ku, Tokyo, Chuo-ku, Kanagawa Prefecture Aoba-ku in Tokyo, and 26% of households with annual income over 10 million yen reach Minato-ku with the largest proportion One household knows that annual income is over 10 million yen.

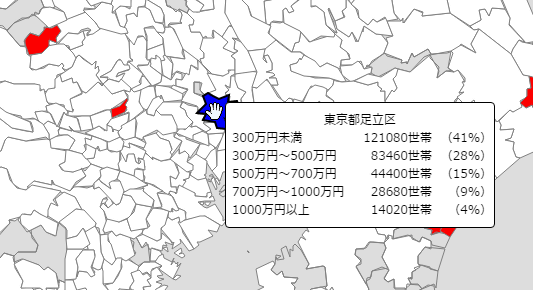
When we look at "a household with more than 43% of households with annual income less than 3 million yen", the donut phenomenon occurred mainly in Tokyo.
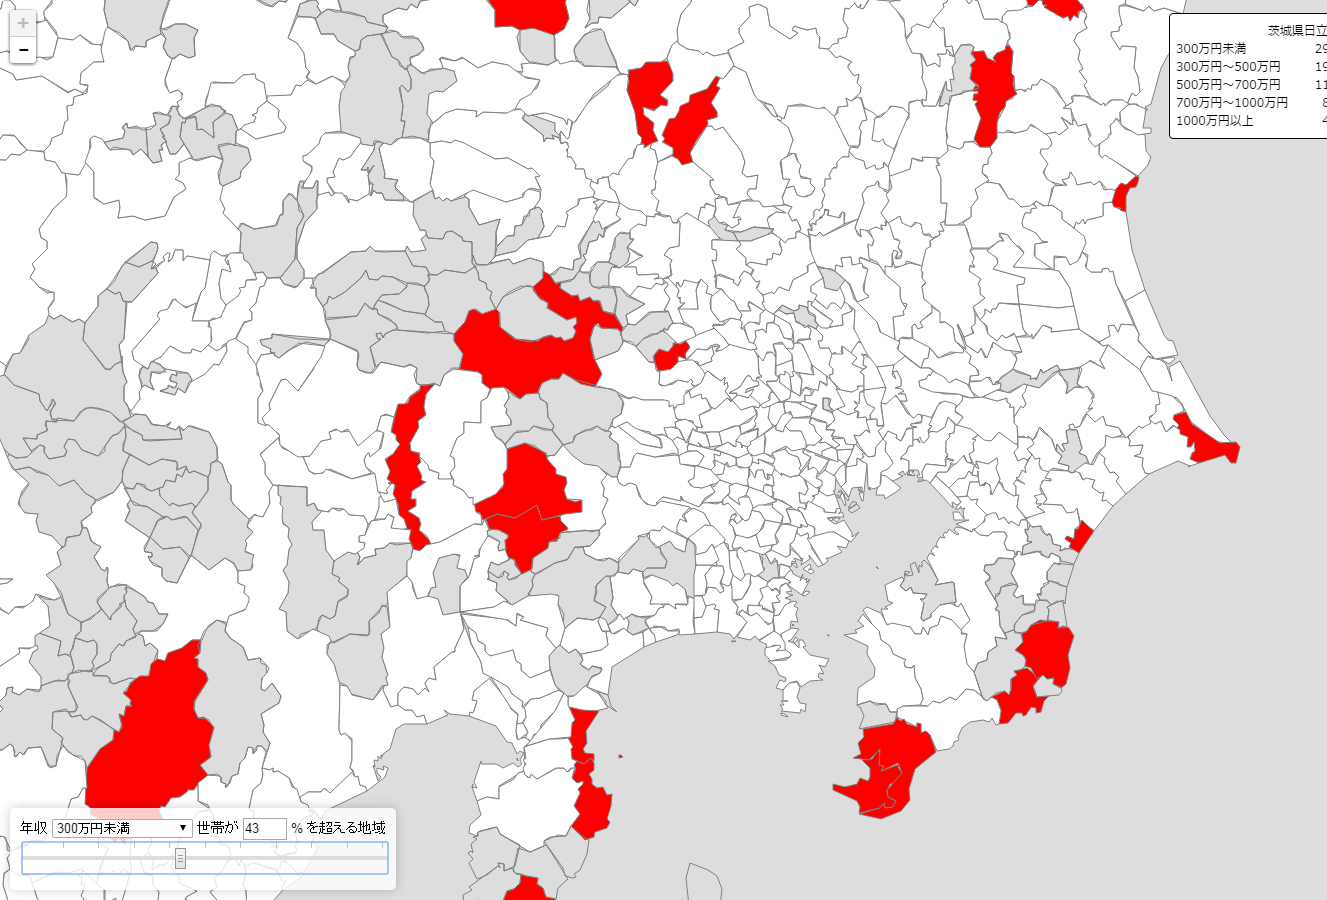
Adachi-ku has a large proportion of households with annual income less than 3 million yen in Tokyo. 41% of households have fallen.
In addition, we created a mapShimizu ShinyaByData is published on GitHub, So that you can use it freely.
Related Posts:


in Review, Web Service, Posted by darkhorse_log