Graph that you can feel "how many more years can you live?"

ByJustin Day
The average life expectancy of Japanese in 2014 was that women were 86.83 years old and male 80.50 years oldSurvey by the Ministry of Health, Labor and WelfareIt is proved by. This record is the highest record for both men and women, with women having remarkably excellent results in the world for the third consecutive year, men also ranked third in the world, and it is once again that Japan is a longevity country even if it is worldwide It has been proved. Death comes to a Japanese who was born in such a long-lived country someday, but if you enter your own sex and age "How many more years can you live?A graph that automatically calculates and displays it as a percentage is released.
Years You Have Left to Live, Probably | FlowingData
http://flowingdata.com/2015/09/23/years-you-have-left-to-live-probably/
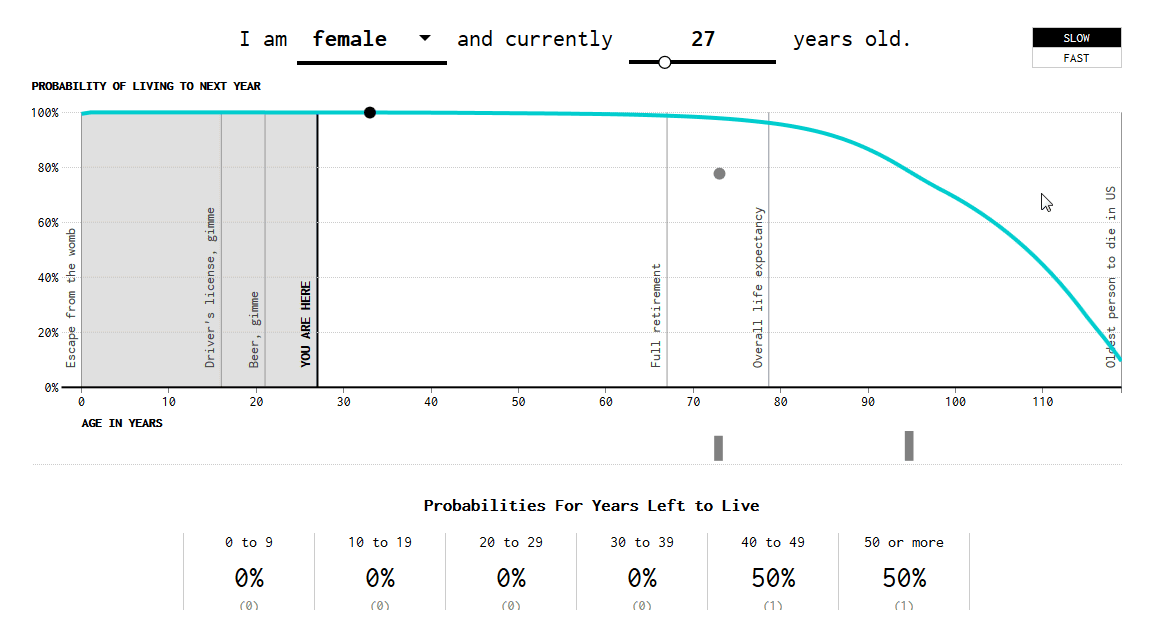
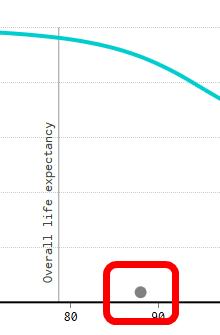
When you fly to the link above, what is displayed in the middle of the page is a graph that you can feel "how many more years can you live?" The horizontal axis of the graph shows age and the vertical axis shows the probability of living to that age.
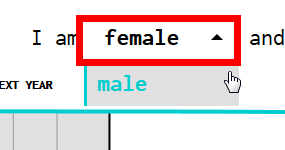
Usage is simple, click "female" at the top of the graph, select "female" for women, "male" for men ... ...
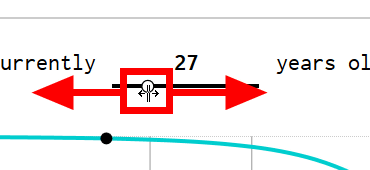
Just move the slide bar under the number "27" to the left and right and set it to your age OK.
Then a black dot running on the graph ......
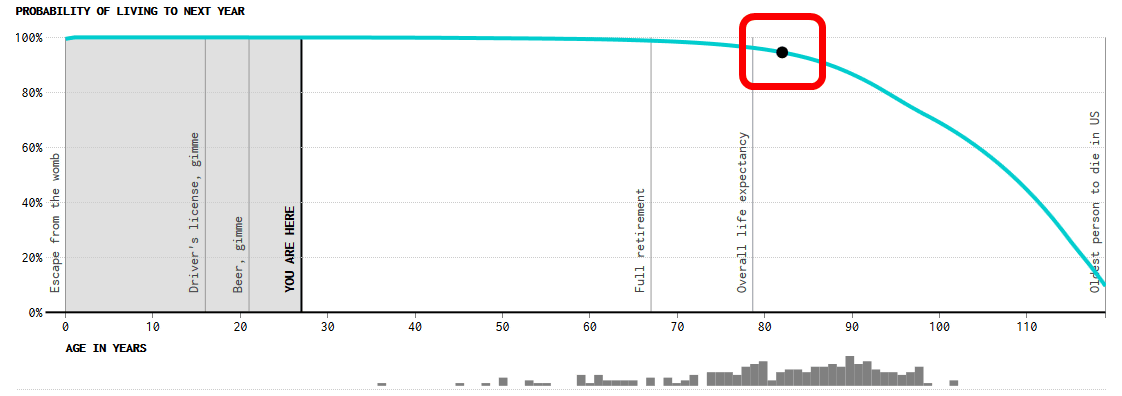
I fall with Potri in this way on the way. This falling point shows "life span" ... ...
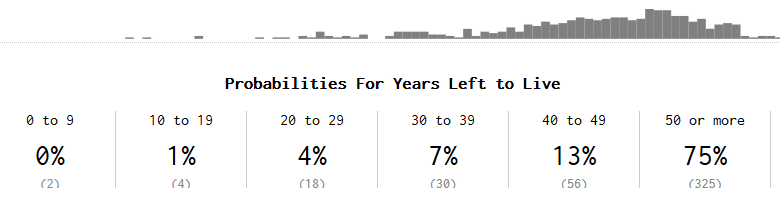
By repeating a number of black dots on the graph and repeating it, "Probabilities For Years Left to Live (the probability of how many more years you can live)" will be calculated automatically under the graph . For example, the following image is data for a 27 year old female, the probability of death by 0 to 9 years is 0%, the probability of death by 10 to 19 years is 1%, the probability of death by 20 to 29 years is 4%, the probability of death by 30 to 39 years is 7%, the probability of death by 40 to 49 years is 13%, the remaining 75% has a lifetime of more than 50 years.
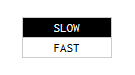
In this "Probabilities For Years Left to Live" part, since the data gradually increases after setting the gender and age, in case you want to know "as long as you can live for many years" early, Click "FAST" of "SLOW / FAST" in the upper right of the graph.
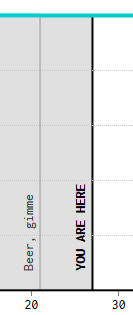
Also, in the graph, data such as "Beer, gimme (age of drinking age to withdraw)" and "YOU ARE HERE (age entered by myself)" are also recorded.
This graph showsAmerican Social Security AdministrationIt is based on the data released by the public, and statistically calculates roughly "How many more years can you live?" By including various cause of death.
Incidentally,America Disease Control CenterAccording to the average life expectancy data of Americans published, the average life expectancy of females is 81 years old and 2 months, the average life expectancy of men is 76 years and 5 months, compared with the average life expectancy of Japanese women 5 Years old, men are less than 6 years old.
Related Posts:


in Creature, Posted by logu_ii