A number of graphs showing the vaccination status of the new corona at a glance have been released, revealing the current situation where vaccination is not as good as in poor countries
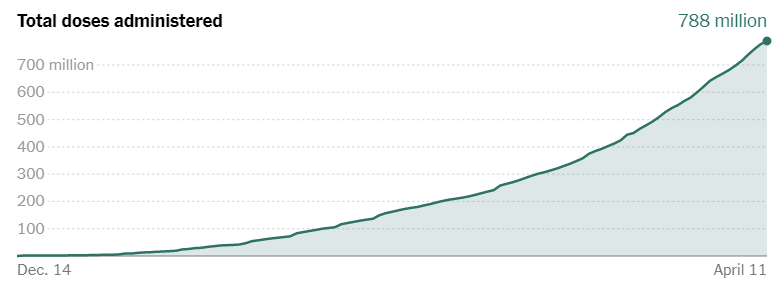
The new coronavirus vaccine has already been vaccinated more than 788 million times worldwide, and vaccination of the
Covid World Vaccination Tracker --The New York Times
https://www.nytimes.com/interactive/2021/world/covid-vaccinations-tracker.html
The graph below summarizes the total number of new coronavirus vaccinations worldwide as of April 11, 2021. The number of vaccinations per day continues to increase moderately.
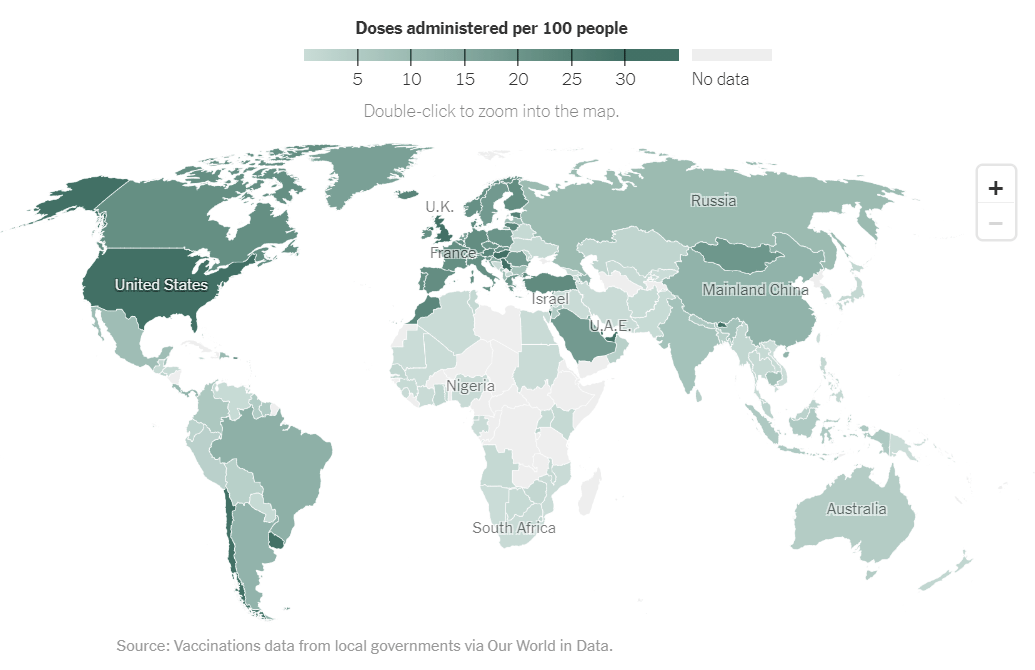
The graph below summarizes the vaccination status of each country. Countries with more vaccinations per 100 people are shown in dark green, which means that countries with lighter colors are less vaccinated. In Japan, where vaccination for the elderly has just begun, it seems that 1.3 people per 100 people are vaccinated.
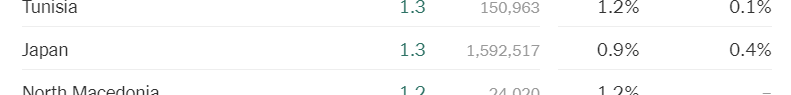
The vaccination status by country is listed below in descending order of the number of vaccinations. From the left, the numbers indicate how many vaccinations were given per 100 people, the vaccination rate per capita, and the perfect vaccination rate per capita. Because it is designed in, it shows the rate of two inoculations). Israel and Seychelles, which have the highest number of vaccinations, have more than 100 vaccinations per 100 people, and the vaccination rate is very high at over 60%.
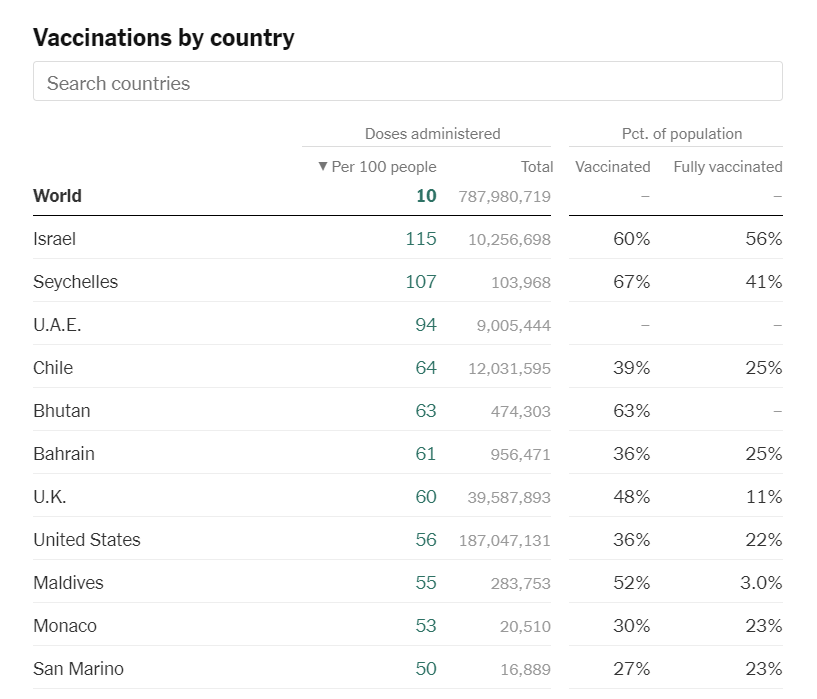
In Japan, the total number of vaccinations is 1,592,517, the number of vaccinations per 100 people is 1.3, the vaccination rate per population is 0.9%, and the percentage of complete vaccinations is even lower, 0.4%. .. Of the 151 countries for which data exist, the number of vaccinations per 100 people is Thailand, which is 103rd.
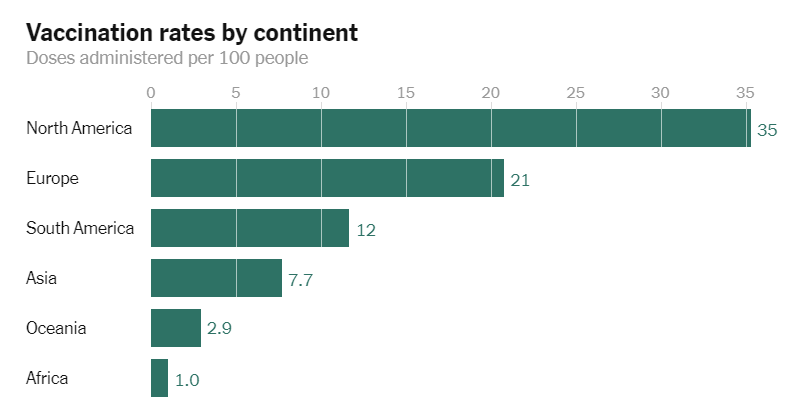
Below is a graph of the number of vaccinations per 100 people by continent. North America (35) is the most common, followed by Europe (21), South America (12), Asia (7.7), Oceania (2.9), and Africa (1.0).
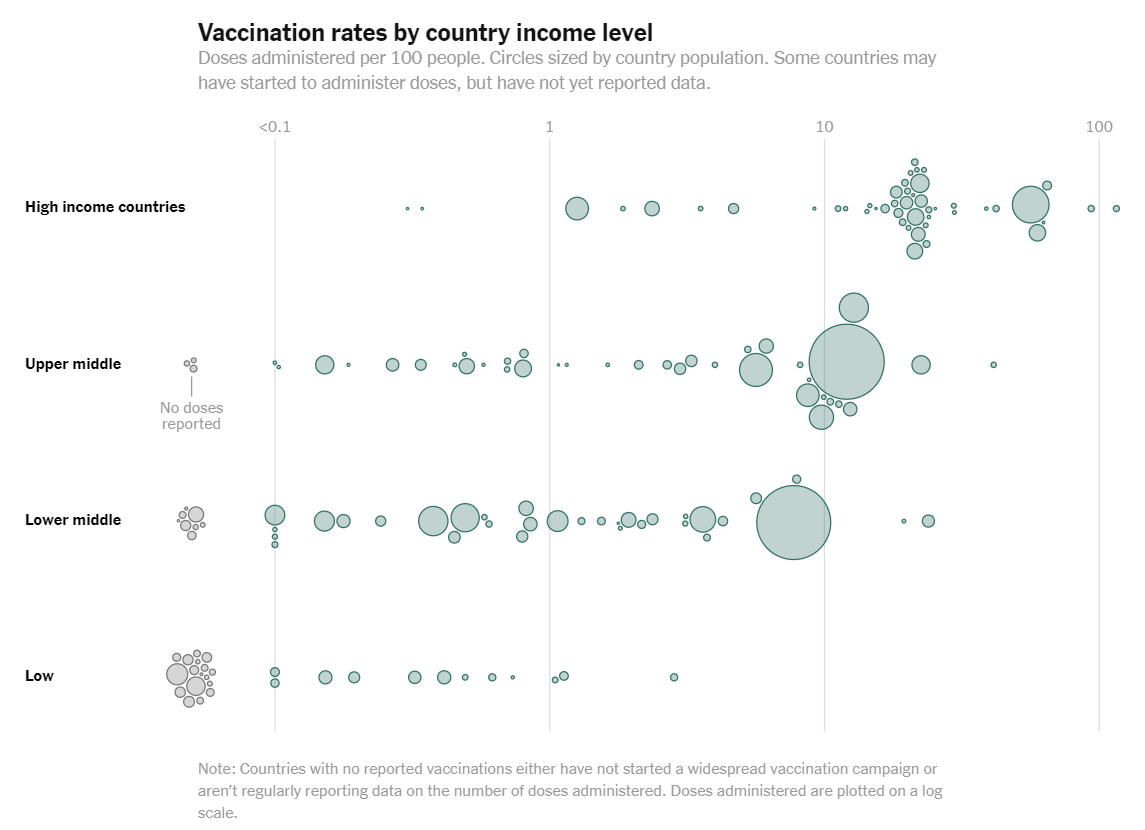
Of the new coronavirus vaccines used at the time of writing the article, 83% are used in high- and middle-income countries, and the inoculation rate in low-income countries is only 0.2%.
Below is a graph summarizing the number of vaccinations per 100 people by income level. High income countries, Upper middle, Lower middle, Low and low income countries show that vaccination rates are clearly higher in low-income countries. You can see that there are few or the vaccination itself has not been done.
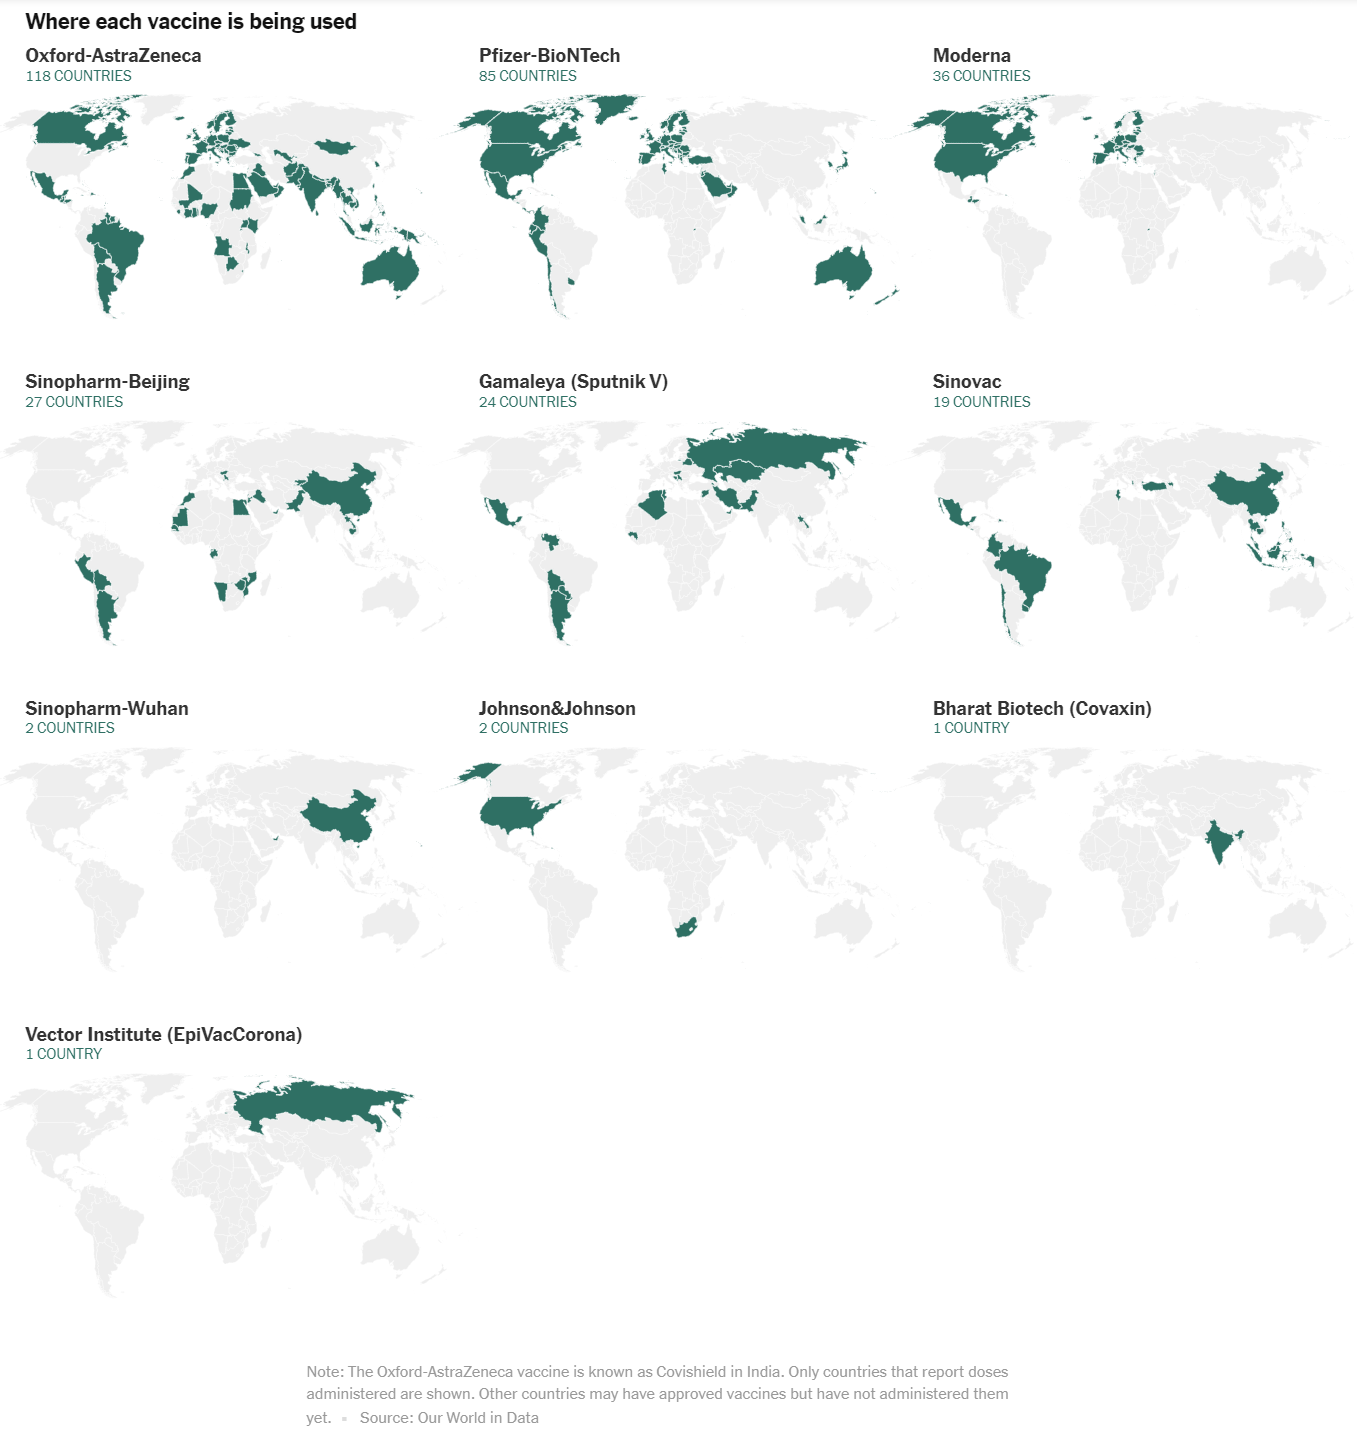
There are various types of new coronavirus vaccines, but the map below summarizes which countries each vaccine is used in. The most used are those developed by Oxford University and AstraZeneca, a major pharmaceutical company.
The data on the 'Covid World Vaccination Tracker' is sourced from information collected from governments in the Our World in Data project at Oxford University.
Related Posts:


in Note, Posted by logu_ii