New coronavirus vaccination rate graphs from around the world, where is Japan?

A graph showing the inoculation rate of the new coronavirus vaccine in countries around the world since December 2020
Share of people who received at least one dose of COVID-19 vaccine
https://ourworldindata.org/grapher/share-people-vaccinated-covid
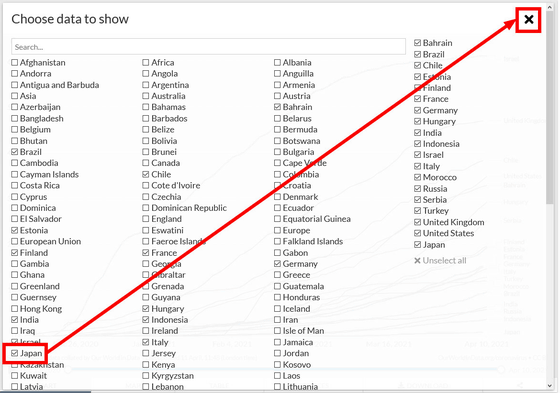
Since Japan is not included in the graph in the initial state, click 'Add country' in the upper left of the graph.

Check 'Japan' and click 'x' in the upper right. This will add Japan to the graph.

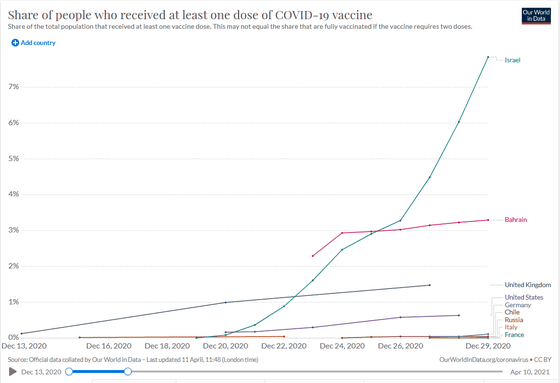
Data will start on Sunday, December 13, 2020, from the start of vaccination in the United Kingdom. Israel will overtake the slowly rising UK inoculation rate at once. In addition, Bahrain, where inoculation data will appear from December 23, has surpassed the United Kingdom from the beginning. The original data used in the graph is 'the percentage of people who have been vaccinated at least once'.

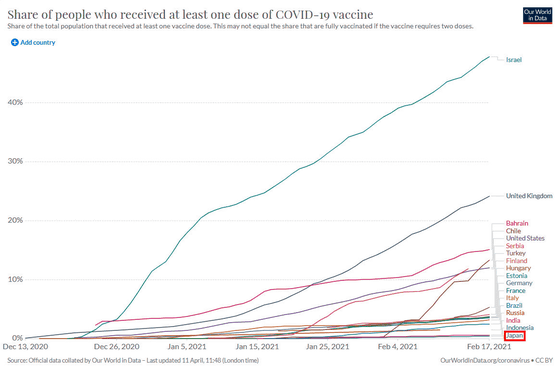
Japanese data will appear in February 2021.

The growth of inoculation rates is very slow, and the gap with the leading Indonesia is widening rather than closing.

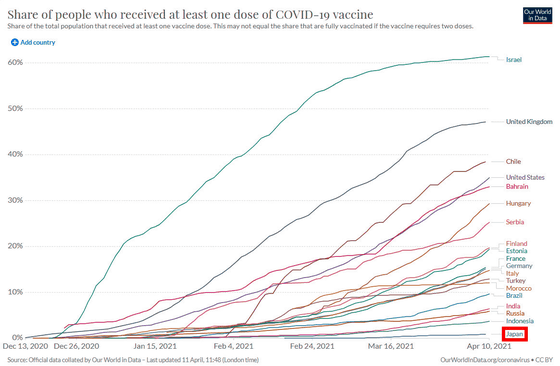
As of April 9, the inoculation rates in major countries are like this. Israel is 61.3%, the United Kingdom is 47.1%, the United States is 34.2%, France is 15.5%, Germany is 15.1%, Italy is 14.4%, Brazil is 9.4%, Russia is 5.7%, and Japan is 0.9%.

Related Posts:
in Note, Posted by logc_nt


