"My Mind Map" to create a browser-based mind map for free
You can "visualize" the inside of your own babyMind MapIt is a useful tool that helps organize your mind and sometimes leads to problems solving and ideas of new ideas. "My Mind Map"It is possible to create such a mind map on a browser basis.
My Mind Map :: My Mind
http://my-mind.github.io/
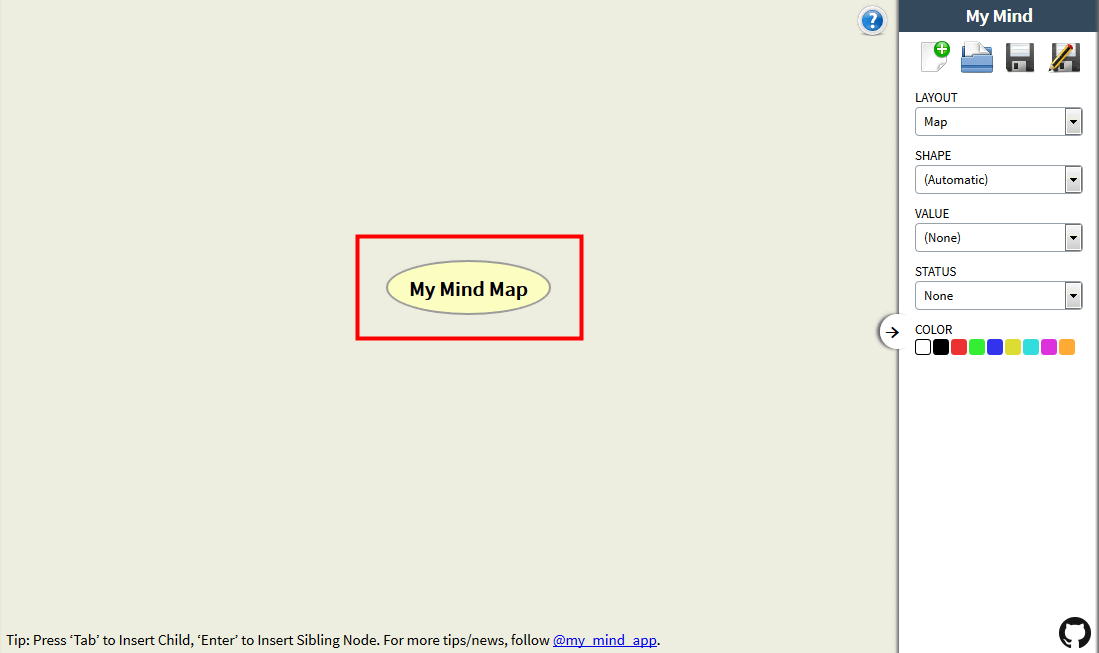
Even when using My Mind Map, you do not need to install software or account settings at all. Opening the above URL opens a screen for creating a new map. By double clicking on "My Mind Map" you can change the title of the map.
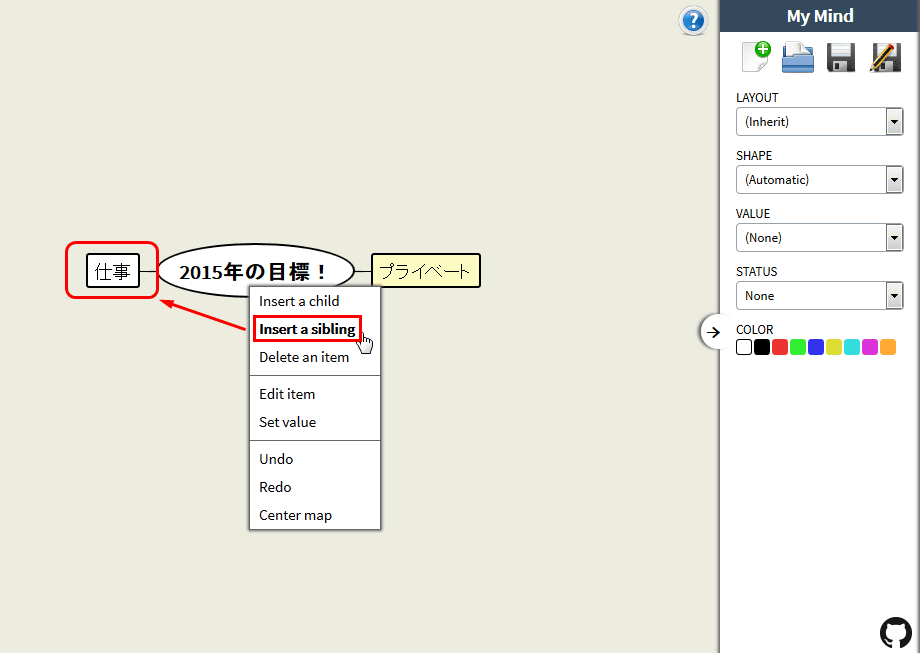
Right click on the item, the map edit menu will be displayed.
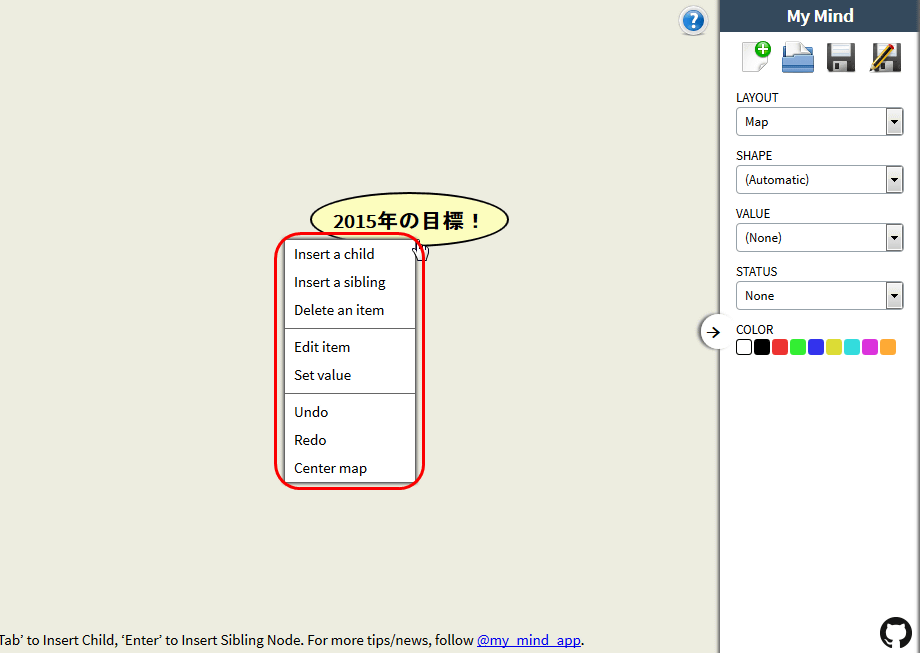
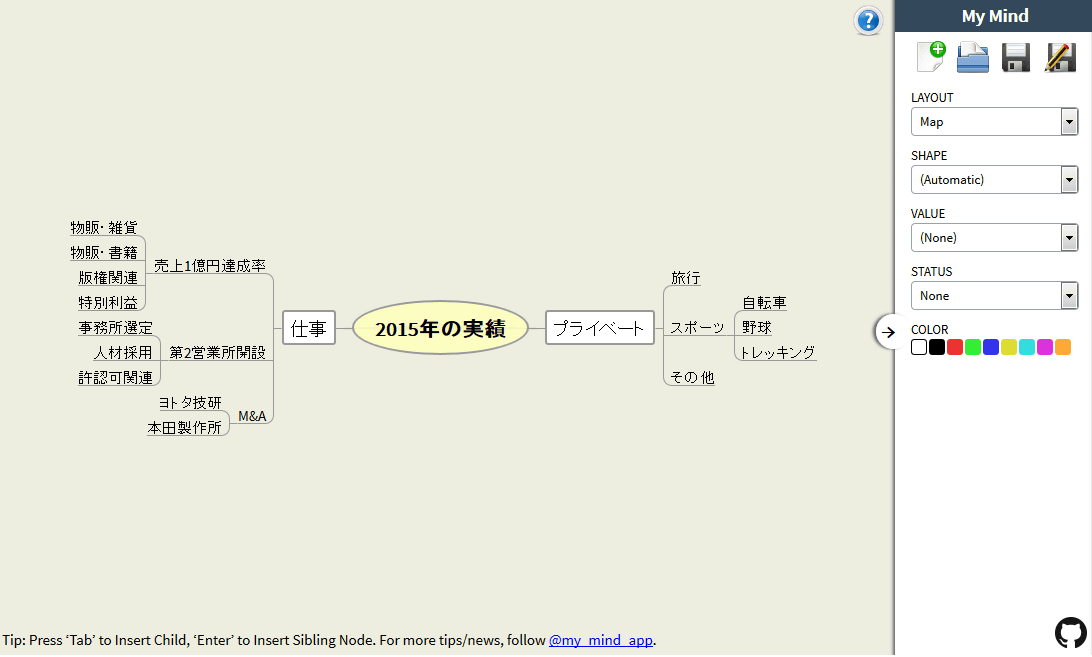
"Insert a child" creates a child element that branches off the item. First, create a child element under the parent element "Goal of 2015!" And set the element name "private".
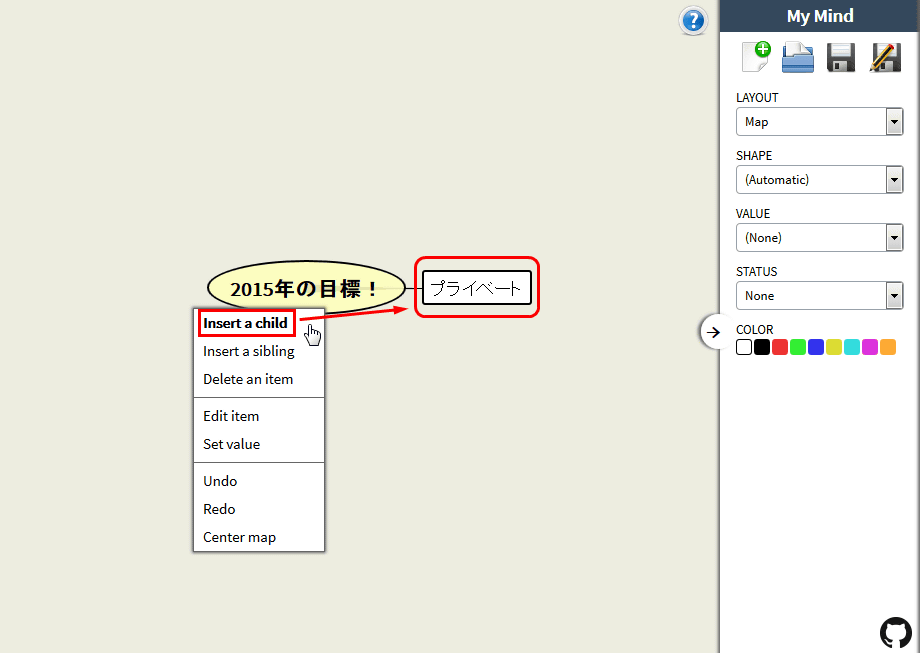
Next, let's create an element called "work" in the same hierarchy as "Private". Right click on "Private", click "Insert a sibling" from the menu, create a new element just below the parent element, set "work" and element name.
Under "Private", create subdivided items. Also used here is "right click" → "Insert a child", create items such as "travel" "sports". The display style of the element is set automatically according to the hierarchy.
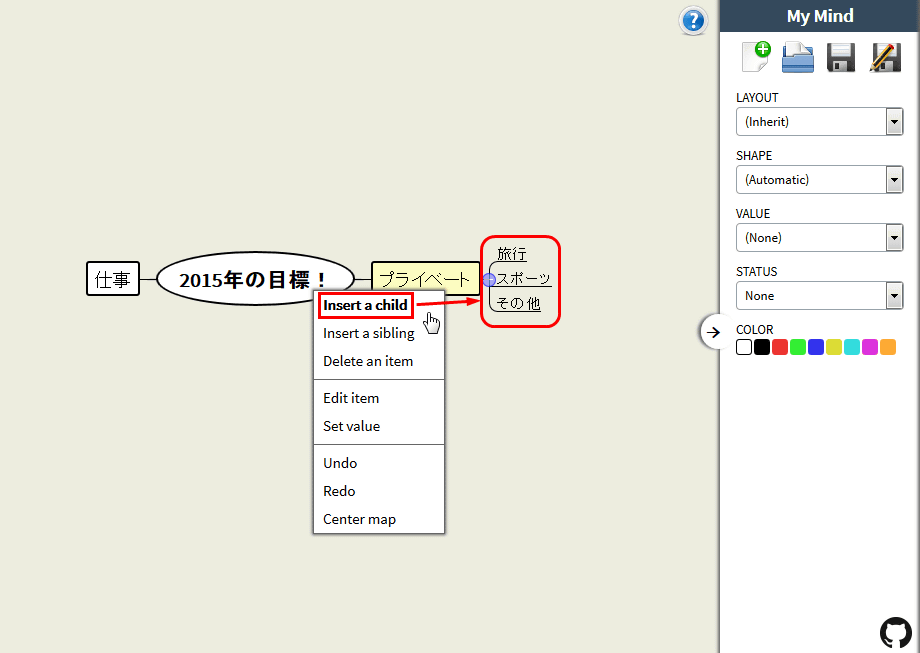
In addition, under "Sports" we created "childbikes" "baseball" "trekking" as child elements. When the element exceeds 3 levels, the display style automatically set is fixed.

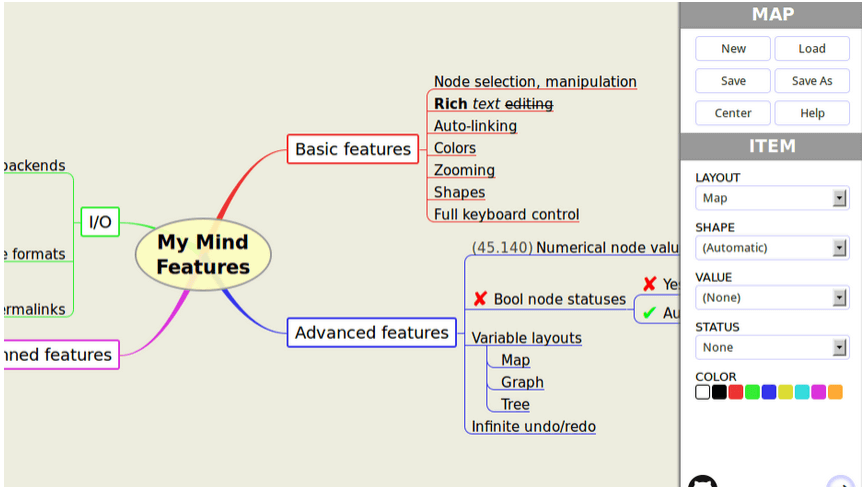
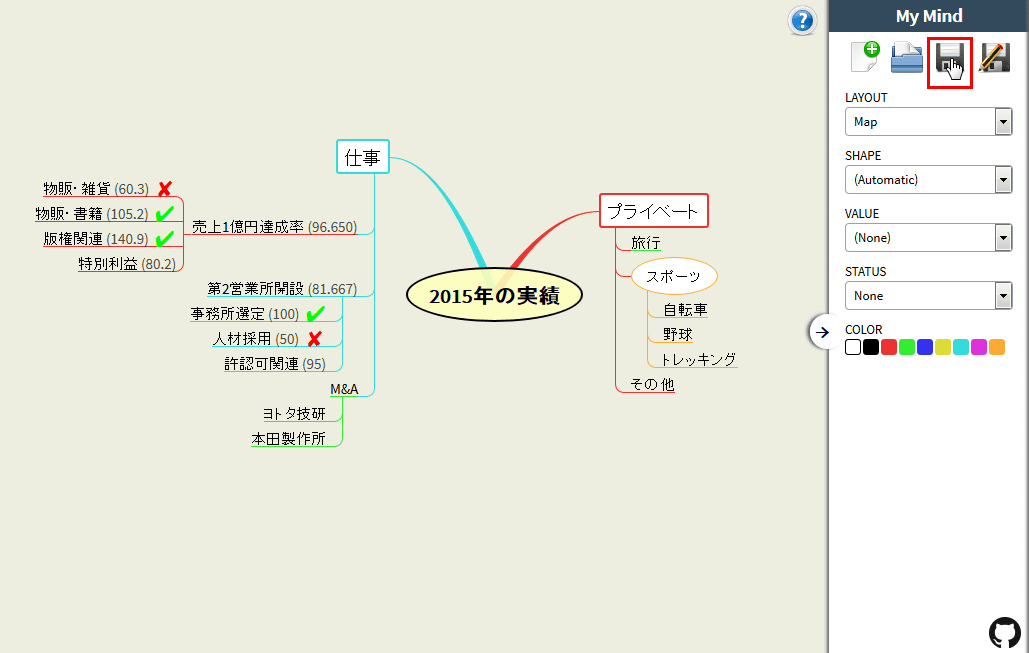
The style of the line connecting the elements can be changed from the menu on the right side of the screen. By clicking "LAYOUT" on the screen right side and selecting "Tree-Right" or "Tree-Left", it was changed to a tree-like design which is often seen in the mind map.

It is also possible to change the shape of the element. You can choose from three types of designs from "SHAPE" on the screen right menu to "Box" "Ellipse" "Underline".

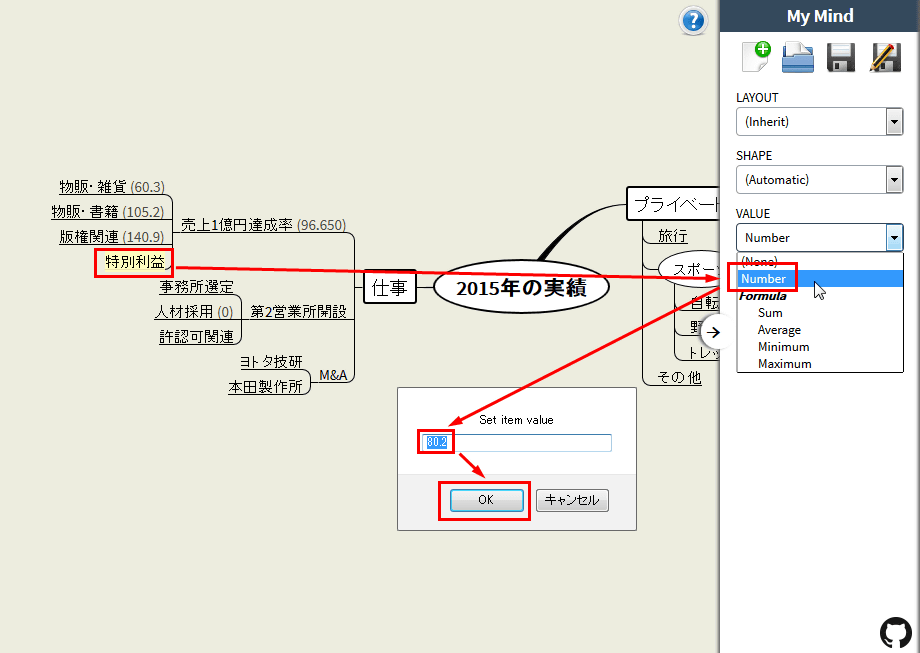
In addition, it is possible to set mathematical expressions for each element and to display the result of automatic calculation based on the value of the child element. Set "Sum (total)" "Average (average)" "Minimum (minimum value)" "Maximum (maximum value)" from "VALUE" on the screen right menu.

Then, click "VALUE" → "Number" (numerical value) as a child element, enter a numerical value on the screen to be displayed and click "OK" ...
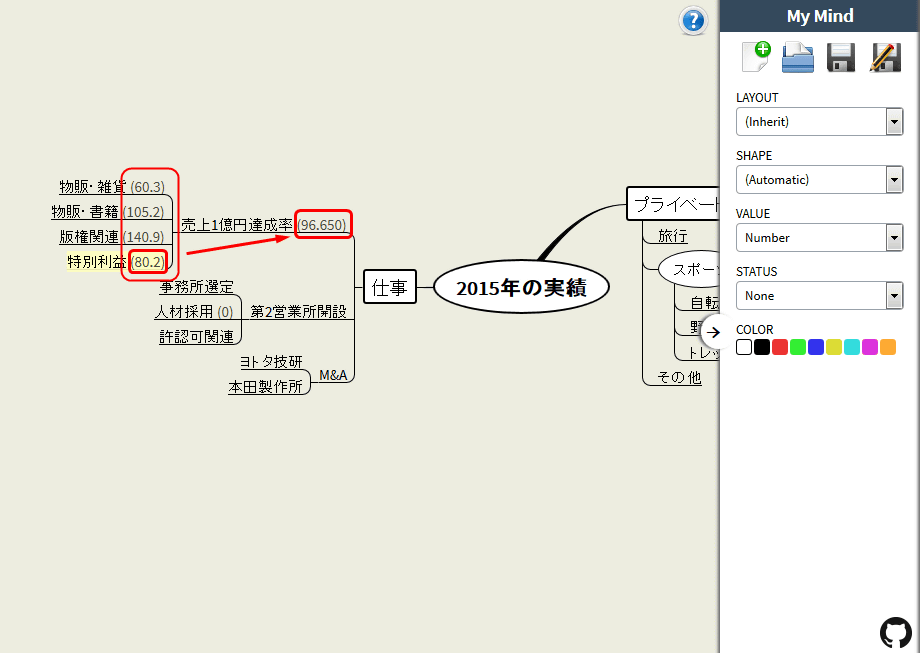
The average of the numerical values of the child elements was displayed on the element for which "Average" was set. This is a useful function when viewing the progress rate of each project.
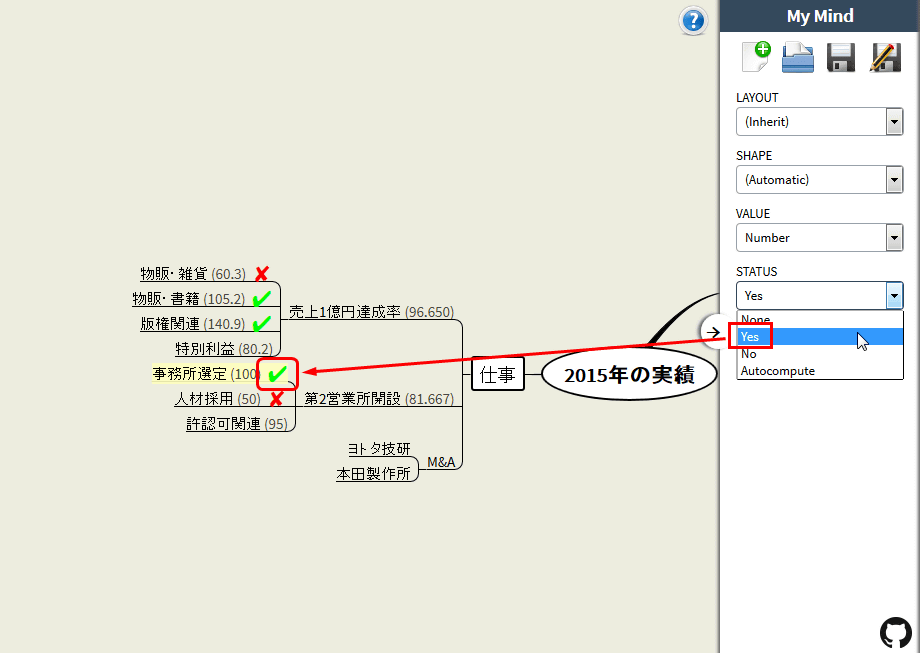
It is also possible to mark each element. When selecting "Yes", "No", "Autocompute" from "STATUS" and setting it, "✓" or "×" mark was displayed to the right of each item.
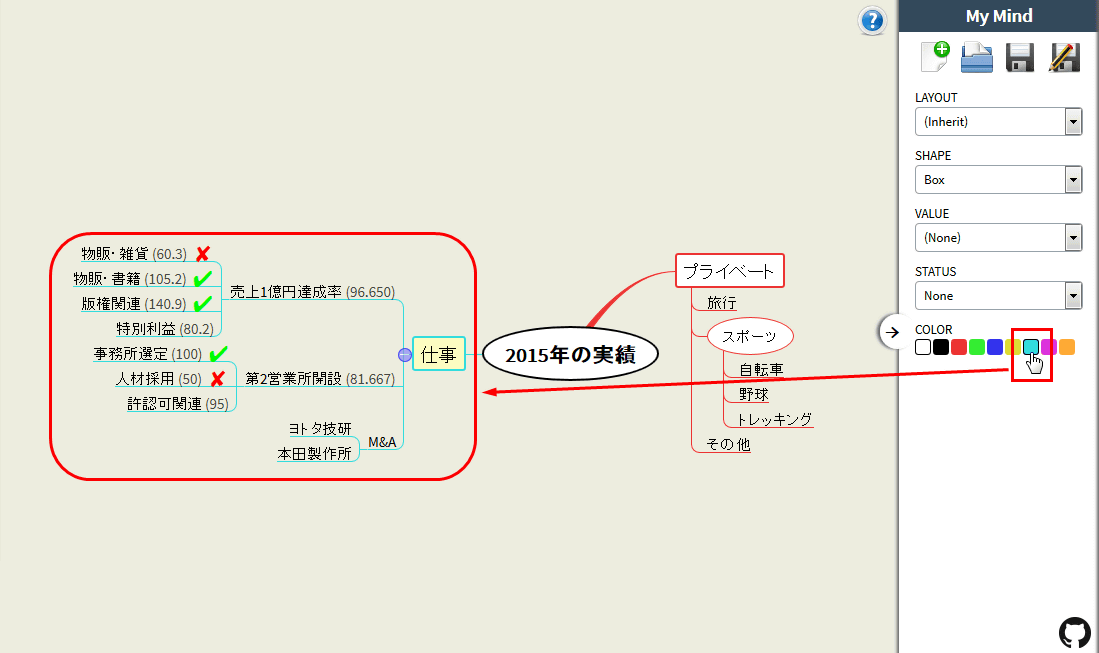
When "COLOR" is set as an element, the hierarchy below the selected element is color-coded into the same color, so it is easy to grasp the branching structure.
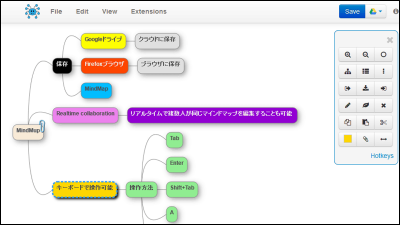
The mind map created in this way can be saved by clicking the icon in the upper right of the screen.
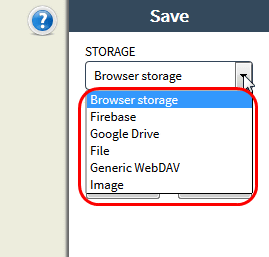
Data can be saved in a local folder where browser data is savedFirebase, Google Drive, etc. It was also possible to export to other various file formats and save it as an image.
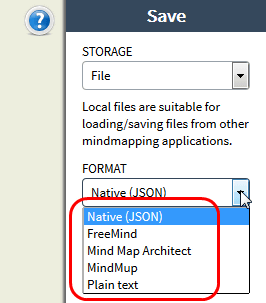
The format of the text file isJSON dataAnd free software for mind map "FreeMindYou can choose the format of ". It is also possible to export to plain text.
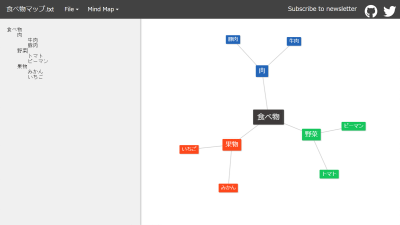
The contents of the saved plain text looks like this. The structure of the mind map is described by line feed and tab insertion, but the contents set for each item do not appear.
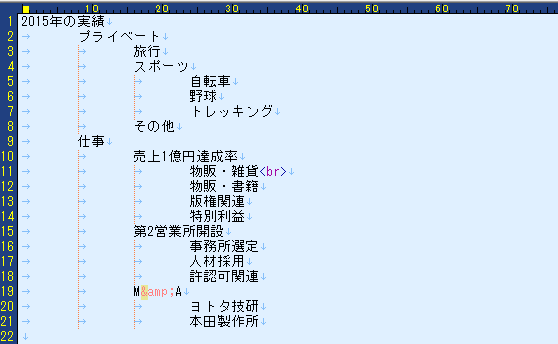
When loading the saved plain text into My Mind Map and displaying the mind map, all contents of colors and formulas set for each element were cut in this way. It seems that it is necessary to save important data in FreeMind format etc.
My Mind MapGitHubHowever, the source code has been released so that you can freely fork and update it.
My-mind / README.md at master · ondras / my-mind · GitHub
https://github.com/ondras/my-mind/blob/master/README.md

Related Posts:

in Web Service, Review, Posted by darkhorse_log