Google official Chrome extension "Page Analytics (by Google)" that immediately shows analysis results of your page with Google Analytics
Google AnalyticsGoogle Chrome extension that will automatically display the number of page views, unique preview number, average stay time on the page, bounce rate, exit rate etc. in the most recent month only by opening a web page Function is "Page Analytics (by Google)"is. It did not bother to use Google Analytics just by pressing a single button, so it seemed very useful, so I actually tried using it.
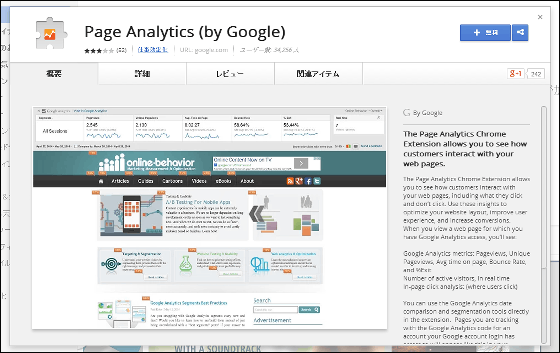
Chrome Web Store - Page Analytics (by Google)
https://chrome.google.com/webstore/detail/page-analytics-by-google/fnbdnhhicmebfgdgglcdacdapkcihcoh
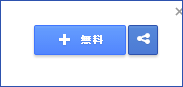
First click on the "free" button on the web page.
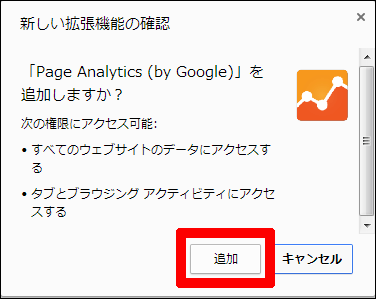
Would you like to add "Page Analytics (by Google)"? Click "Add" as you are asked.
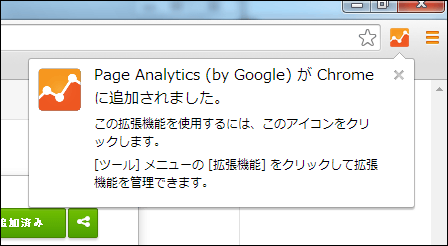
When the screen "Page Analytics (by Google) added to Chrome" comes up, installation of the extension is completed. An orange icon will appear next to the address bar.
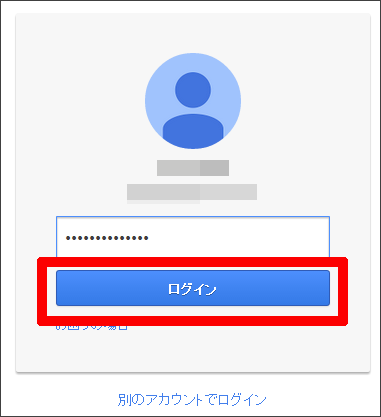
Before using the extension function, first log in to the account corresponding to Page Analytics. This time I tried logging in to the account which analyzes the page of GIGAZINE.
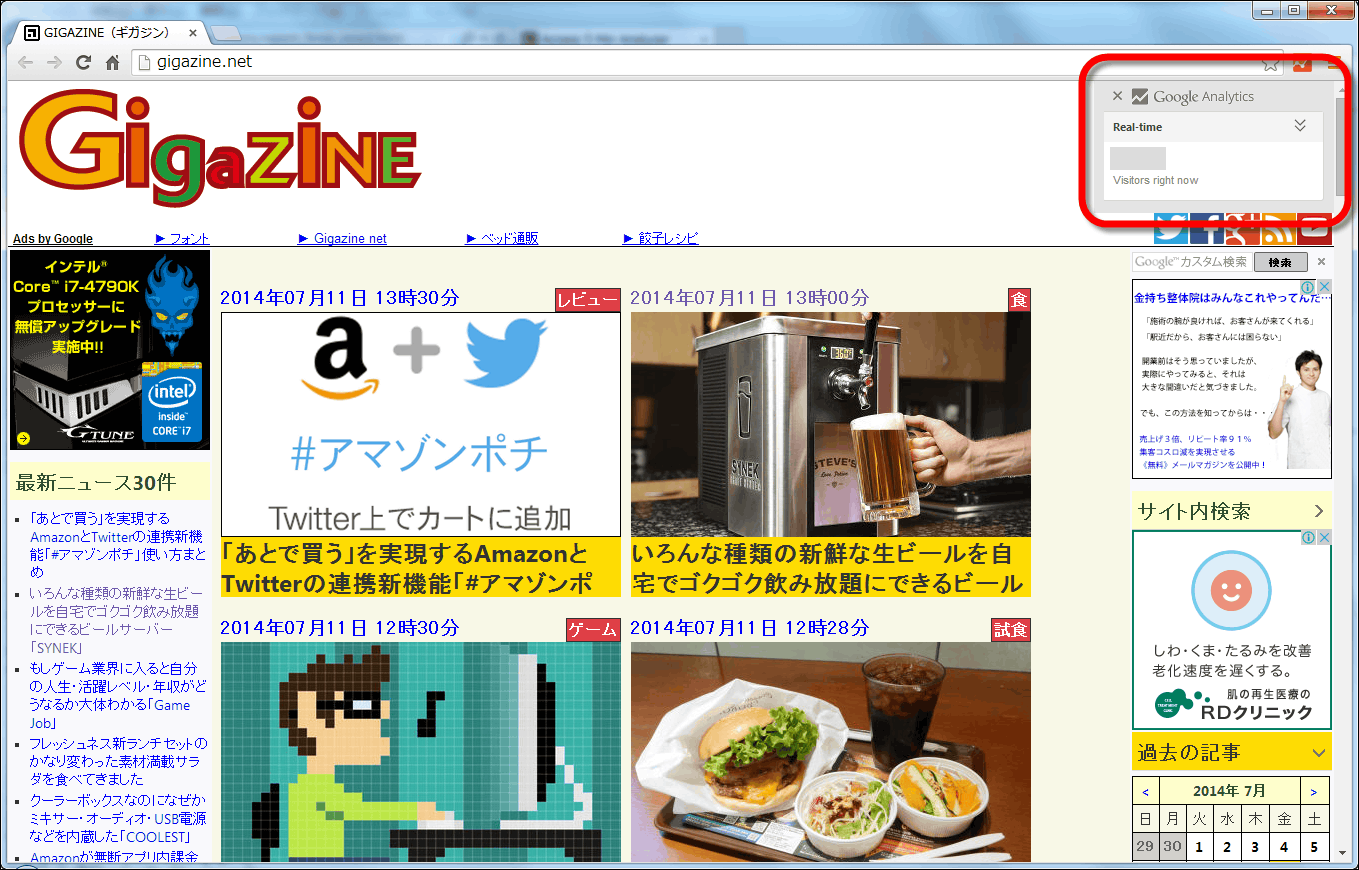
After logging in, I tried opening the top page of GIGAZINE, but at this point it is the same screen display as usual. The extension icon is displayed next to the address bar.
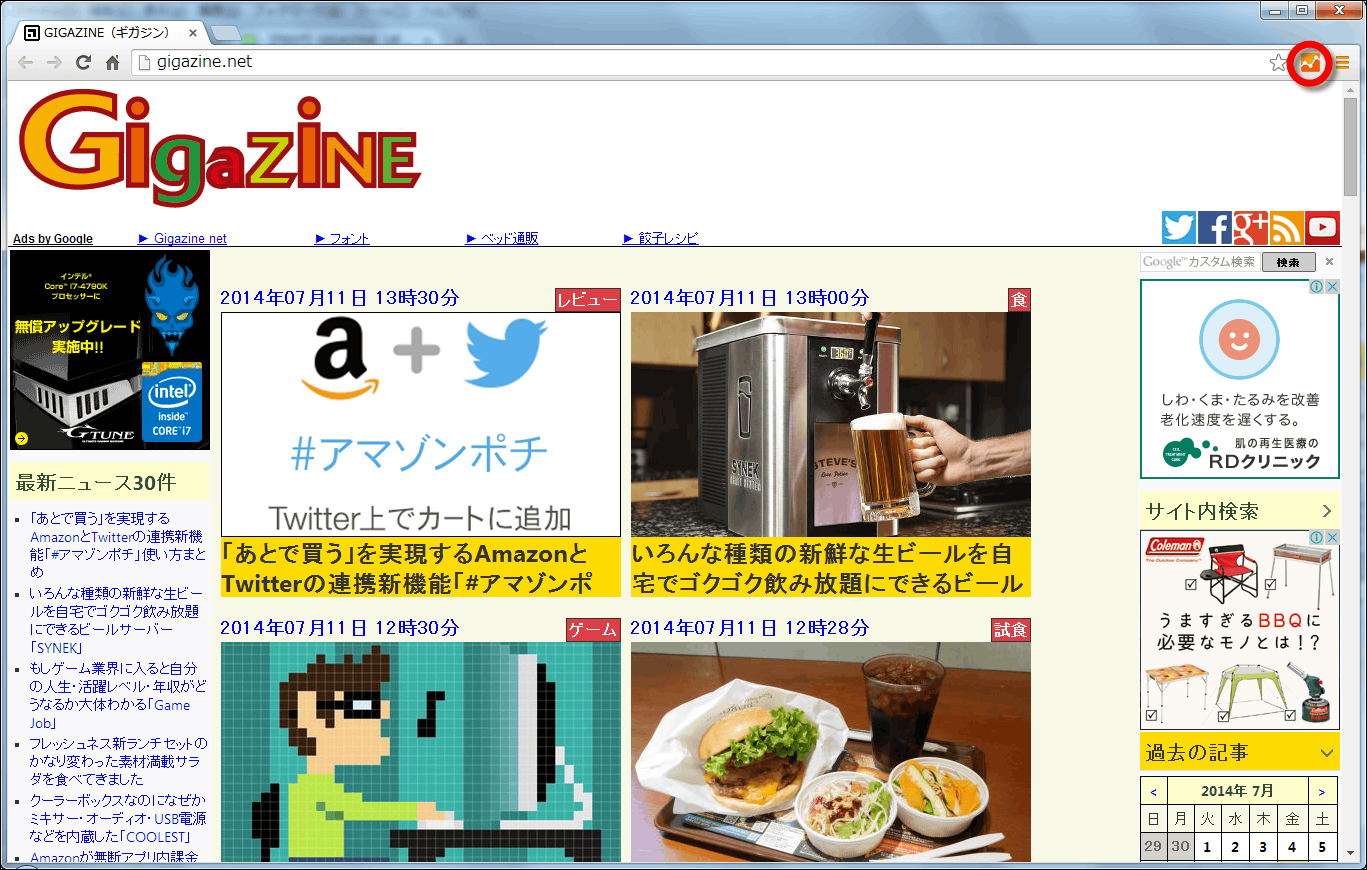
Click on the icon ......

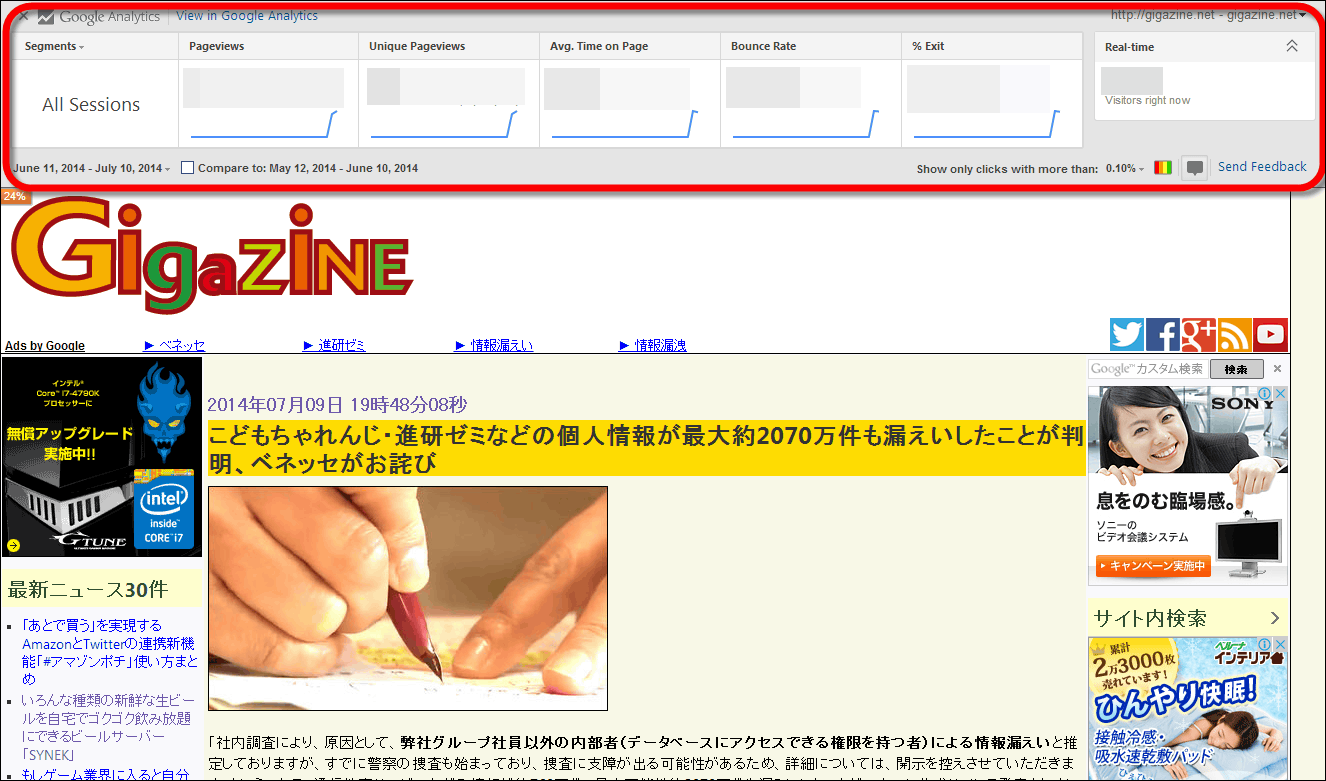
A panel appears at the top of the screen.
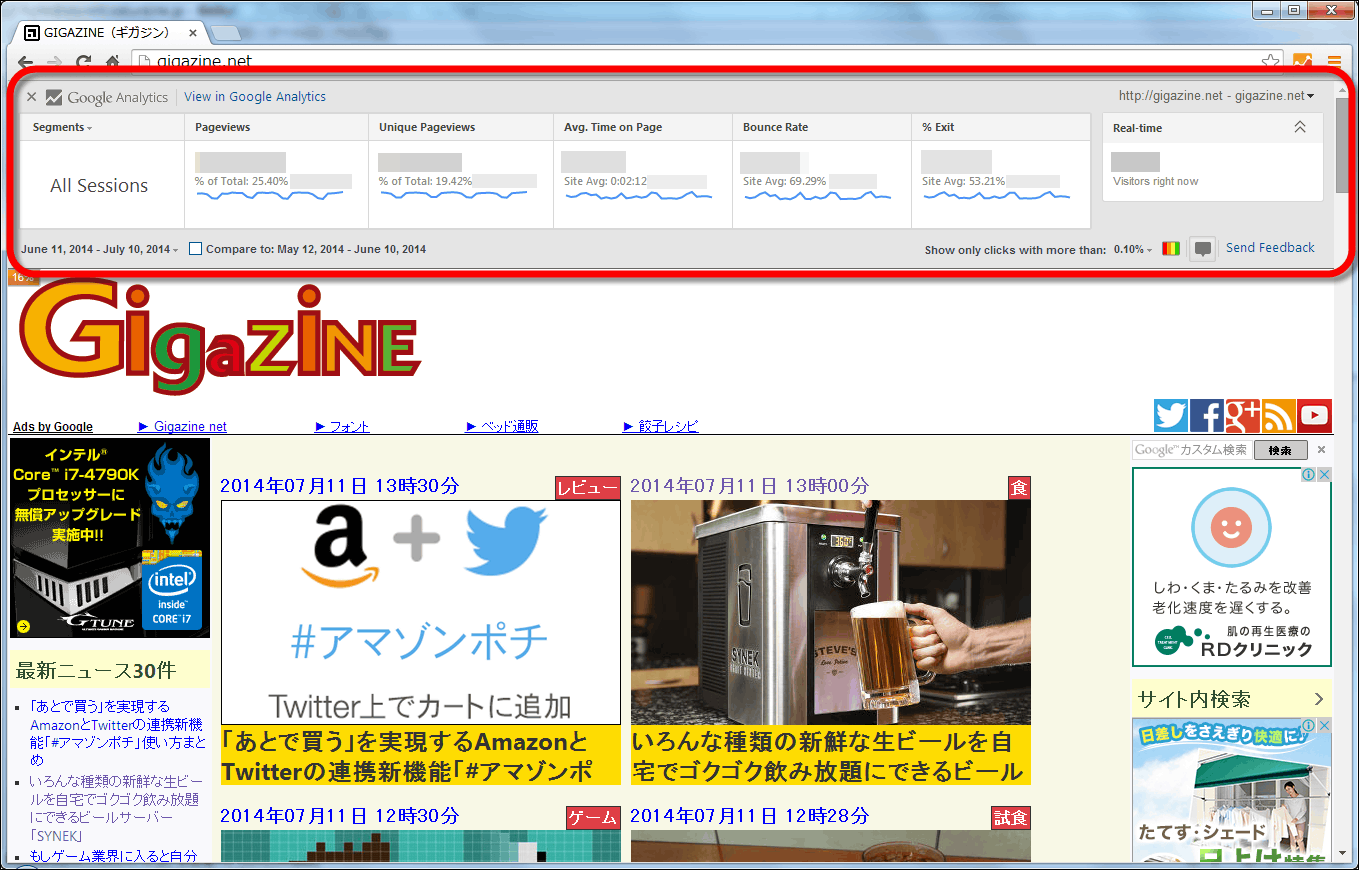
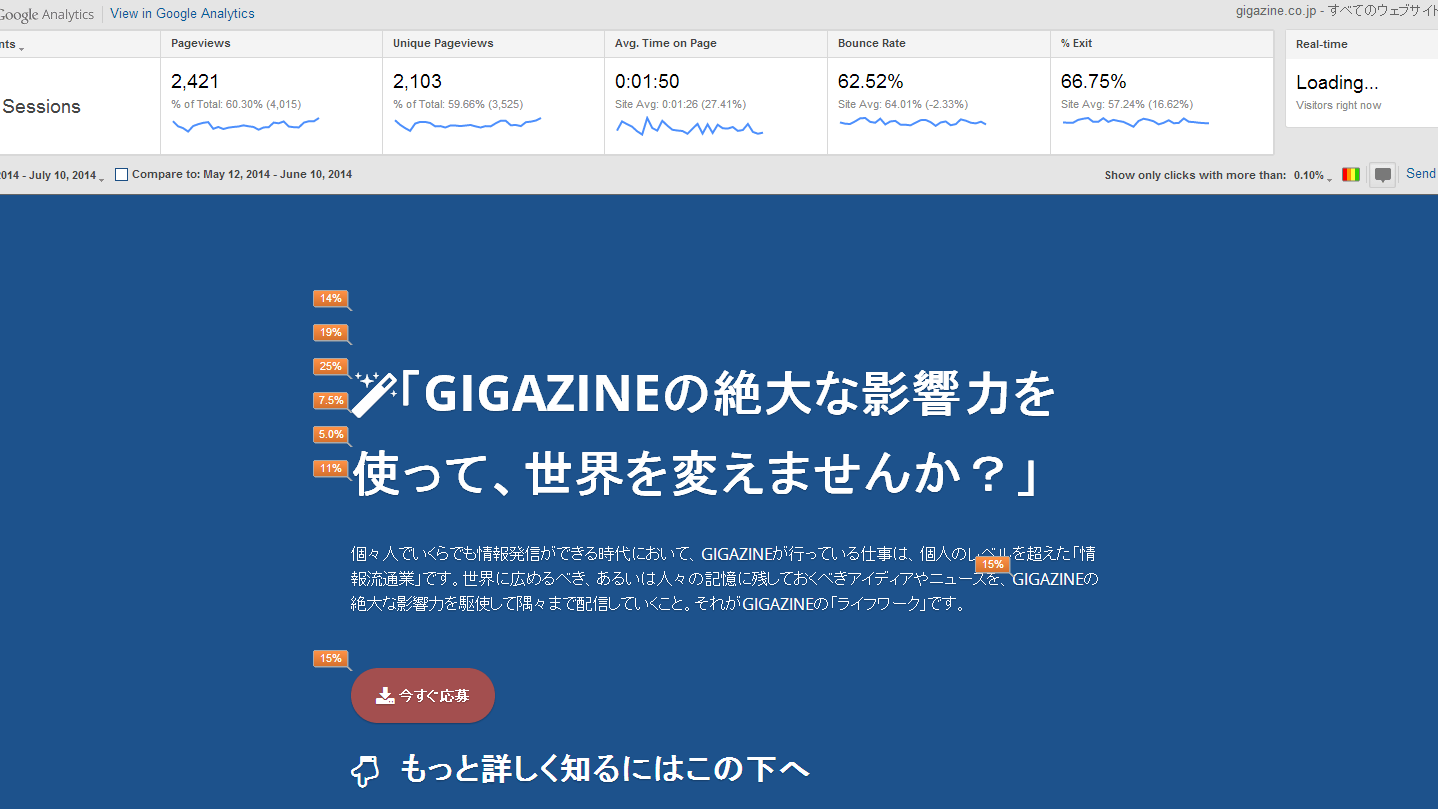
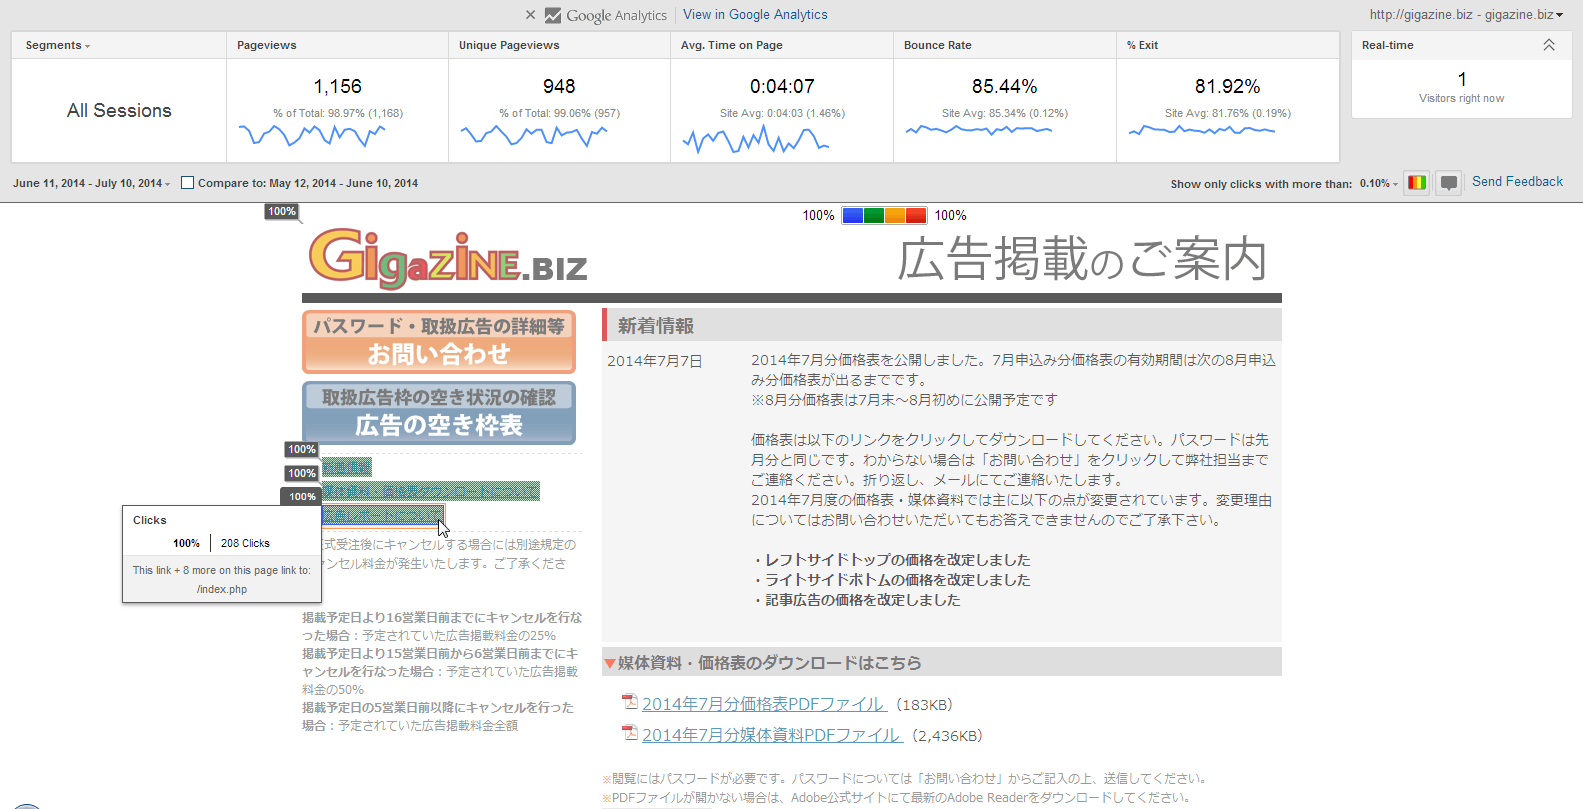
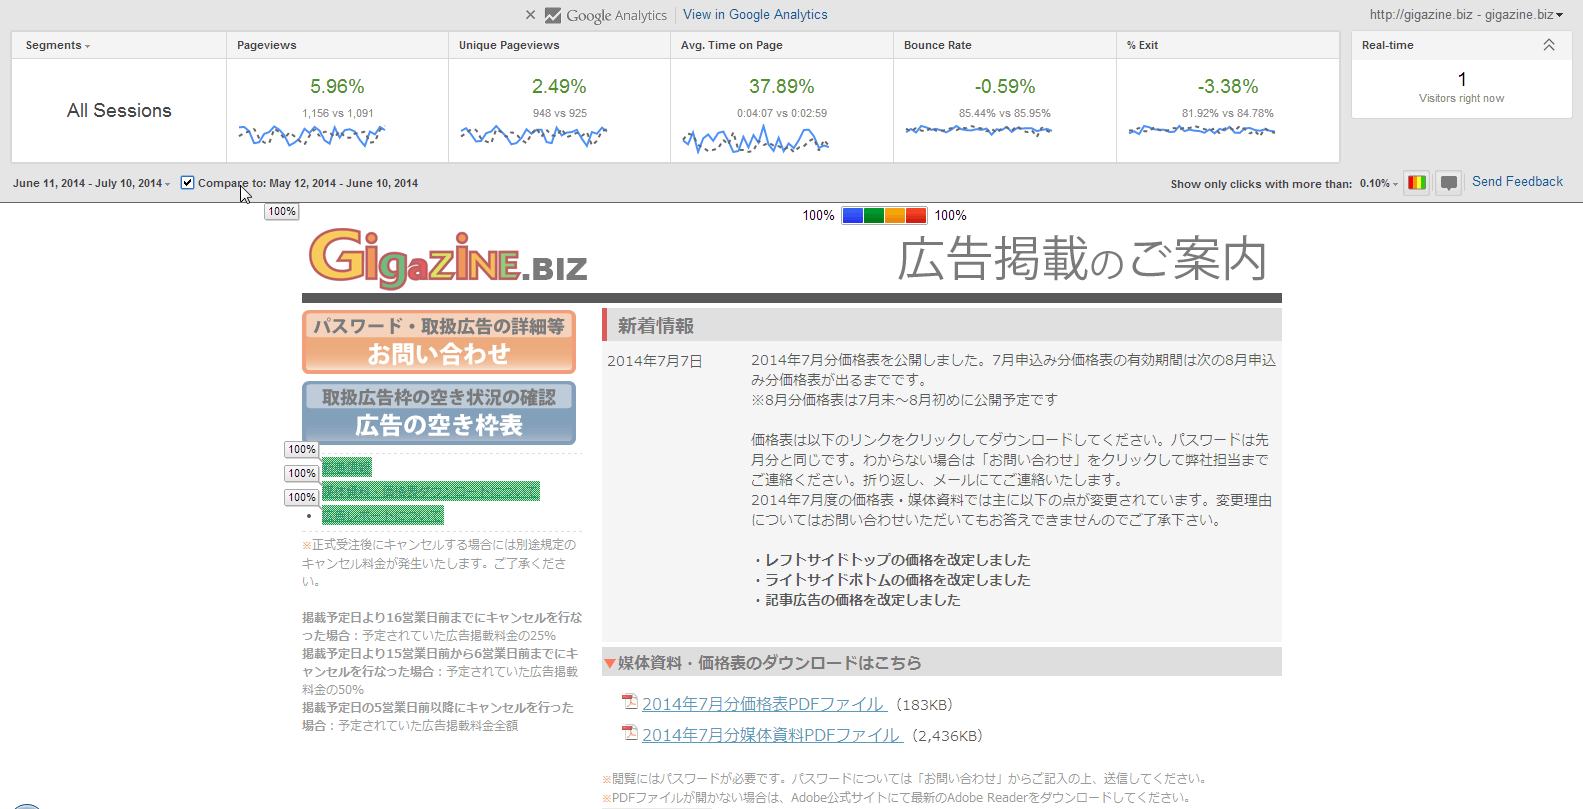
Advertisement placementThe page about this is like this. From the left, the panel has the number of page views, the number of unique previews, the average staying time on that page, the bounce rate, the withdrawal rate, and the number of real time visitors, and what percentage of the total occupies the panel , Is also indicated as. In the default case, the numerical value is the analysis of the most recent one month access.
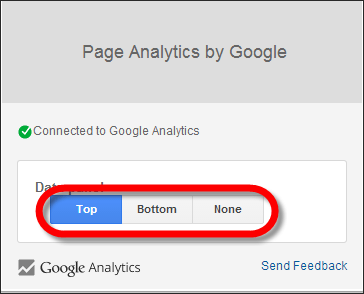
Panels can be displayed at the top and bottom of the screen.
When you click on each news in the page ... ...

This time the panel was automatically displayed without pressing the icon. Once you have enabled the extension function, access analysis will be automatically displayed simply by opening the page without pressing the icon each time.
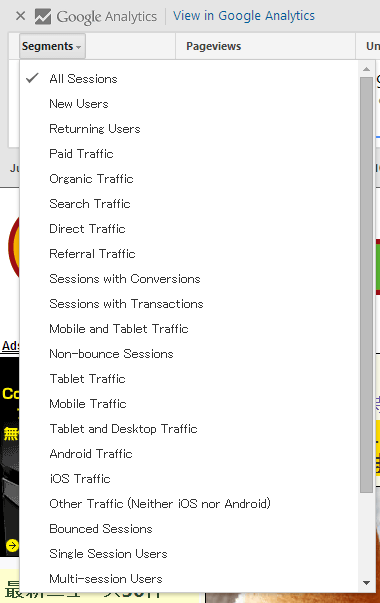
It is also possible to change the segment, such as tablet · mobile · Android user · iOS user traffic.
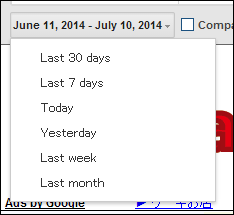
In addition, the period can be specified from the last 30 days · Last 7 days · Today · Yesterday · Last week · Last month.
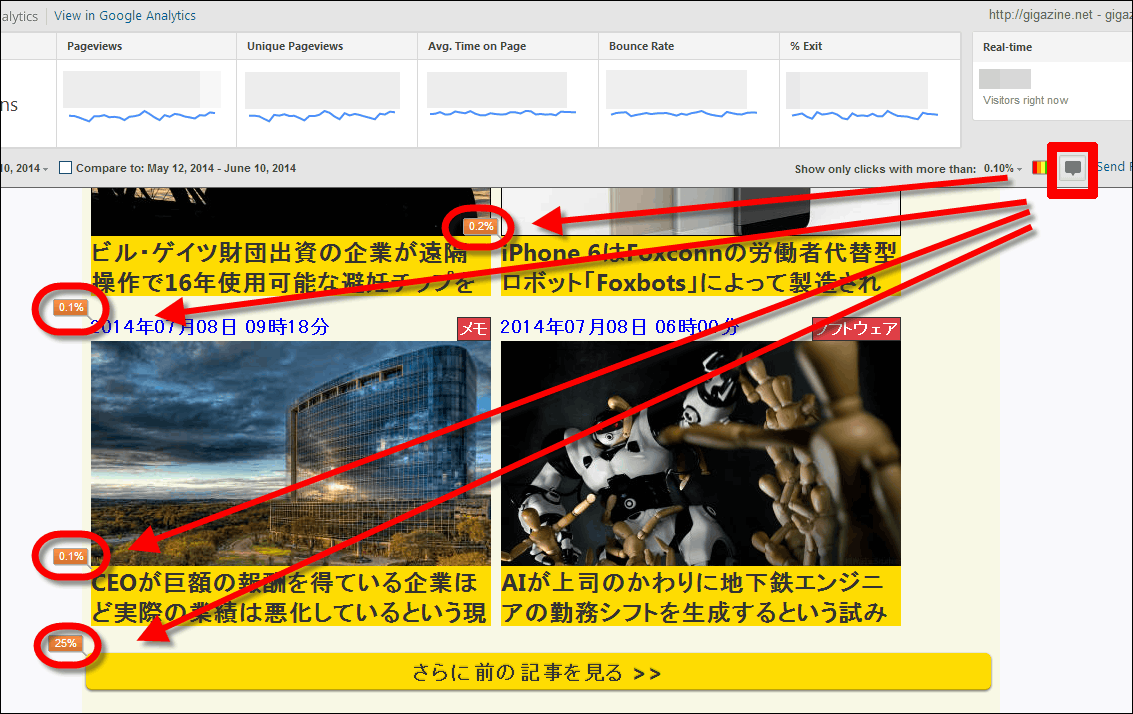
Click on the colorful mark at the bottom of the panel.
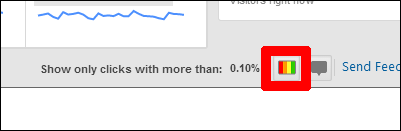
This is a button to make link at a glance with click rate higher than 0.1% at a glance. It is 0.1% blue, followed by green and yellow, and red is 25%.
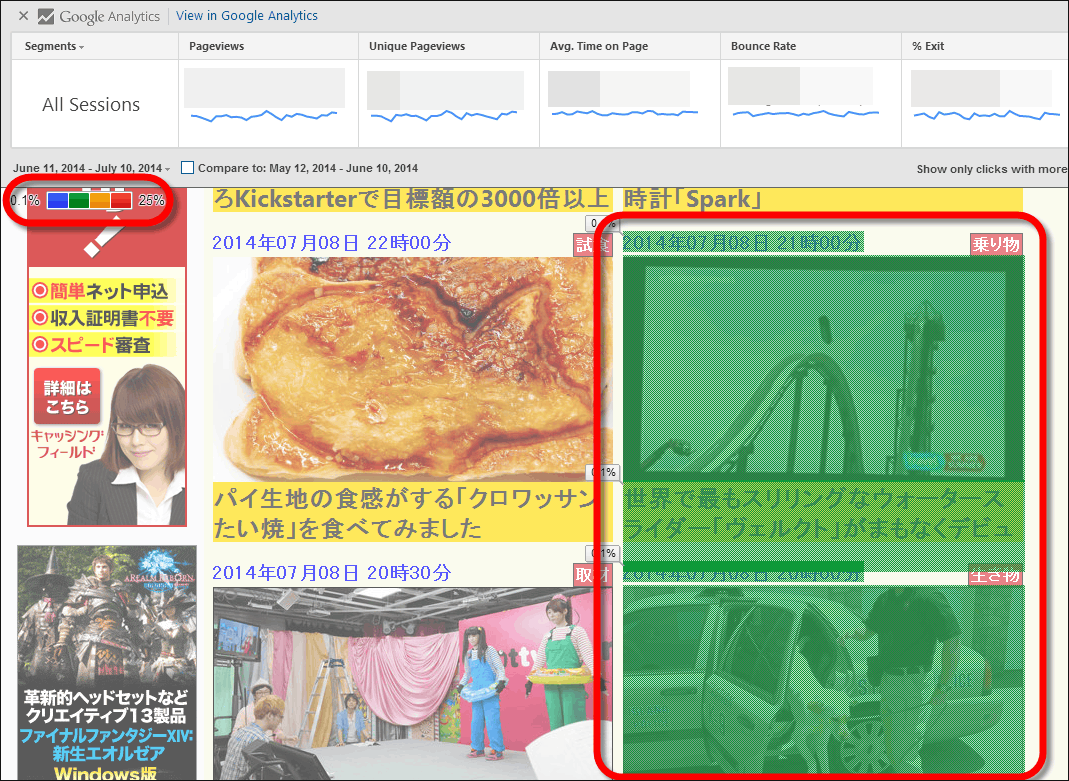
It is obvious what the heck is popular article.
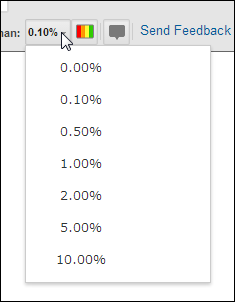
The click rate specified can be changed from 0.00% to 10.00%.
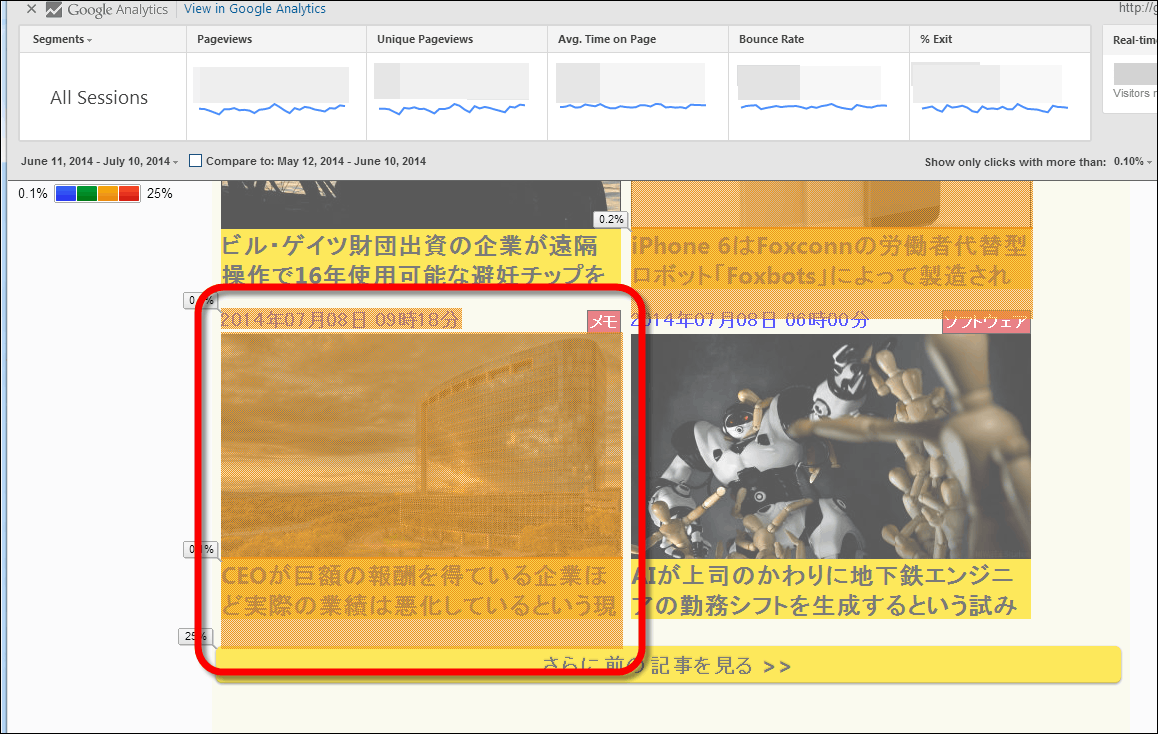
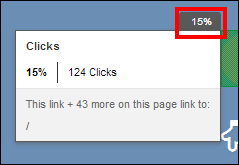
By clicking the balloon button, you can display the click rate in the corner of each link.
When you hover the cursor over the click rate, details are displayed.
It is also possible to compare the most recent month's access with the previous month's access.
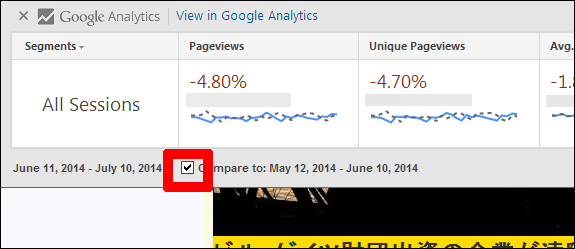
In the case of the page about advertisement placement, the page view increased by 5.96% from June 11 to July 10 compared to May 12 to June 1014, and the average stay time also increased by 37.89% It was.
Click on the arrow at the top right of the panel ......
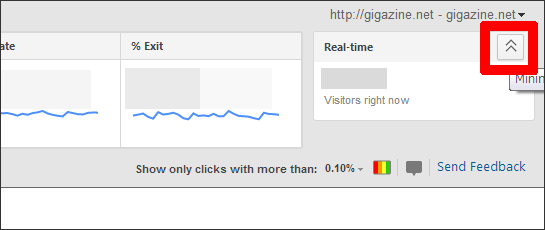
Since it is possible to store it compactly, the content was not disturbed on the page which does not need to look at the analysis.
Related Posts: