I tried using the new Personal Heat Map of the new Thermodo application
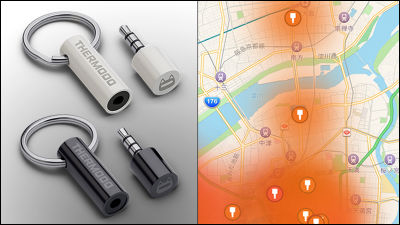
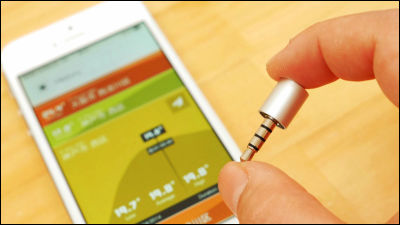
Equipment that will be able to measure ambient temperature simply by connecting to the earphone terminal of a smartphone or tablet is called "Thermodo"is. Thermodo has dedicated iOS and Android apps, and in April 2014 version upgrade to iOS version appA history function capable of accumulating records was addedAlthough it is only in the version up after just one month, the history function is expanded and the past history is displayed on the map to graphically display the temperature of each areaPersonal heat mapSince it was that the function of "added, it decided to try it immediately.
Introducing Heat Map for Thermodo!
http://us1.campaign-archive1.com/?u=cda2e817f8ee3e73c9bd5b988&id=a90f490d3f
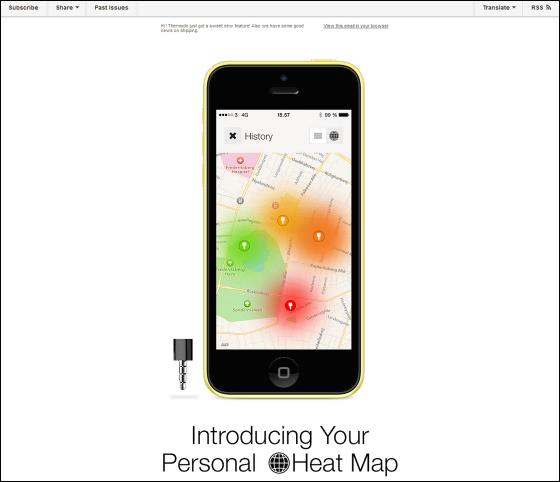
The screen you actually tried to display the personal heat map looks something like this. The point where the temperature was measured is indicated by a round icon, and the red color indicates that the temperature was high. Numbers are displayed in the icon because the data acquired in the vicinity is displayed together.
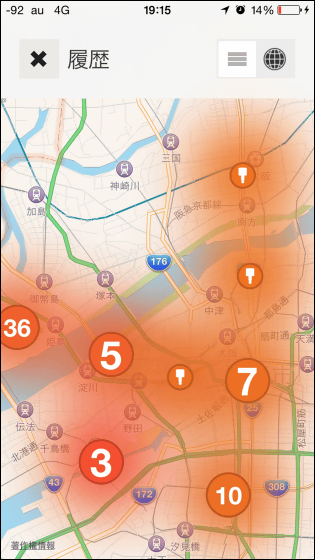
This heat map was created from the data taken by himself with the iPhone as one hand, but speaking about what I went for, the temperature was regularly measured while traveling through the city with the Thermodo attached to the iPhone Only. That alone makes it possible to create your own personal heat map.
In order to collect data, firstApp StoreInstall and launch the application from. Thermodo body is official shopBlack / white model is $ 29.99 (about 3000 yen), aluminum silver premium version is $ 44.99 (about 4,600 yen)Can be purchased with. Furthermore, at the time of article creation, when you buy two Thermodo, the campaign which carries out free shipping worldwide is carried out.
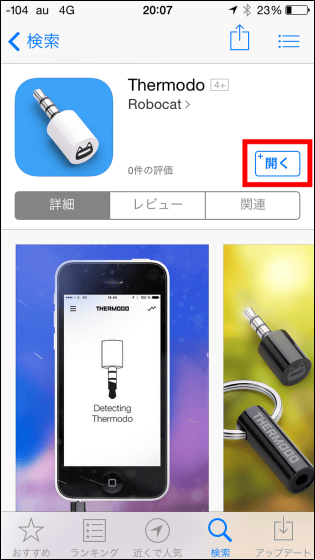
Thermodo is a device that makes it possible to measure temperature using the microphone input of iPhone / iPad. Also, since position information is required for creating a personal heat map, it is necessary to allow "access to microphone" and "current position information".
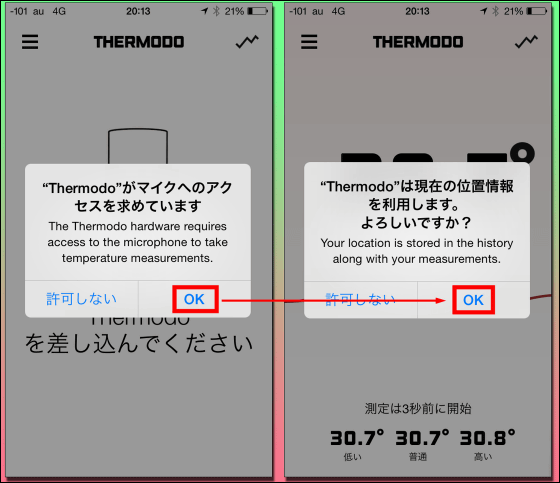
Thermodo started measuring immediately, and in a few seconds the current temperature was displayed. To see the measurement history and heat map, tap the icon on the top right of the home screen.

The measurement history up to the present was displayed. A sliding type changeover button is displayed at the upper right of the screen, and you can switch between the history list display and the heat map.

Move the toggle button to the right to switch to the Personal Heat Map screen. A map of all over Japan is displayed, and an icon is displayed at a certain point of measurement data.

This icon, of course, indicates the position and temperature of the data measured by you. It is also possible to change the scale freely by pinching in / out the map.

I found out the measurement method, I immediately decided to go out into the city and measure the temperature here and there. The temperature of Shin Osaka station front Rotary is 25.9 degrees.

From south of Shin - Osaka station,Osaka city central public hallThe temperature measured before (the former name: Nakanoshima public hall) was 25.4 degrees.

Go further south. All the traffic lights go blueMidosujiNear the southern end of the city, the temperature around Namba was 25.5 degrees. Although it is measured in the car, the air conditioner is turned off, the window is fully opened, and it is measured in the same environment as outside air.

And at the end is "Crab street musicMeasured in front of the huge crab statue. It was 25.4 degrees.

Heat map containing such a state is kore. Although almost the same color is displayed at all points, the dark points of some orange color indicate that the temperature is somewhat higher than other places.

You can also check detailed information on each point. Tap the icon ......

The data at the time of measurement was displayed along with the graph. Temperature measurement is carried out over a certain period of time, and its average value, maximum value and minimum value are recorded.

You can also send this data by e-mail or post it on Twitter.

Thermodo has also released the iPad version so I tried it actually.

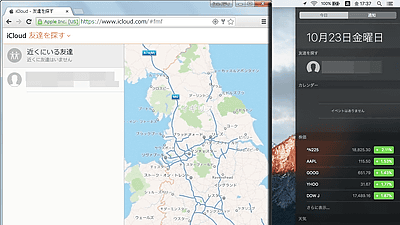
Measurement data is managed on iCloud, so it was possible to share measurement results if it is a terminal with the same account. This screen is a stage after launching the application on the iPad for a while. Despite having never measured it, the data measured by the iPhone has been inherited.

When the heat map is enlarged and displayed, it is like this. The heat map was designed not to display the full screen but to split the screen horizontally and display it. Since it has the absolute size of the screen, it is easier to see compared to the iPhone, but I felt it would be easier to see if the display on the full screen became possible.

I tried to measure it here and there while inserting Thermodo for a while, but it was an interesting function that data which can not be usually seen can be easily "visualized" in an easily understandable form. However, since each measured data is not collected at the same time, one side that feels a little uncomfortable to call "heat map" strictly comparing the value of each place is also.
In addition, because Thermodo is a simple measurement utilizing smartphones, the fact that the measurement environment is not constant is one weakness. From the measurement result, I could not look back on the environment that used the data, and I felt it was inevitable that the meaning of the data would be lost if it became an air conditioned office or a place of transportation.
Thermodo's heat map function which is currently only to accumulate data at the individual level, but if we are to lead to big data analysis utilizing future cloud environment, those weaknesses will be covered and individual It may be that Thermodo 's original ability to demonstrate various environmental data at the level will be demonstrated.
Related Posts:
in Hardware, Software, Smartphone, Review, Posted by darkhorse_log
