I tried "Woopra" which can do ultra-powerful real-time access analysis beyond Google Analytics for testing
Because normal access analysis does not know the result unless some time elapses, it is difficult to understand that "This page is hit right now!", But this "Woopra"The access analysis service has a ridiculous real-time nature, and it seems to be immediately understood when someone comes to visit.
In order to make maximum use of real-time access analysis, there is not only use via a browser but also dedicated software compatible with Windows, Mac and Linux made based on Java, tagging visitors individually, tracking IP A quick filter that can narrow down by any conditions such as an address, a map that you can know immediately who is from where you come from, a function that pops up when users of specific conditions come and features sounds, and so on. Everything will change in real time in time and the latest information will be taught. Most of the functions realized with Google Analytics are covered, the information is also very easy to see in detail, yet easy to use, easy to install on multiple sites.
That's why the following is a thorough explanation of movies and how to use it, which shows how much the power of real-time access analysis "Woopra" really is.
Woopra - Website Tracking, Statistics and Analytics
http://www.woopra.com/
◆ Seeing the four movies of the state that you are actually using
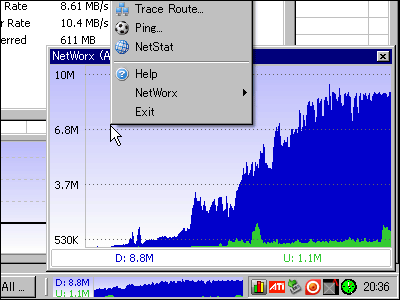
First of all, it is from a movie that actually logs in and uses it. The number of people currently browsing is displayed in the upper left, the visitor's location is displayed in the middle map, and further detailed user information (IP address · browser name · OS name · screen resolution, etc.) is displayed one after another on the right side I will.
YouTube - A state of real-time access analysis under "Woopra"
As you can see the map below, full screen display is possible and it is quite fun. Once recorded in full HD, you can browse the actual size if you go to YouTube site instead of embedding.
YouTube - Try using the map display of "Woopra" in full screen
In addition, it is also possible to notify by sounding a pop-up window and sound when a user who meets a specific condition comes. Of course, you can customize only the popup window, only the sound, or record it, but do not notify you. Although it closes without permission even if it does not close by oneself, I click on it in the sense that I can erase it for the time being, I am erasing the window. Also, since the sounds sound, playing attention.
YouTube - Features that teach you when people come in "Woopra" in real time
As for how much real time property is actually high, it responds within about 5 seconds with the following feeling. Since it contains multiple tags, it is displayed as POPOPON at one time, but usually it is one for one user. This also sounds so loud that the playback attention.
YouTube - The real-time plot of "Woopra" is well understood
It should have understood the rough power of Woopra. The next is about the procedure for actually using.
◆ Register to "Woopra" and install special software and make it available for use
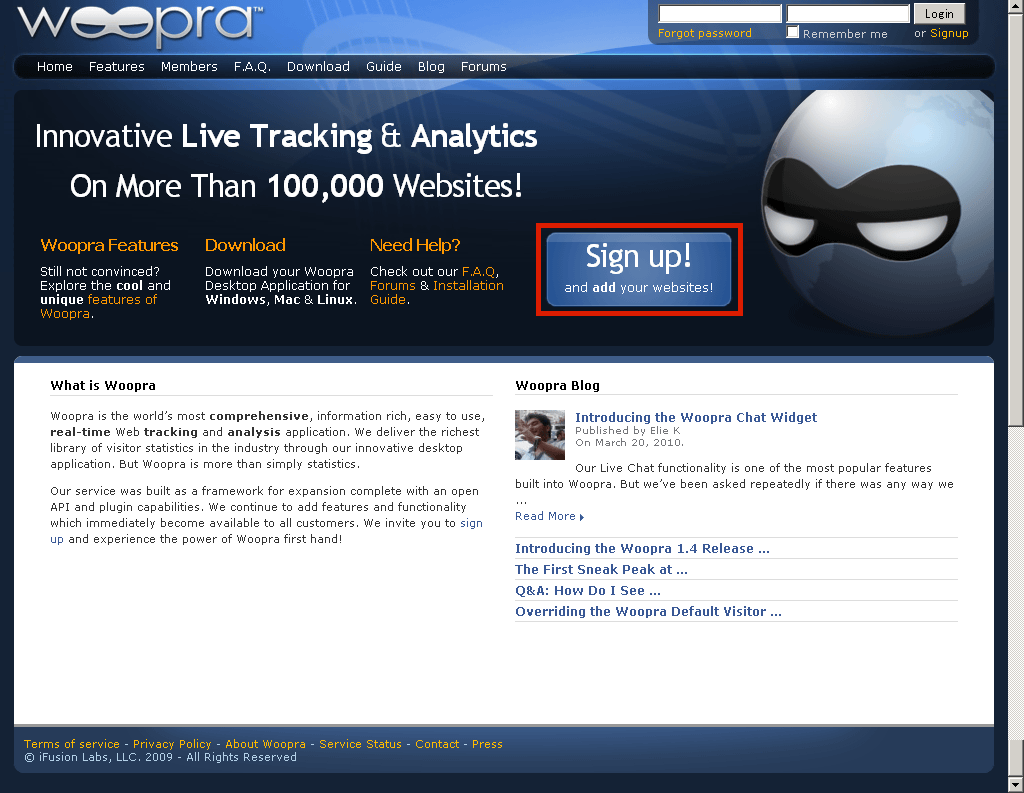
First of allTop pageAccess "and click" Sign up! ".
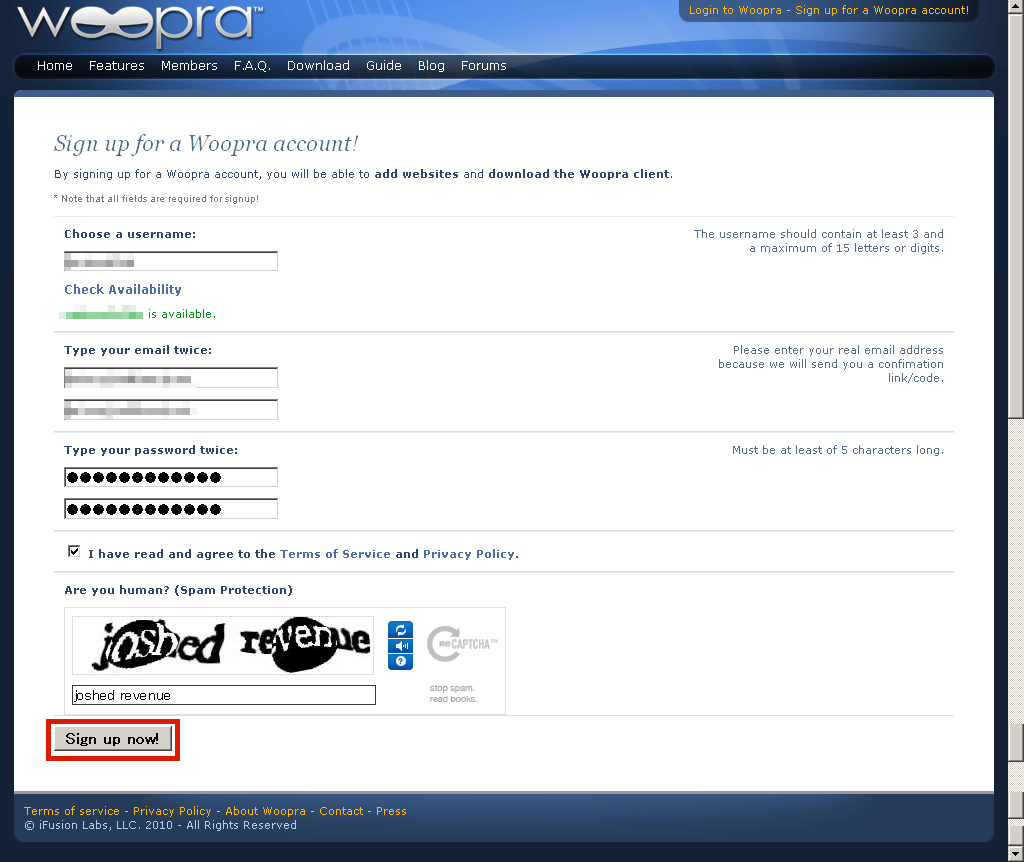
Please choose your favorite user name, enter your e-mail address and password, enter a check mark, enter the characters of the displayed image, and click "Sign up now!".
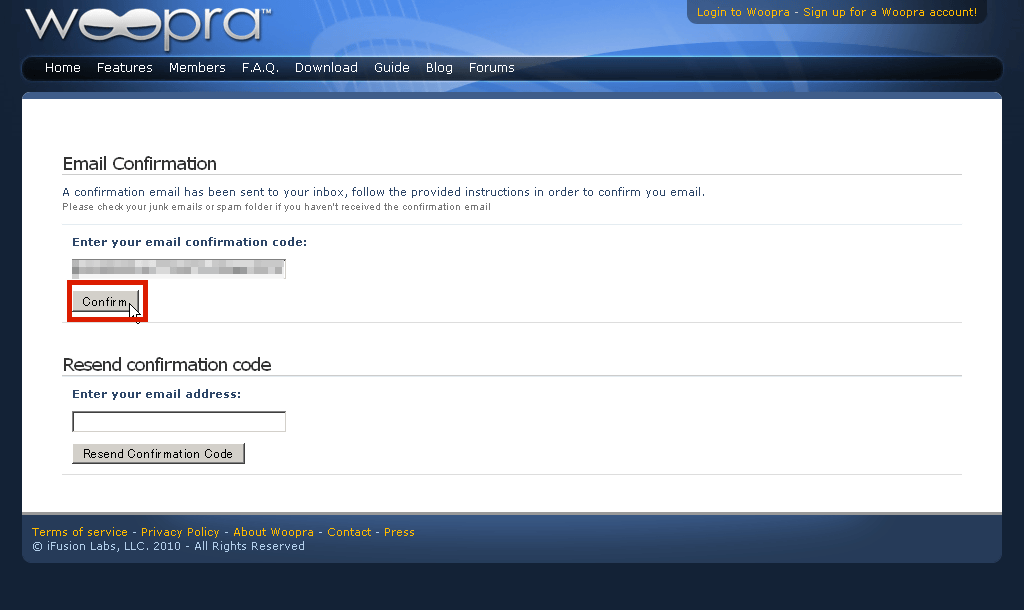
Since such a mail comes to the registered mail address, either access the written address or copy and paste the authentication code on the page for entering the authentication code.
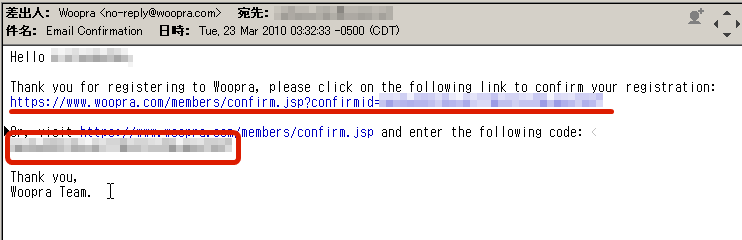
This time I decided to paste the authentication code on the page for entering the authentication code. Click "Confirm".
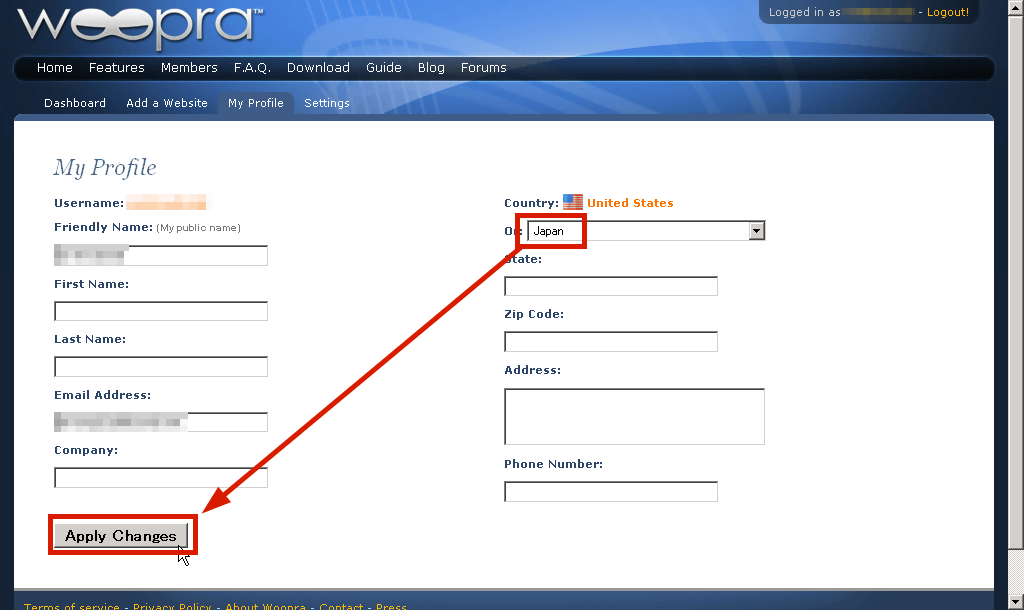
Set "Country" in the upper right to "Japan" and click "Apply Changes".
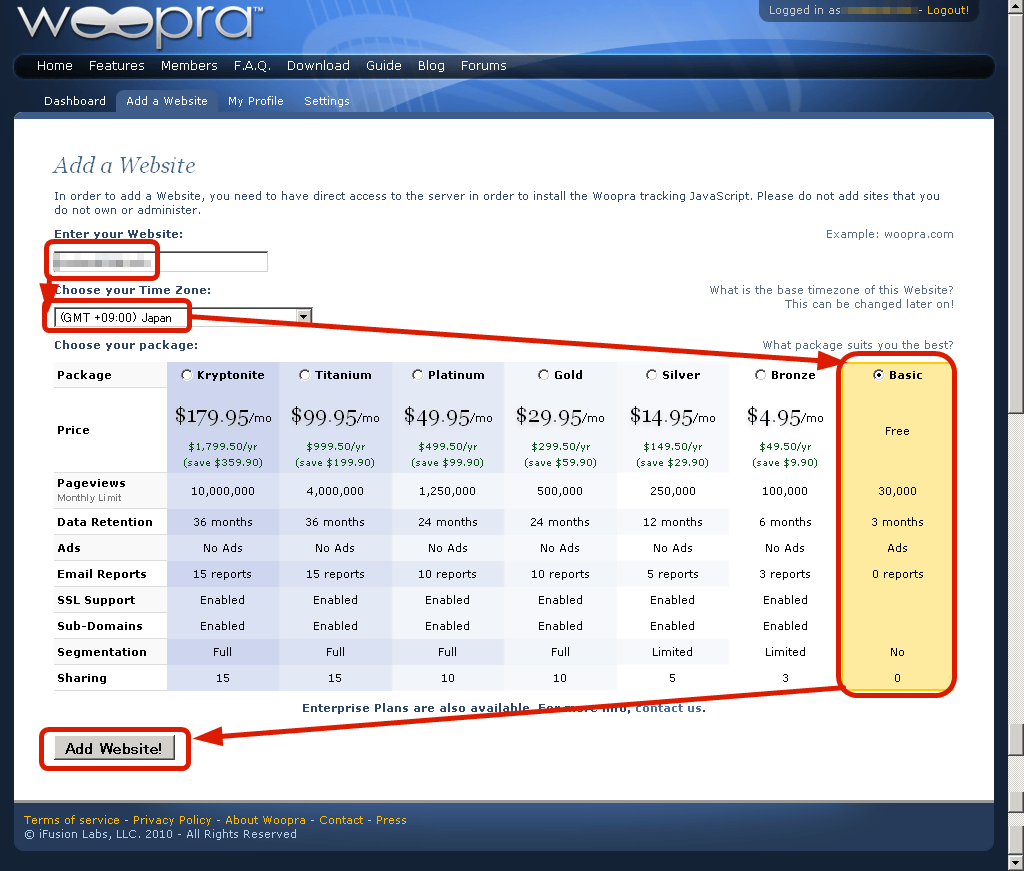
次に自分のサイトを登録します。サイトのアドレスを入力し(http://gigazine.net/なら「gigazine.net」となる)、タイムゾーンを「Japan」に変更、一番右端にある「Basic」を選んで「Add Websites!」をクリックします。Basicプランは無料で1ヶ月3万ページビューまで利用可能で、3万に到達するとそこで自動的に止まります。なお、アクセス解析データは過去3ヶ月分まで保存されるようになっています。
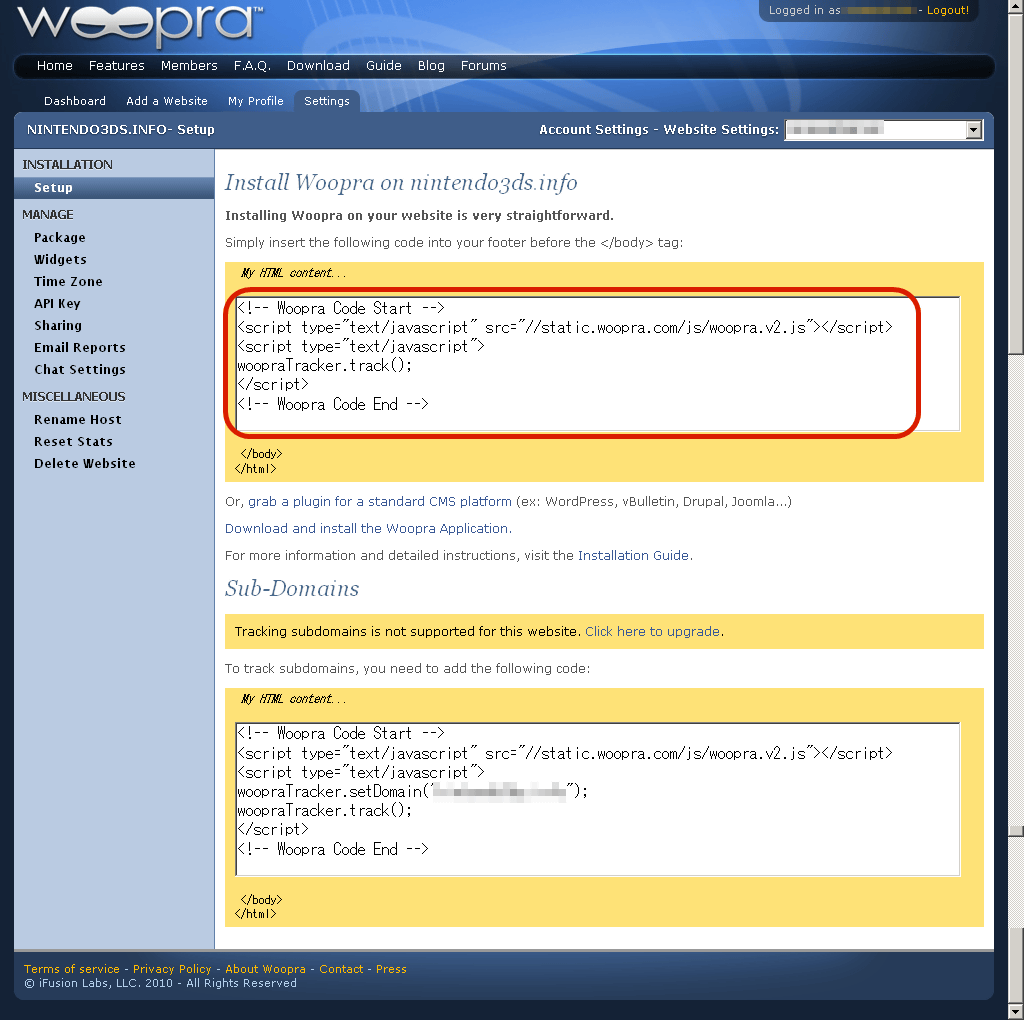
Since the code for embedding in the site is displayed, copy it and paste it before "/ body".
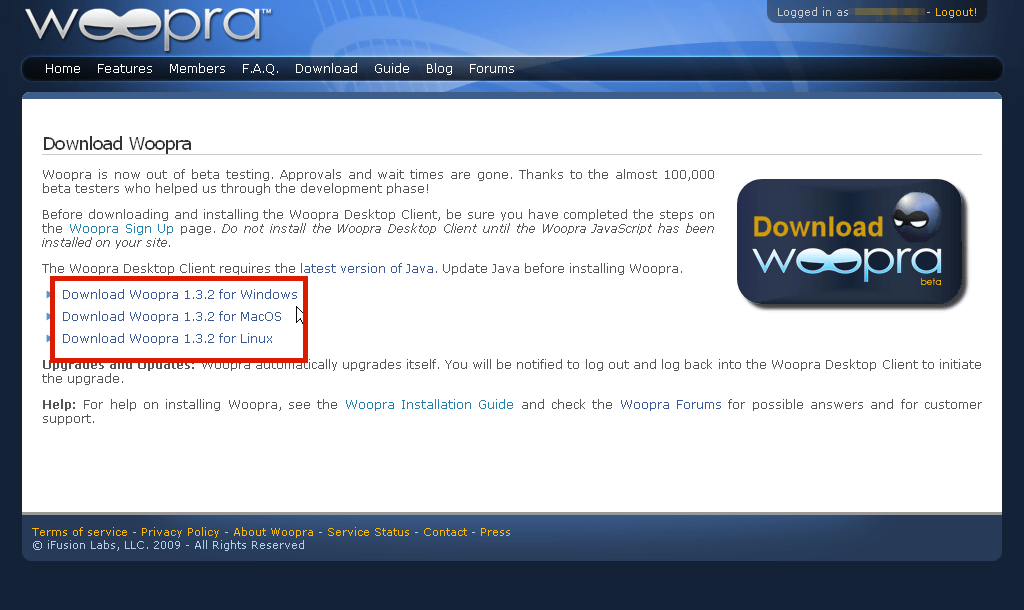
Next, dedicated software for real-time access analysisThis pageDownload from. This time I downloaded for Windows, but there are also for Mac and Linux.
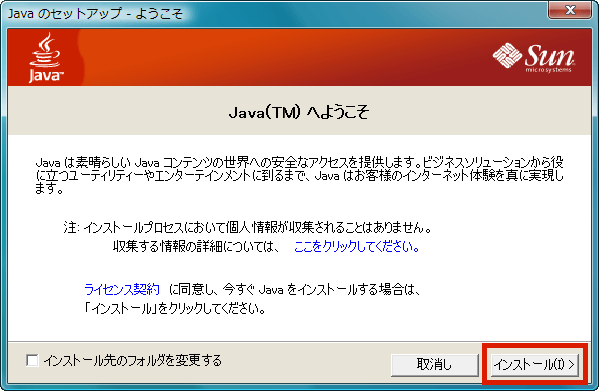
Since installation of Java is indispensable to make it work,Official website of JavaGo to "download free Java".

Click the downloaded Java installer.
Click "Install".
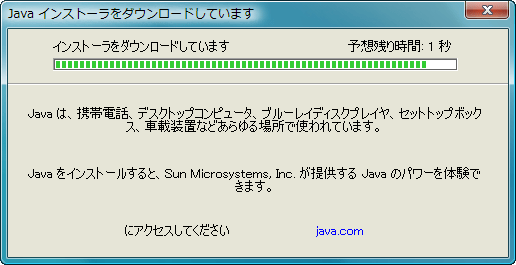
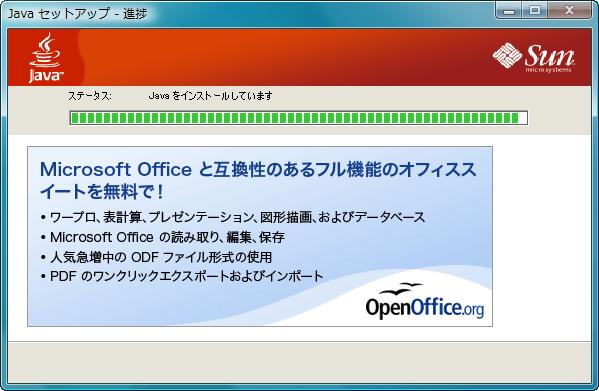
Downloading installer body.
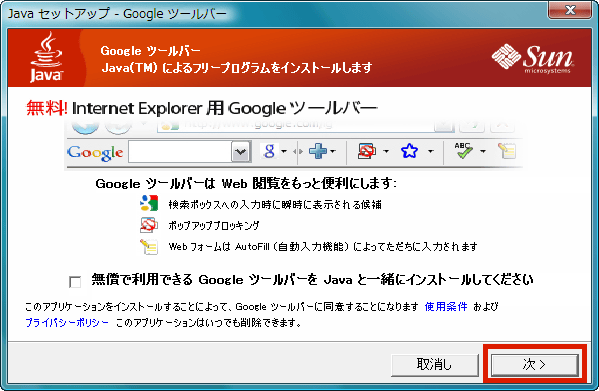
Click "Next". In order not to install the Google Toolbar this time, I unchecked it.
Installing Java
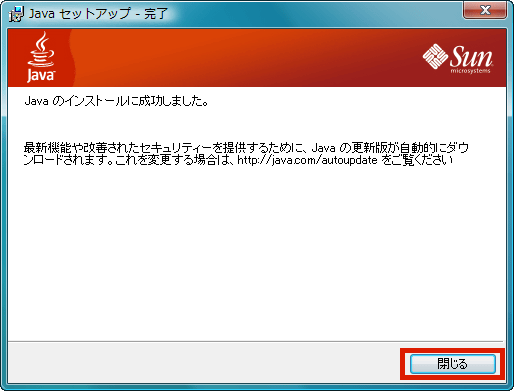
Installation succeeded, click "Close"
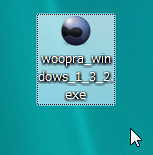
After installing Java, click on the woopra installer next.
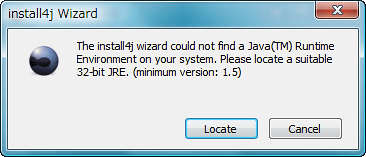
By the way, when you click on the woopra installer, it will be displayed like this if there is no Java.
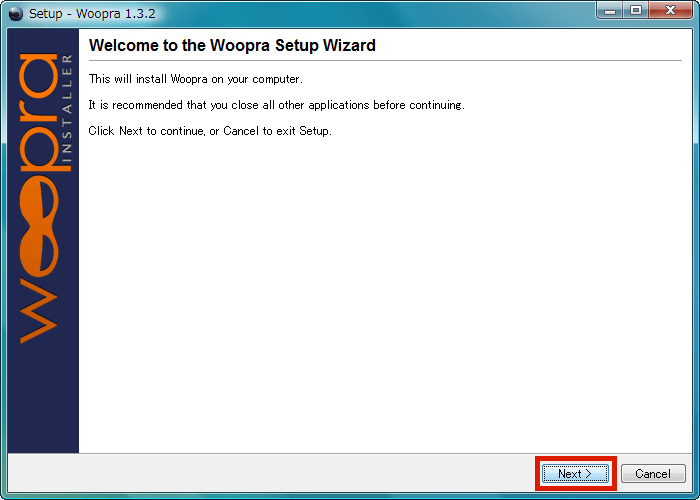
If Java is installed properly, it will look something like this, so click "Next"
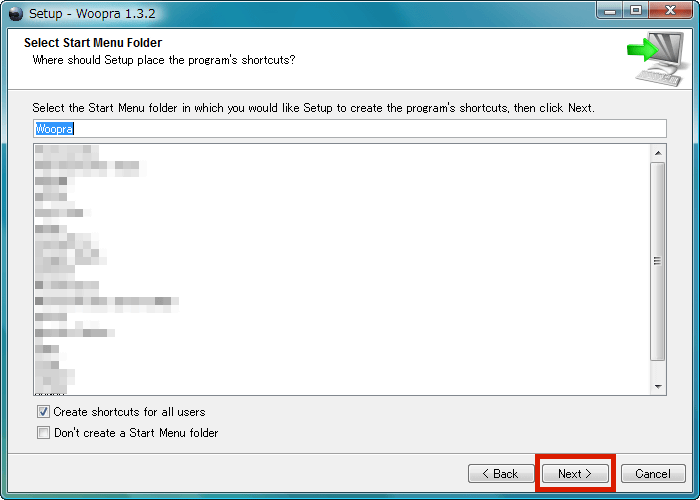
Click "Next"

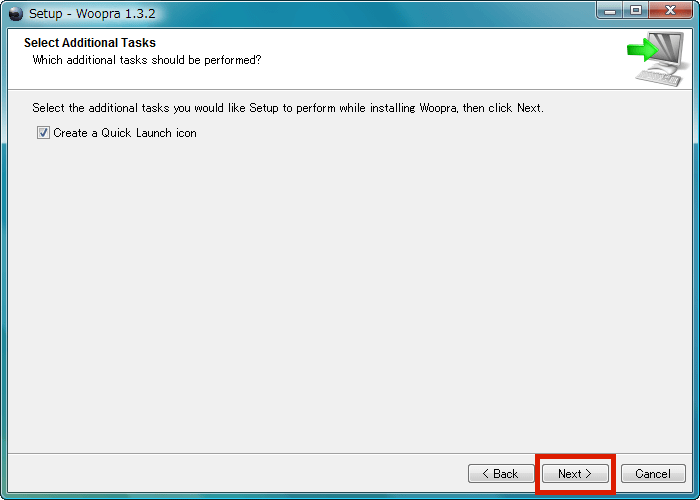
Click "Next"
Click "Next"
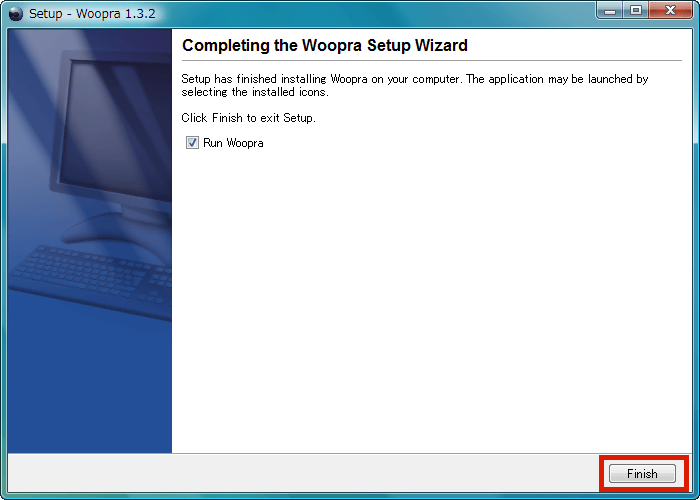
Click "Finish"
◆ Various settings before use
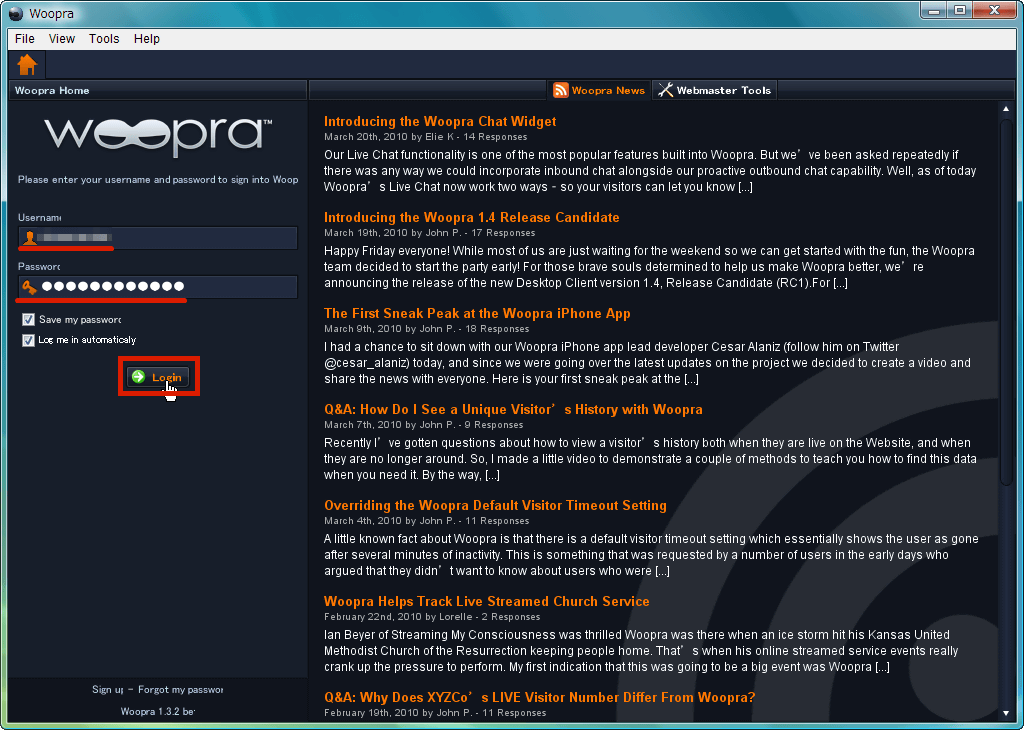
When starting up, enter "Username" and "Password" and click the "Login" button. In order to omit next and subsequent inputs, put a check in "Save my password" and also check "Log me in automatically" in order to log in automatically.
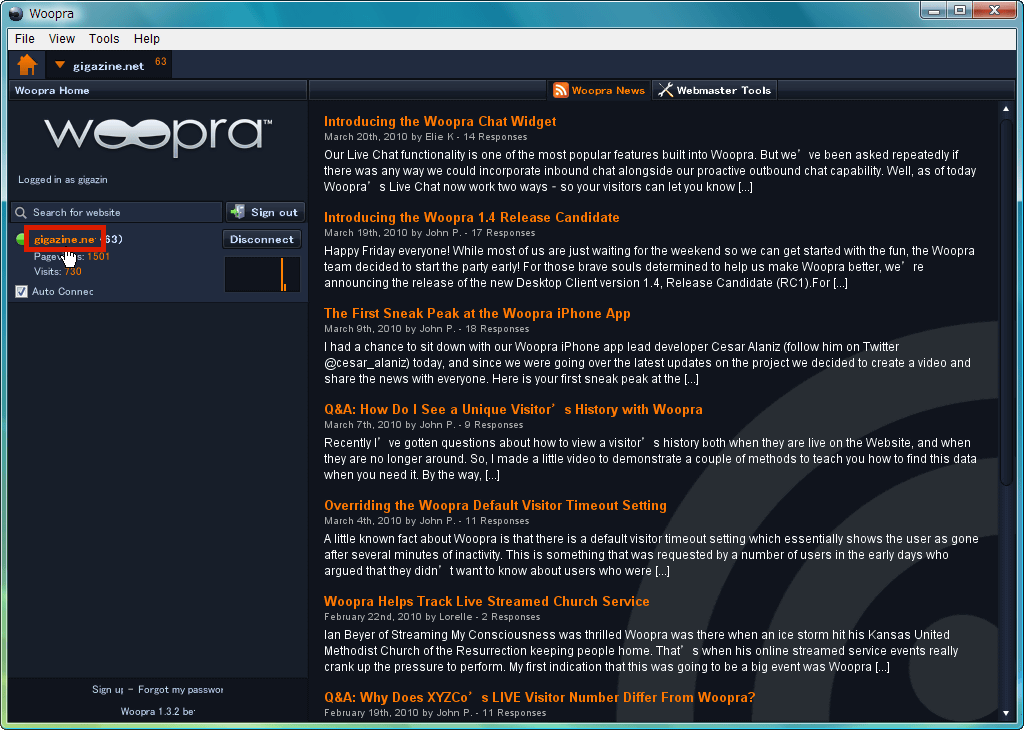
Click the site name
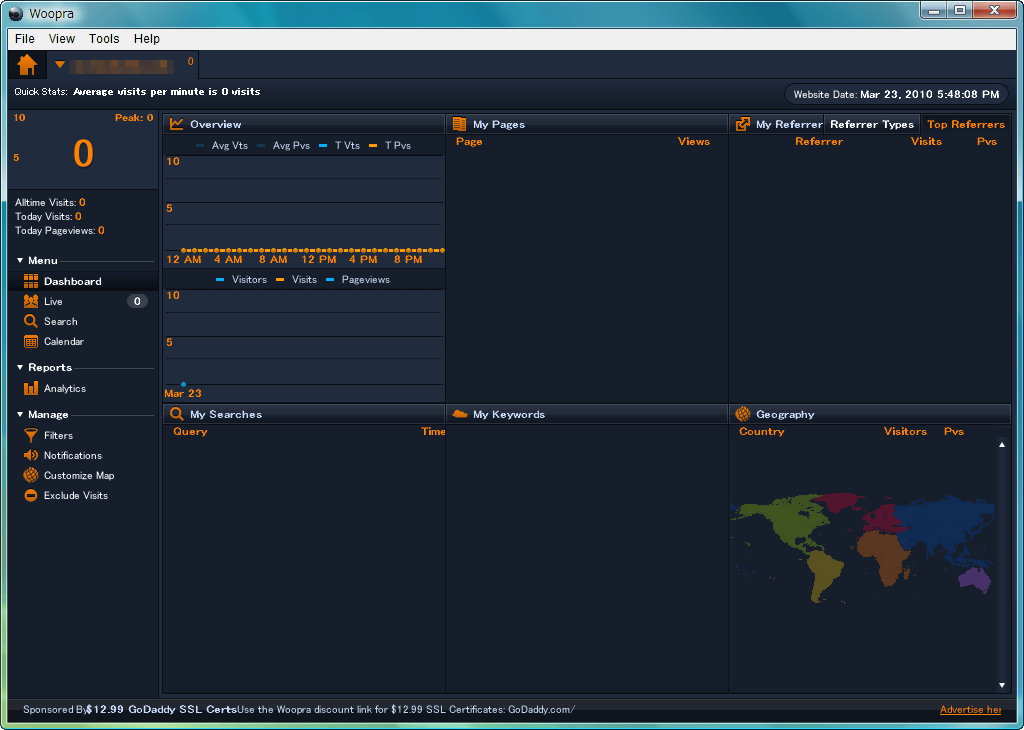
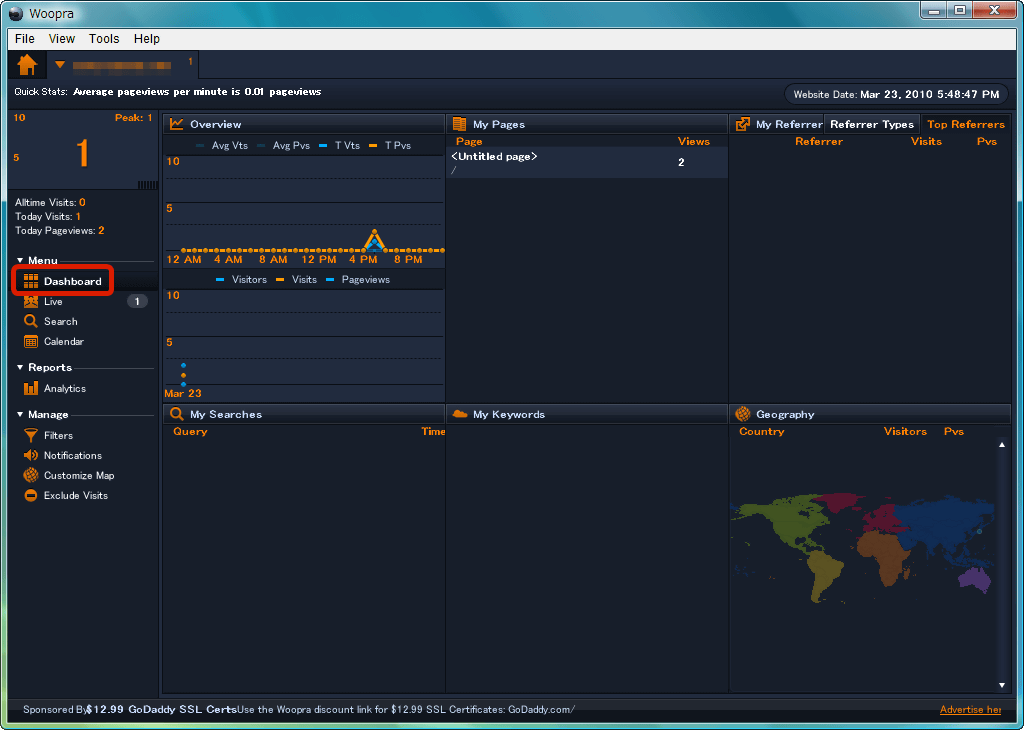
This is the initial screen dashboard. It is like this when no one is in the state.
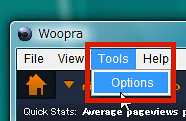
Let's set it up first in various ways. Select "Options" from "Tools".
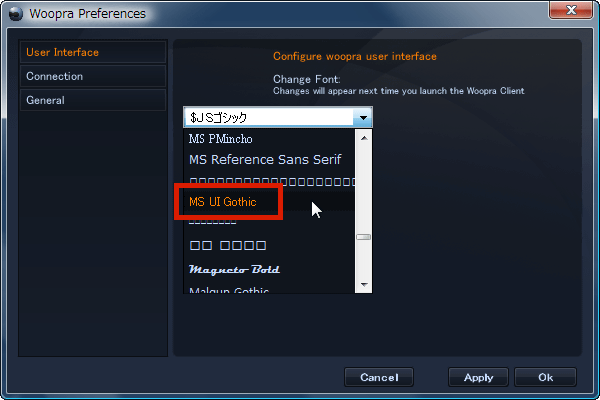
Choose a font that can display Japanese as a display font. This time I chose MS UI Gothic for user interface.
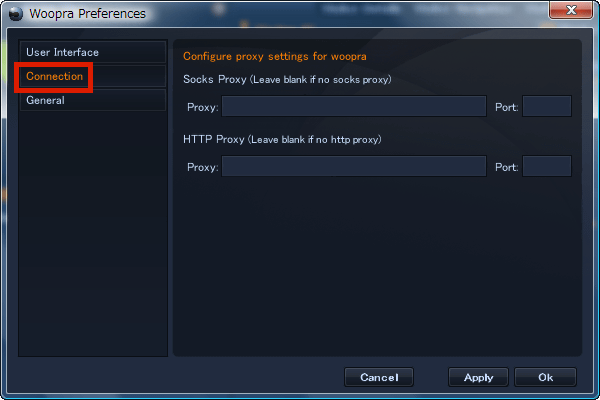
To go through a proxy server, set it from "Connection".
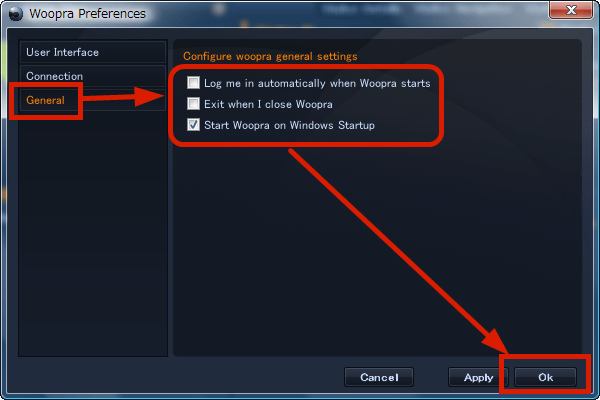
In the initial state, when Windows starts up, Woopra also starts up. If you want to stop it, uncheck "Start Woopra on Windows Starup" from "General" and click "OK". Even if you press the "X" button at the top right, Woopra does not end but it resides in the task tray, but if you check "Exit when I close Woopra", it will be possible to end with "×" button .
This completes the presetting. The next is actually the view of real-time access analysis.
◆ What can you learn about real-time access analysis?
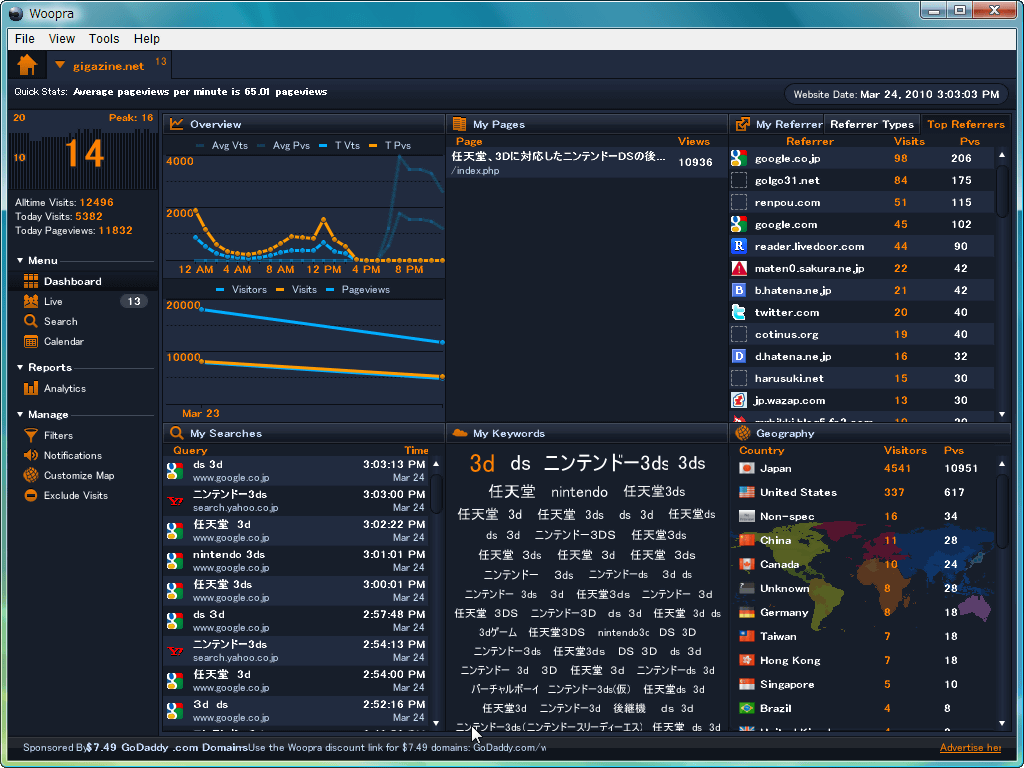
First, click "Dashboard" from the menu. A rough summary of the overall access analysis is displayed here. Since I just added a tag, only one person has come, and "1" is written on the upper right.
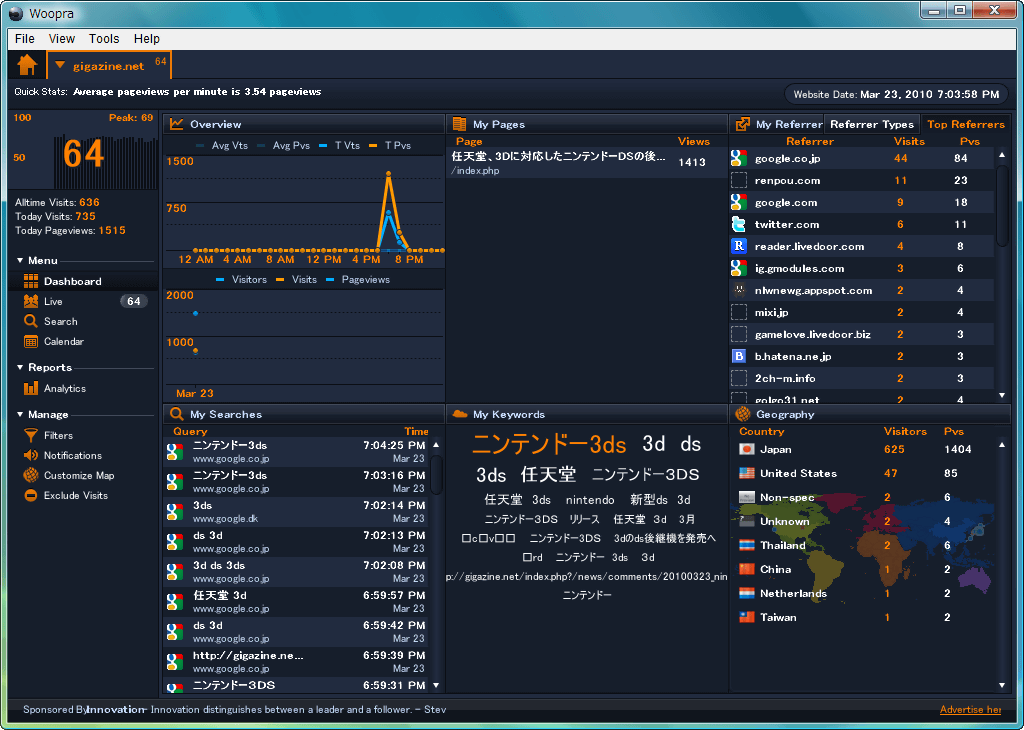
As a test this time "Nintendo releases Nintendo DS's successor "Nintendo 3DS (3 Dies)" compatible with 3D in the fiscal year ending March 2011I tried putting in a tag.
This is the state of "Dashboard". The graph is displayed in chronological order in "Overview", orange is page view, and light blue is the number of unique users. "My Pages" shows the title of the page. "My Referer" shows what page you came from on your site (link source), and "My Searches" displays the latest phrase about what type of search phrase you came to your site. "My Keywords" is like a tag cloud, and the keywords searched most frequently up to the present time are displayed large. "Geography" is a statistic of which country you came from. These numbers are updated every moment.
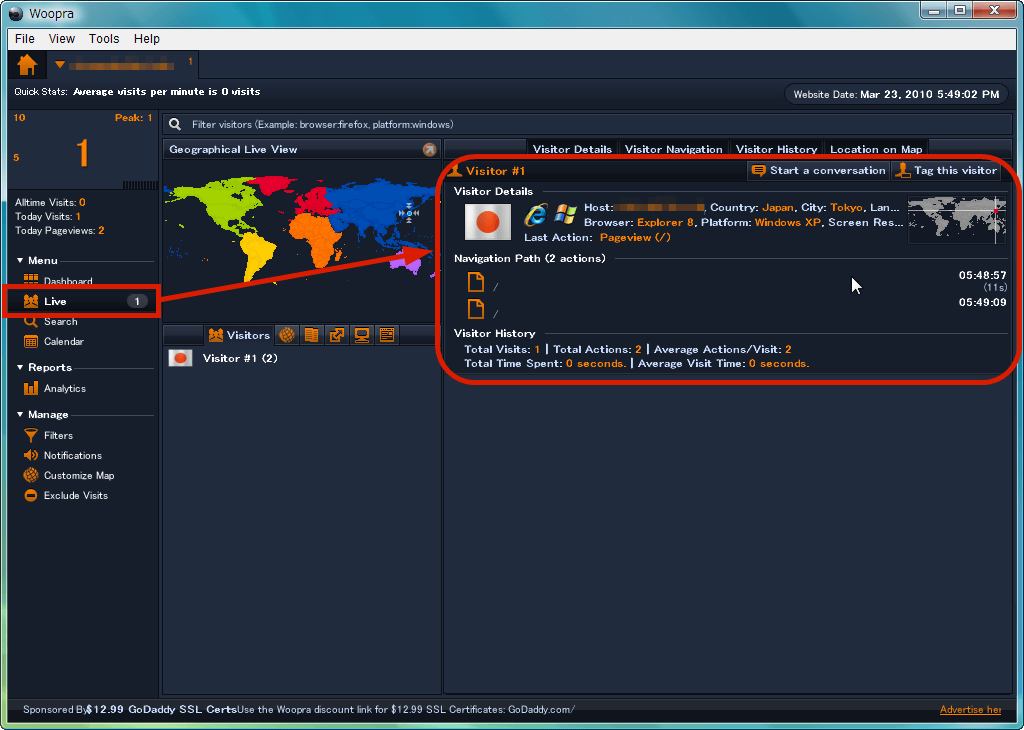
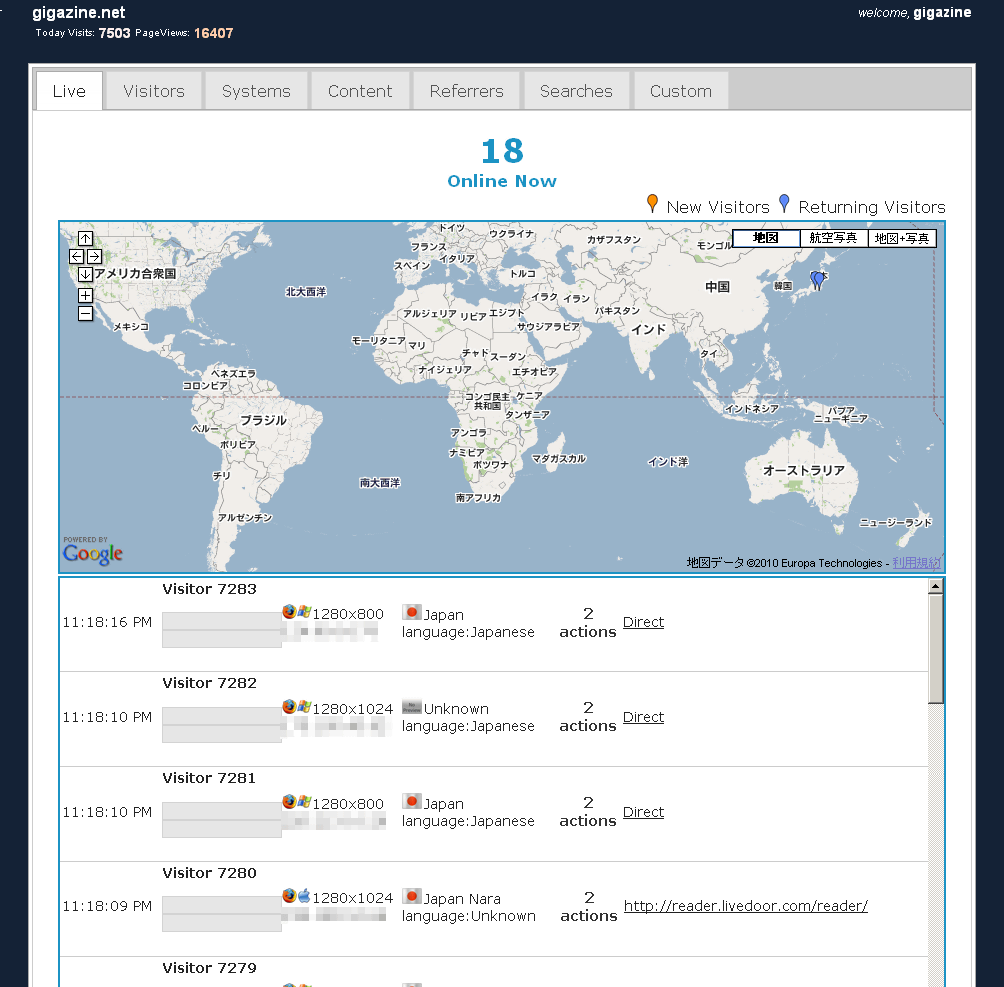
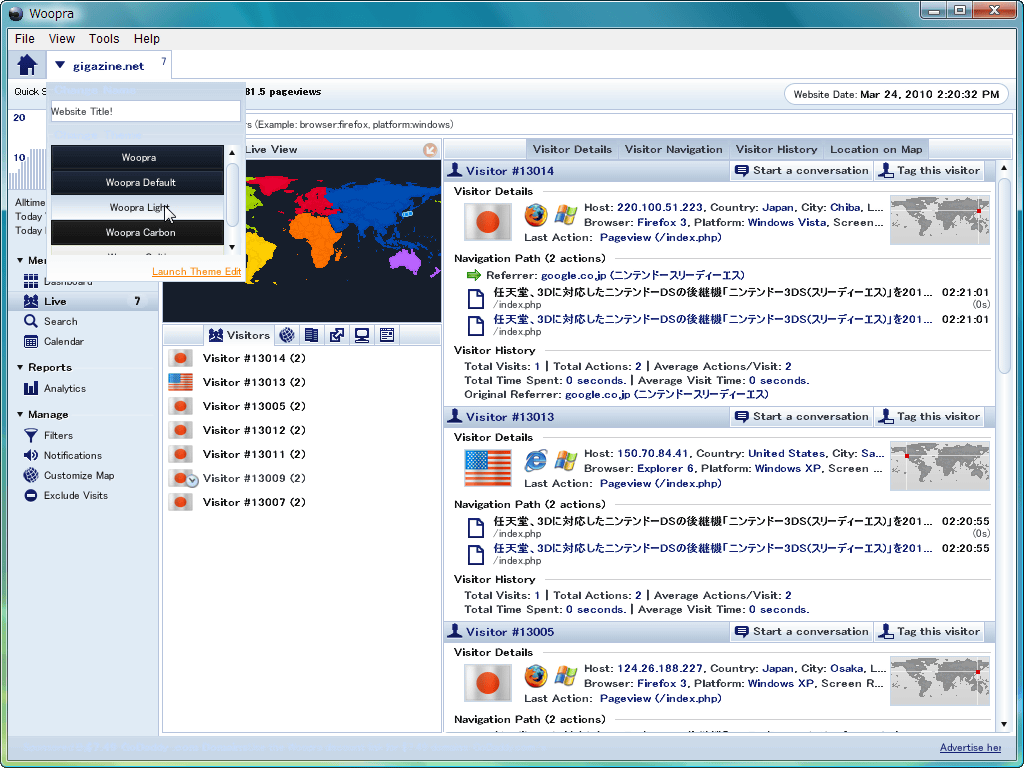
More detailed real-time access analysis from "Live" is possible at the stalker level, and the information of the person who is visiting the site right now and seeing the page is displayed from time to time. When someone comes up with a new user, it will be displayed as Piko in the map, the country flag indicating which country, the browser and OS icon you are using, IP address · country name · city name · browser name · OS name · resolution, and Now you can see what page you are viewing and what you are doing.
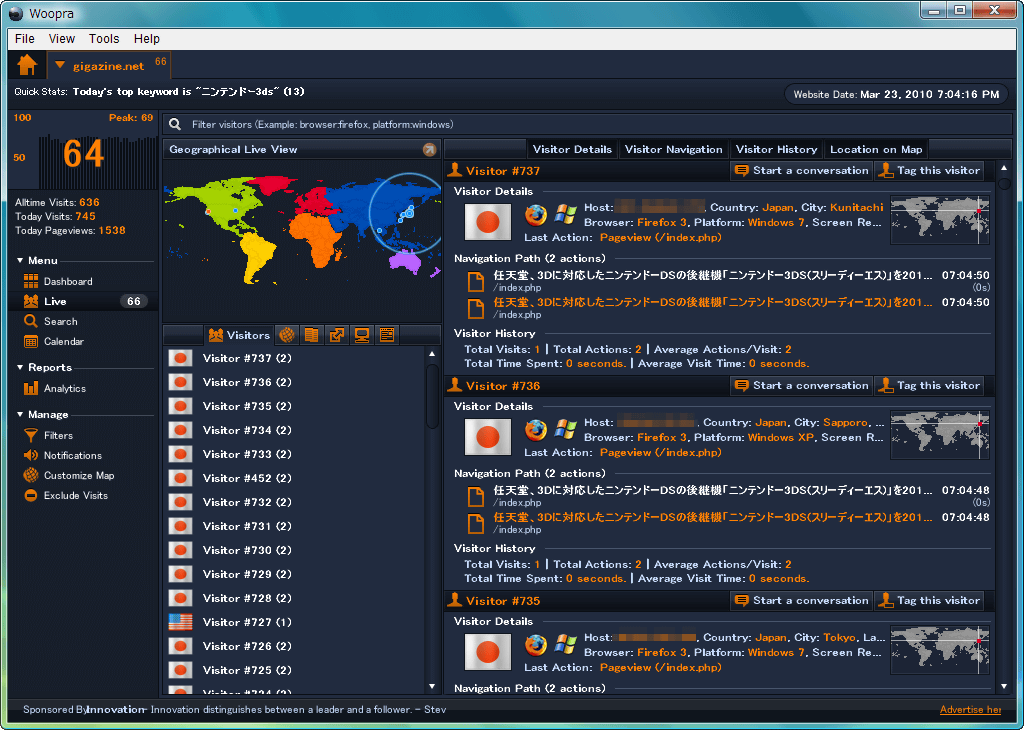
It will be like this when a lot of people come.
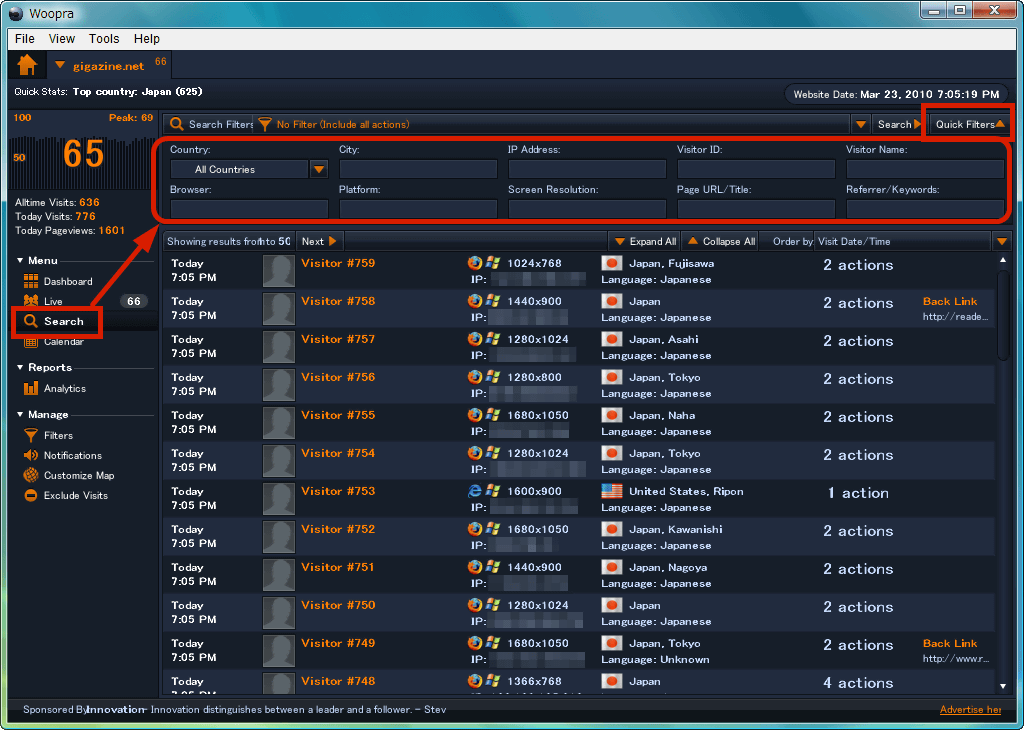
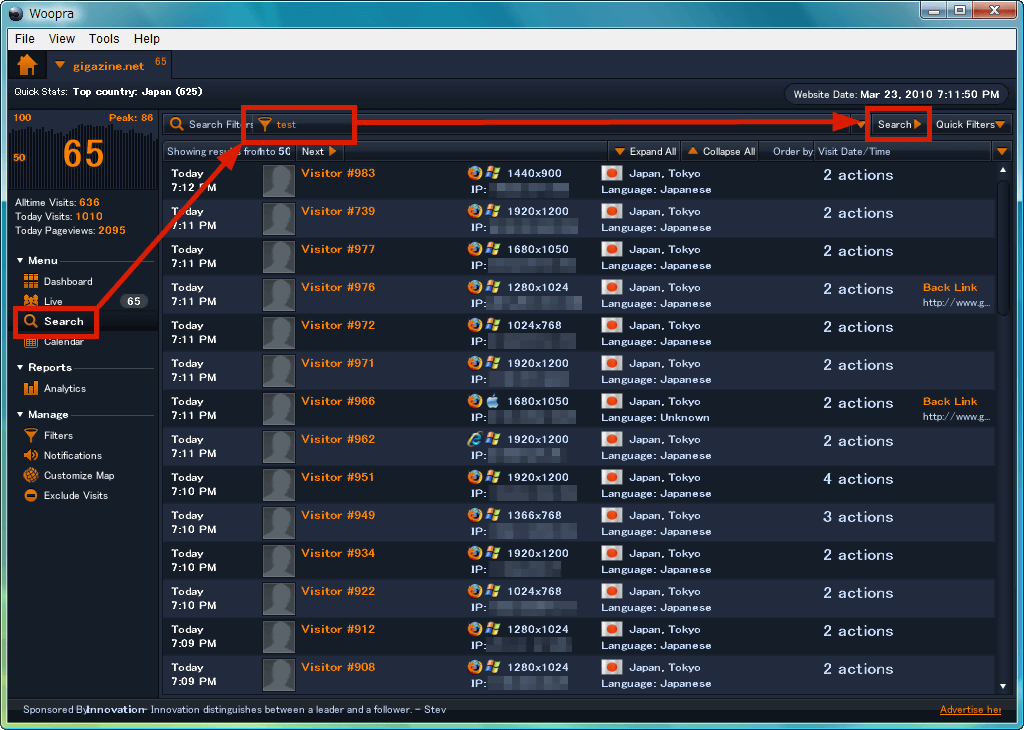
The accessed record can be searched by the quick filter and narrowed down. Click on "Quick Filters" from "Search", enter in the item you wish to narrow down and click the "Search" button above, the result will be displayed I will.
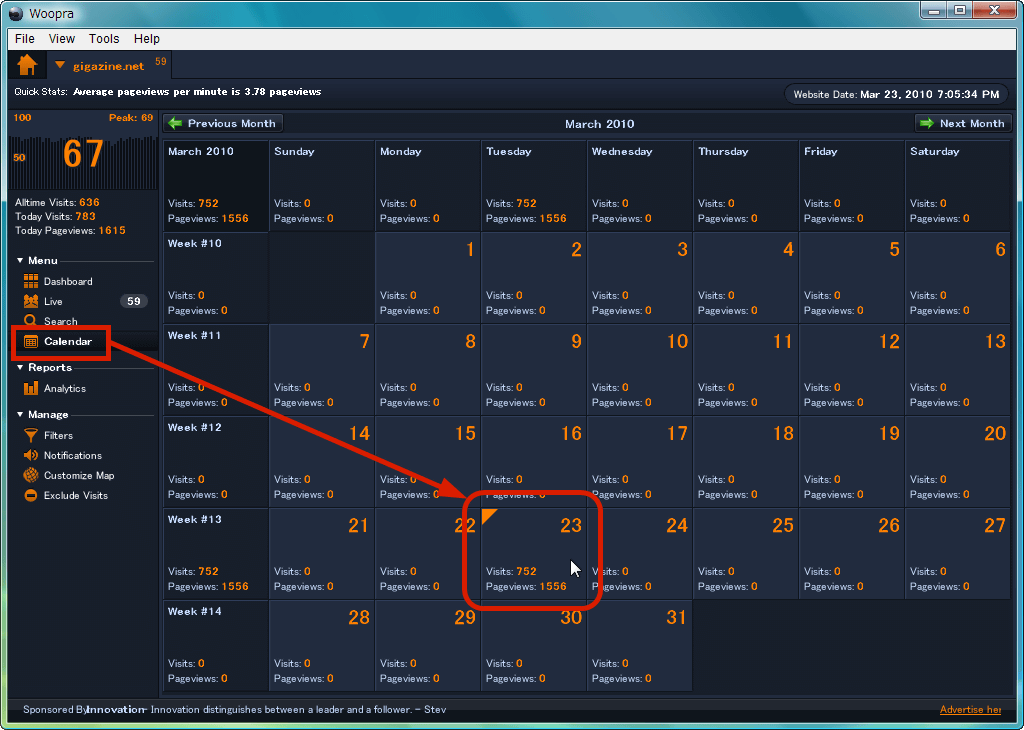
From "Calendar" you can see how long it came by day. Of course, this value is also updated in real time.
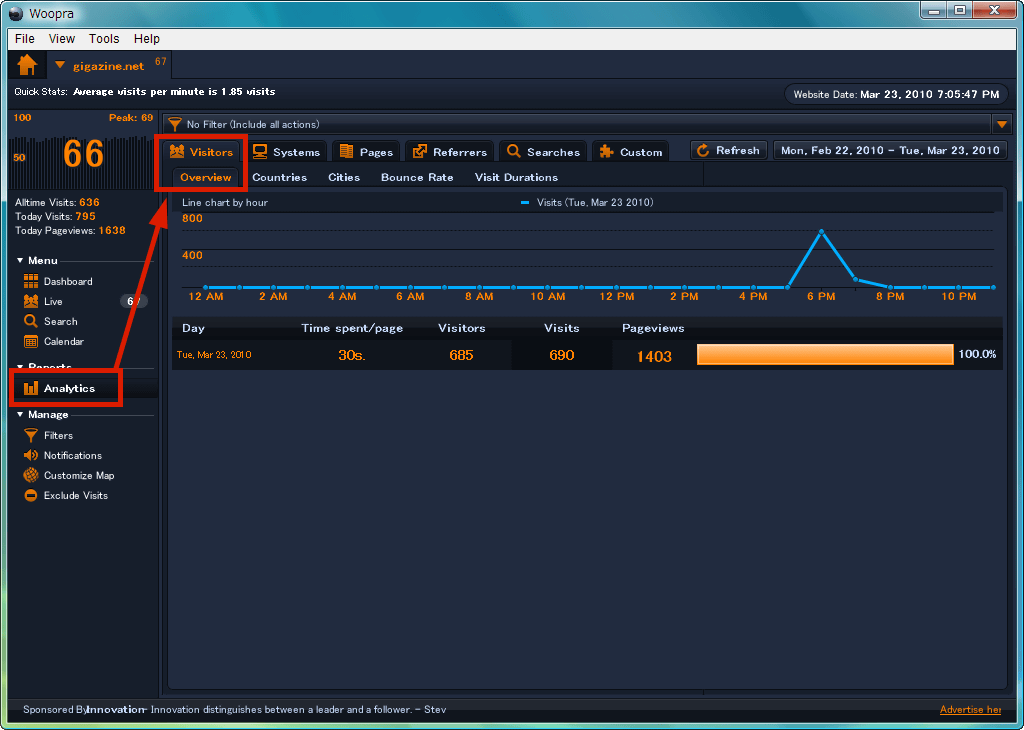
As its name suggests, "Analytics" in the menu is the main analysis, and it has a very powerful access analysis function. First of all, from the "Overview" of "Visitors". A bar chart is displayed for each day, and when selected, a line graph is displayed next time by time.
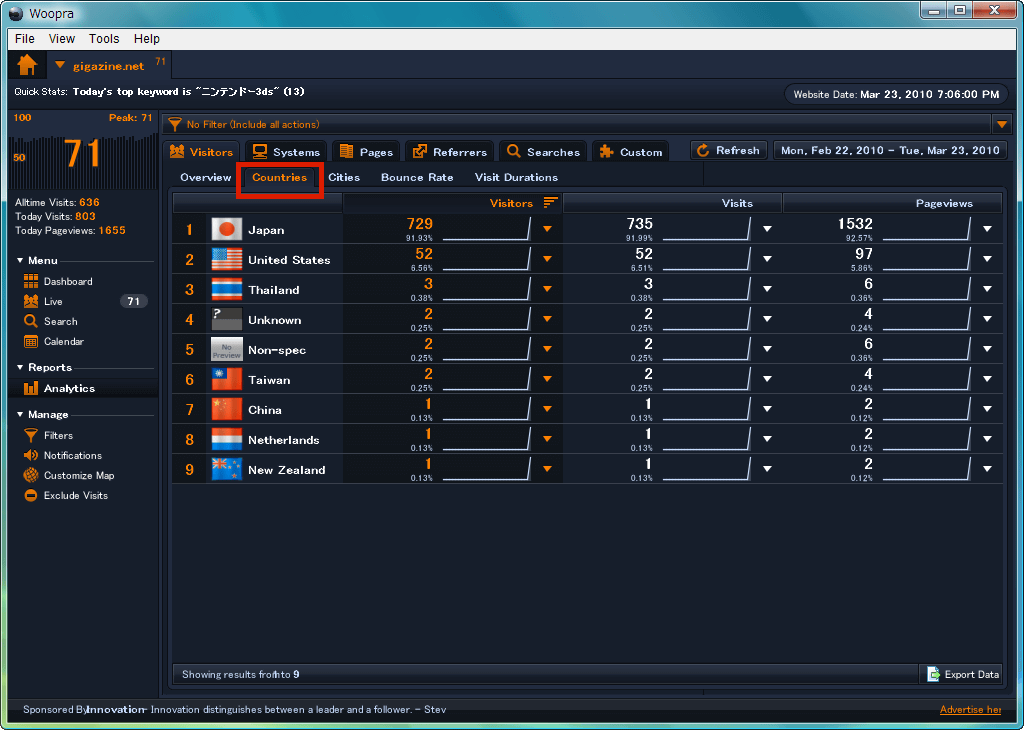
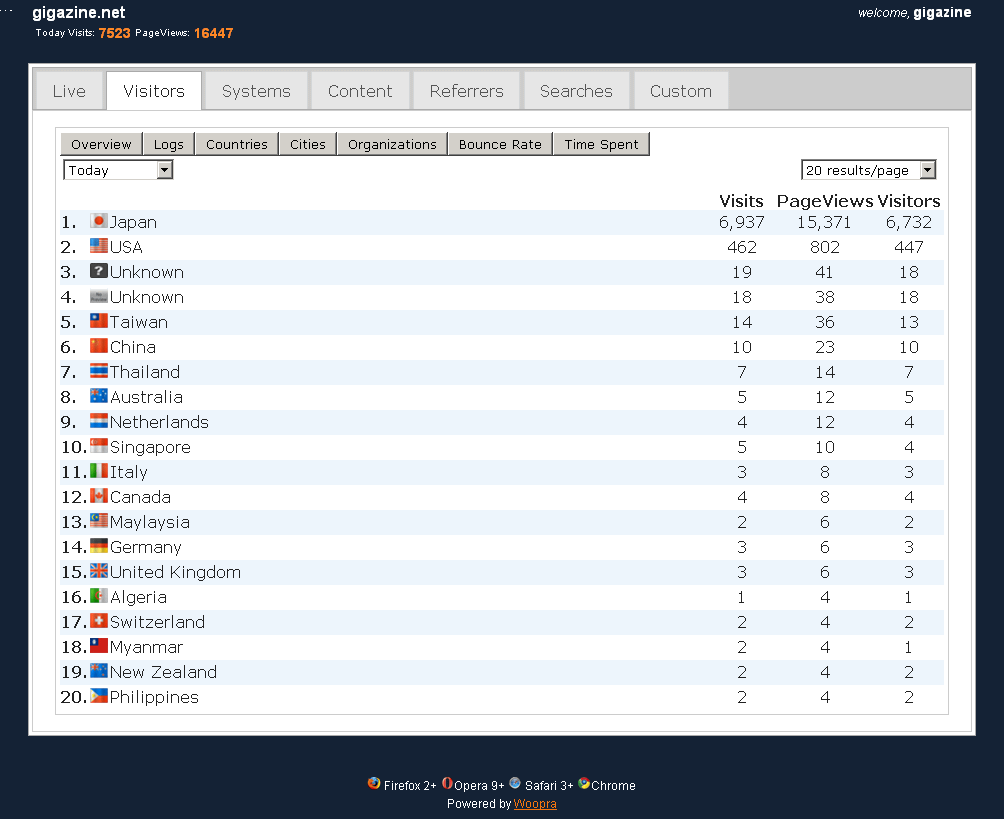
"Countries" is country-specific. If there is an "Export Data" button at the lower right of each analysis screen from this point onwards, you can save the analysis result as a CSV file to the personal computer.
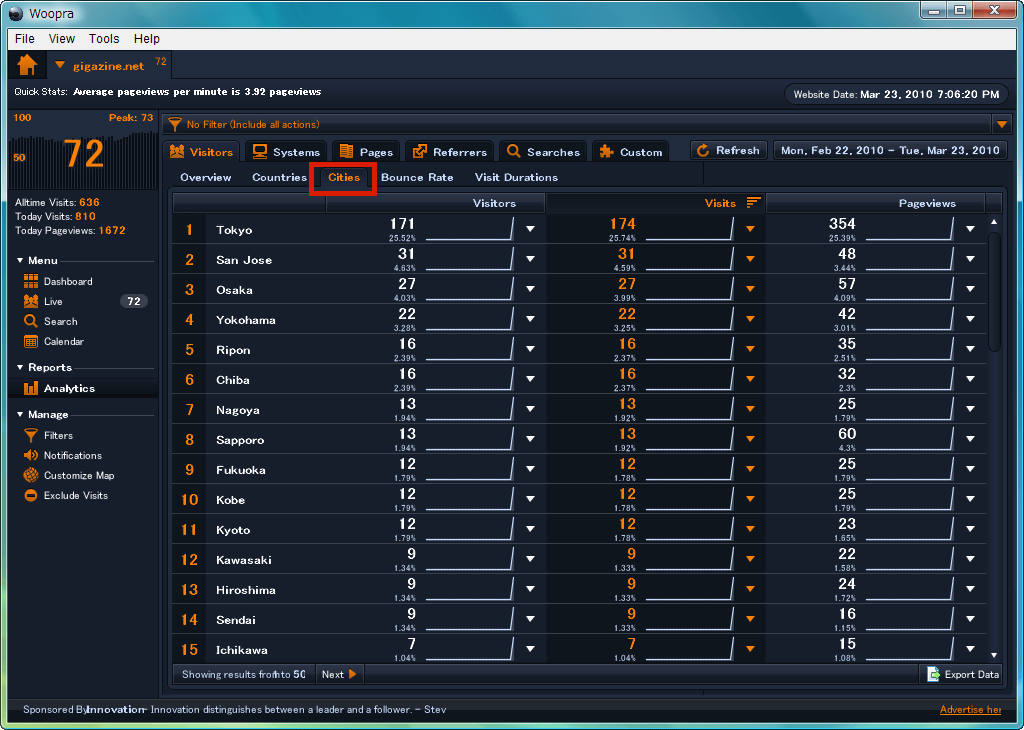
"Cities" is displayed by city
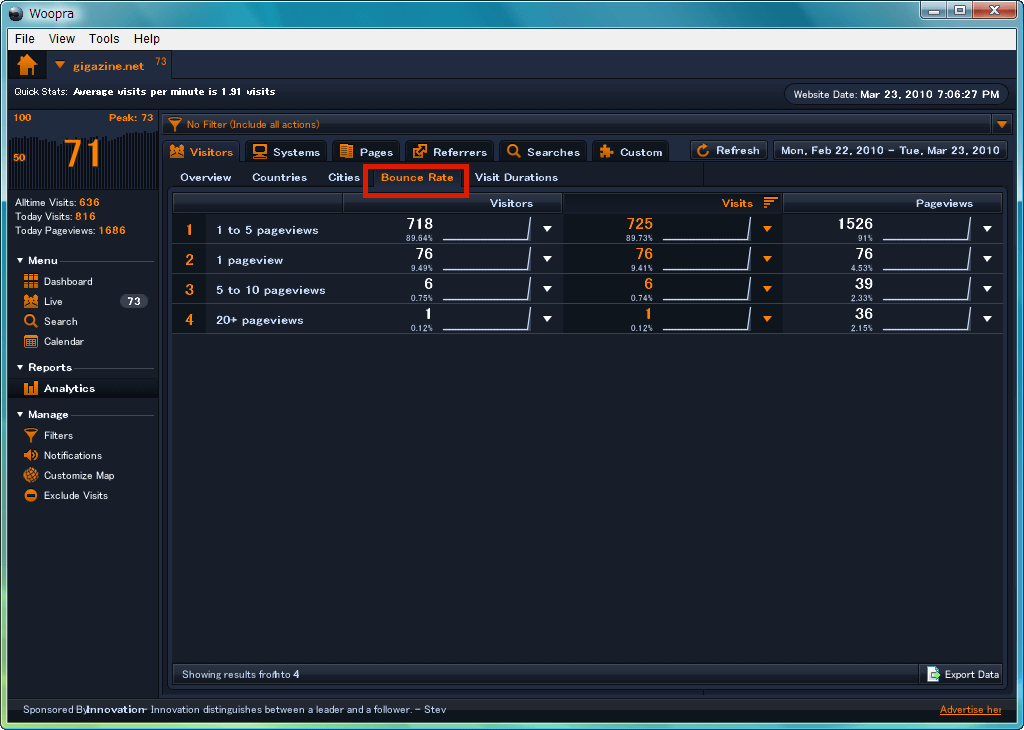
"Bounce Rate" displays the number of users per page view.
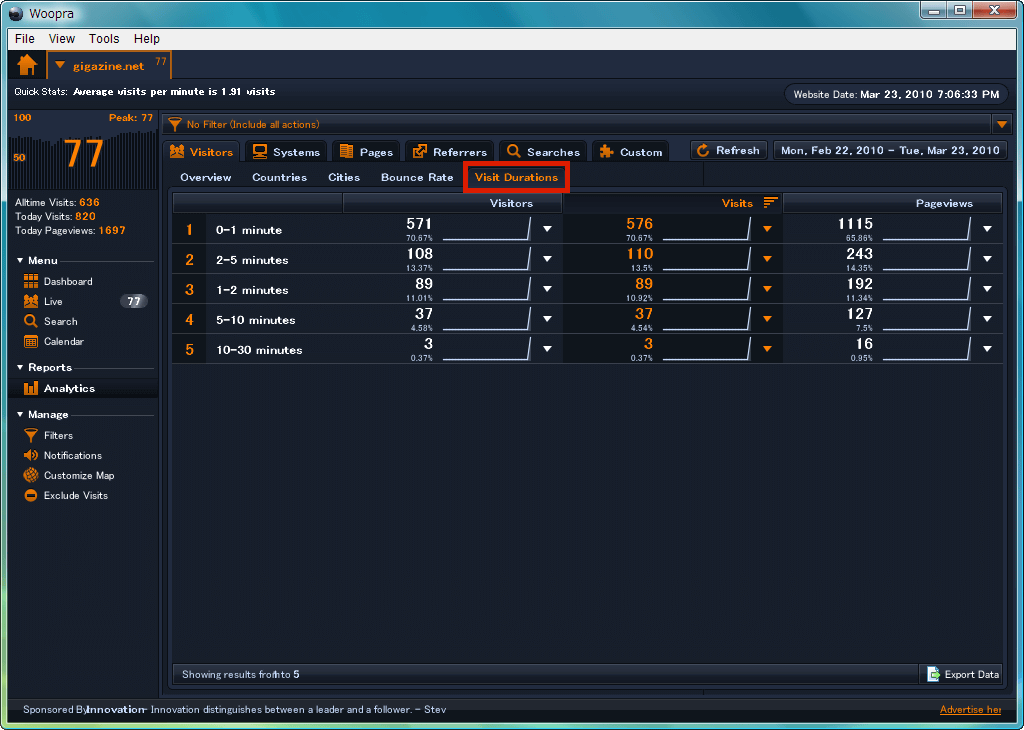
"Visit Durations" is the so-called time on page.
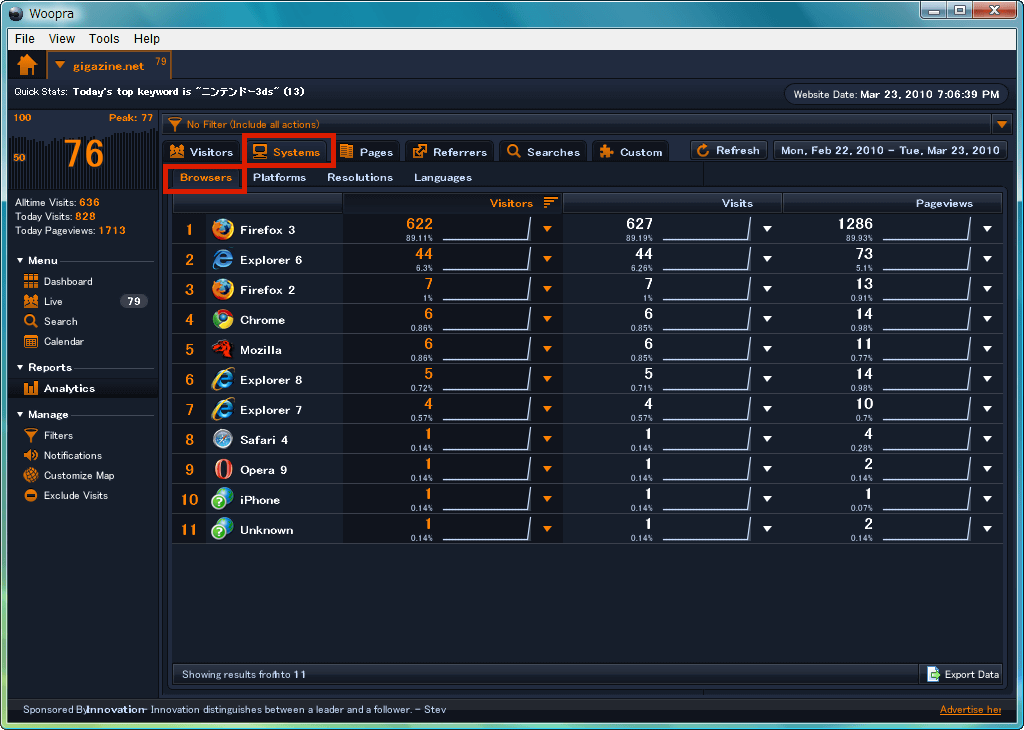
"Browsers" on "Systems" tab is displayed by browser
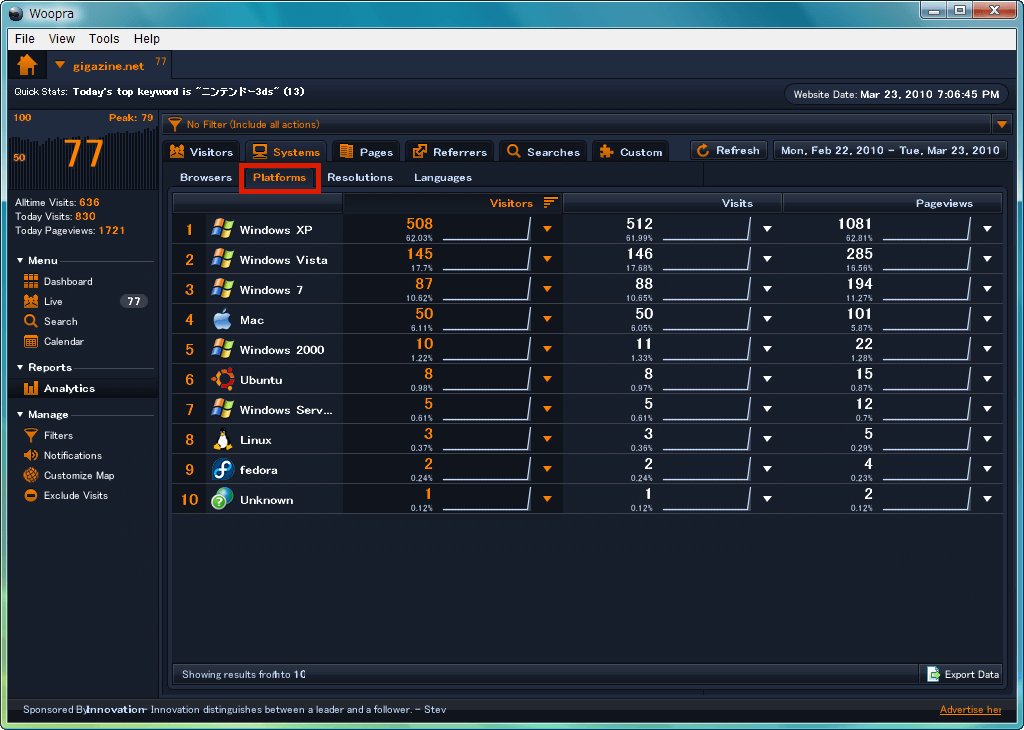
"Platforms" is displayed by OS such as Windows, Mac, Linux etc.
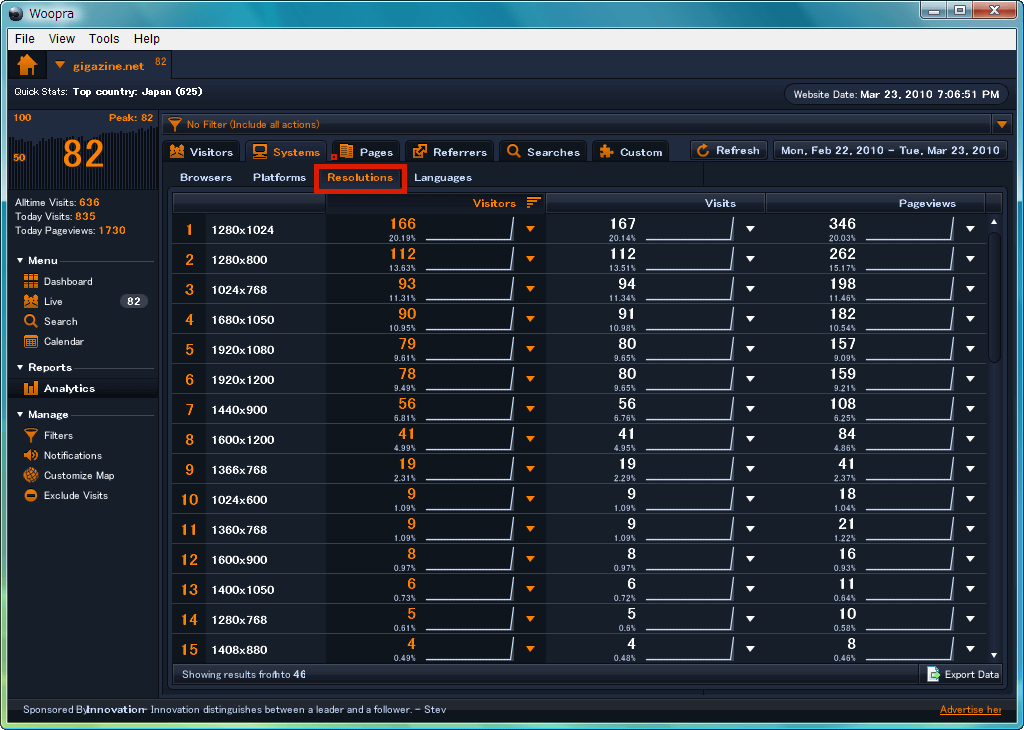
"Resolutions" is displayed by screen resolution
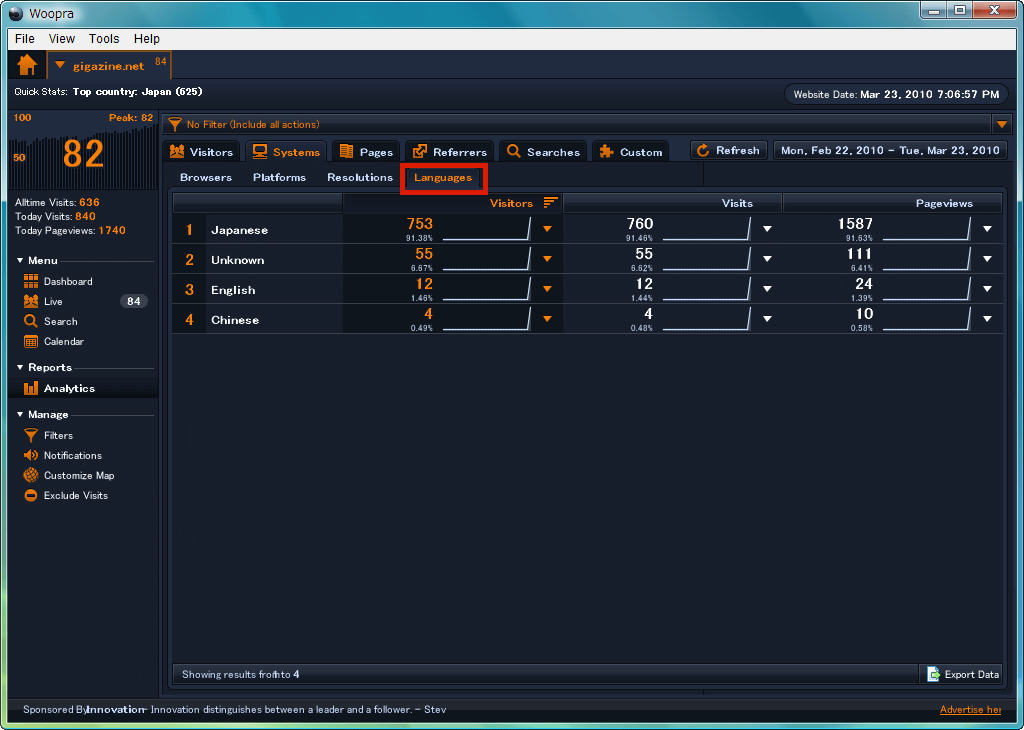
"Languages" is displayed by language
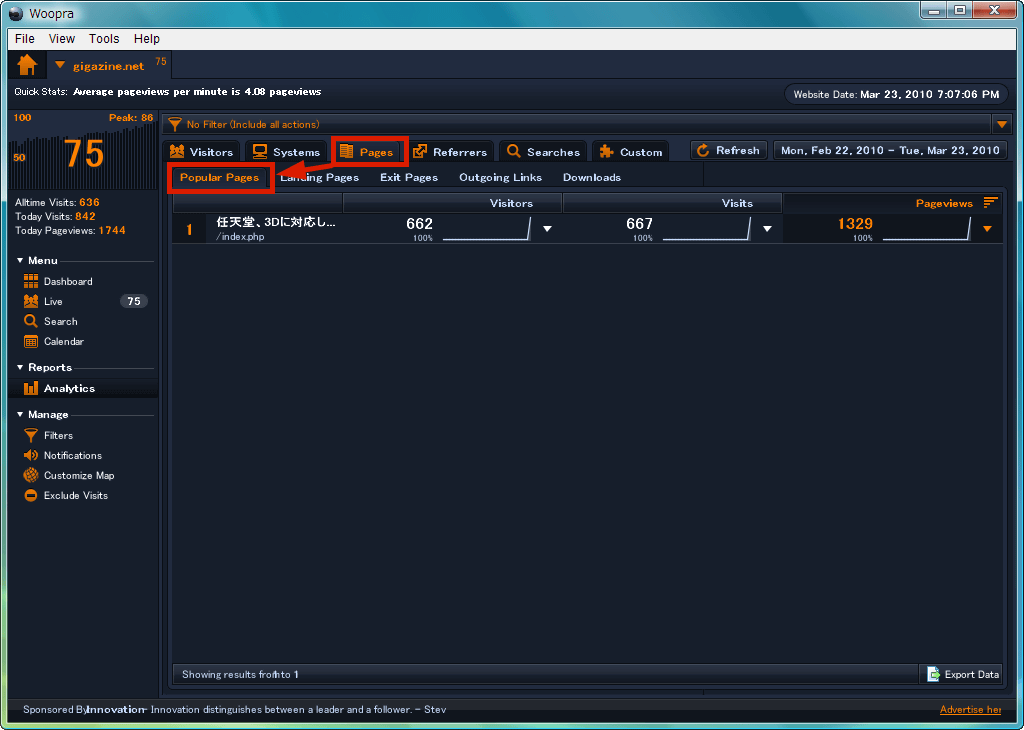
Since "Popular Pages" on the "Pages" tab is based on the title of the page being accessed, you can see which page you are currently hitting.
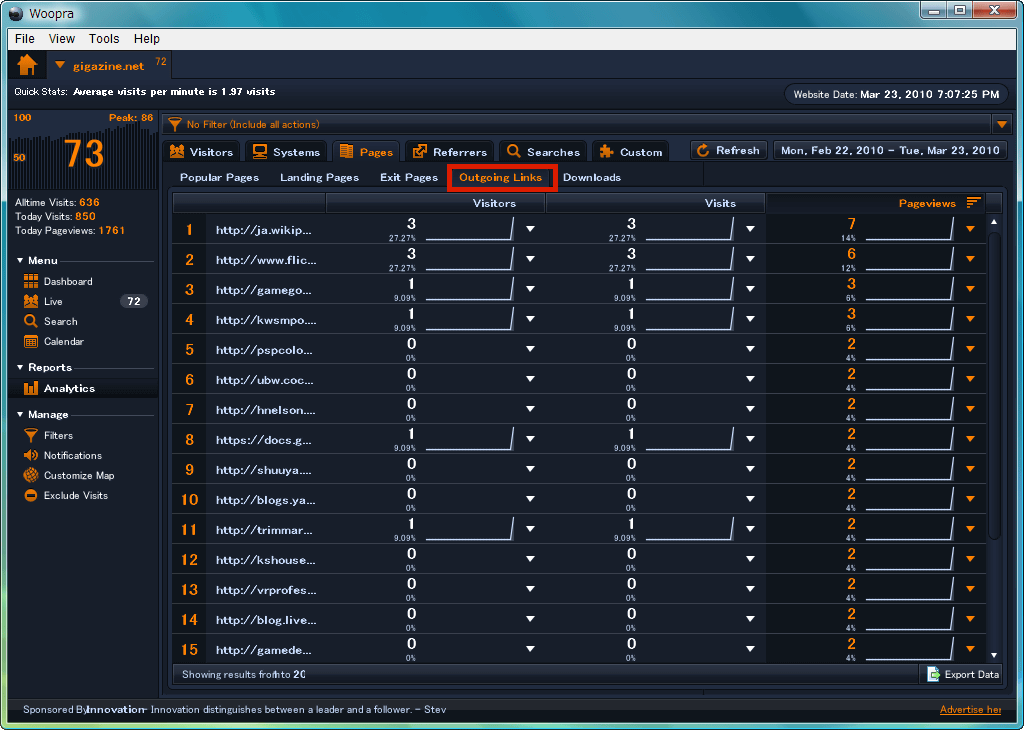
"Outgoing Links" link outside the site
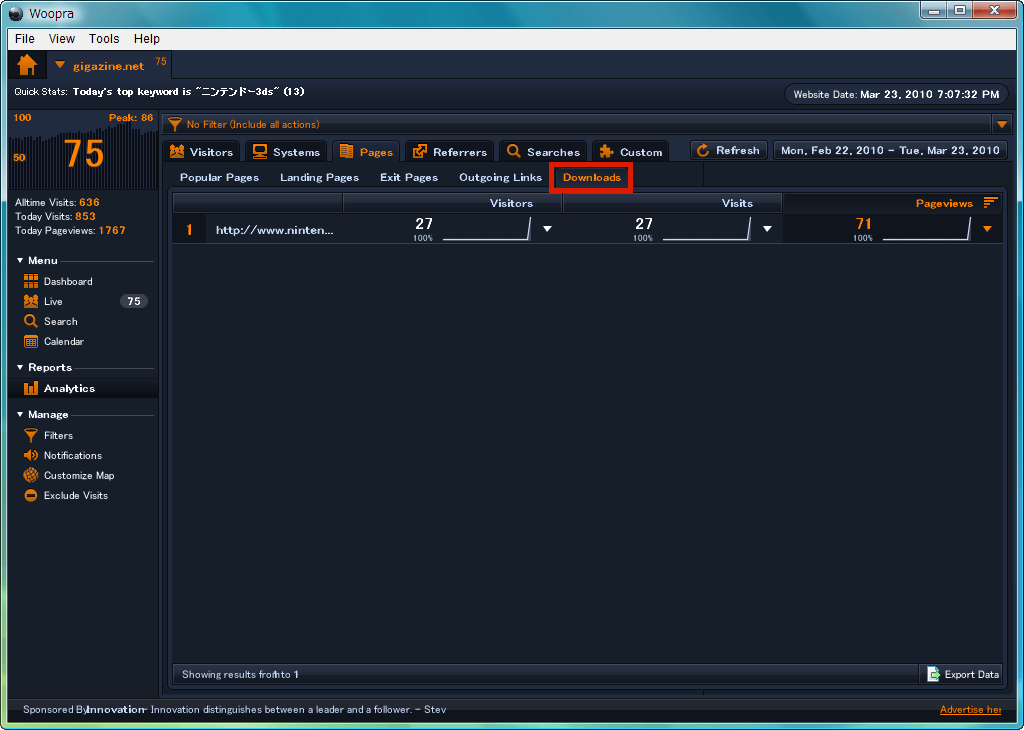
"Downloads" is the number of downloads of downloadable files linked from the page.
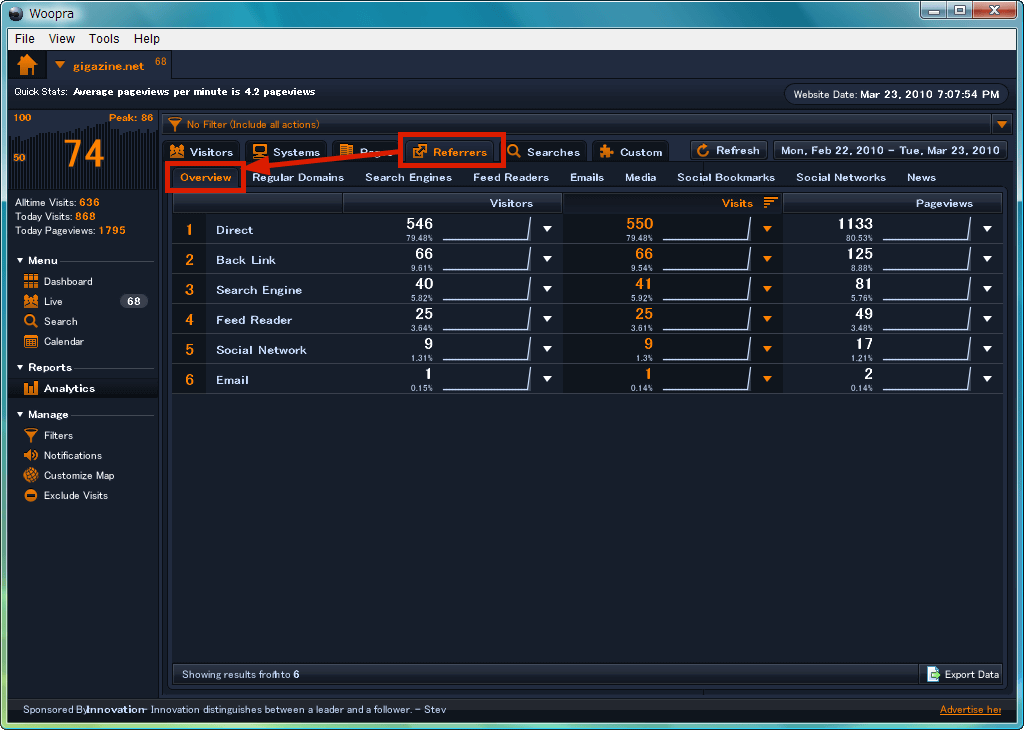
The "Referers" tab is mainly the item of the referrer as the link source, and "Overview" shows the summary of the referrer.
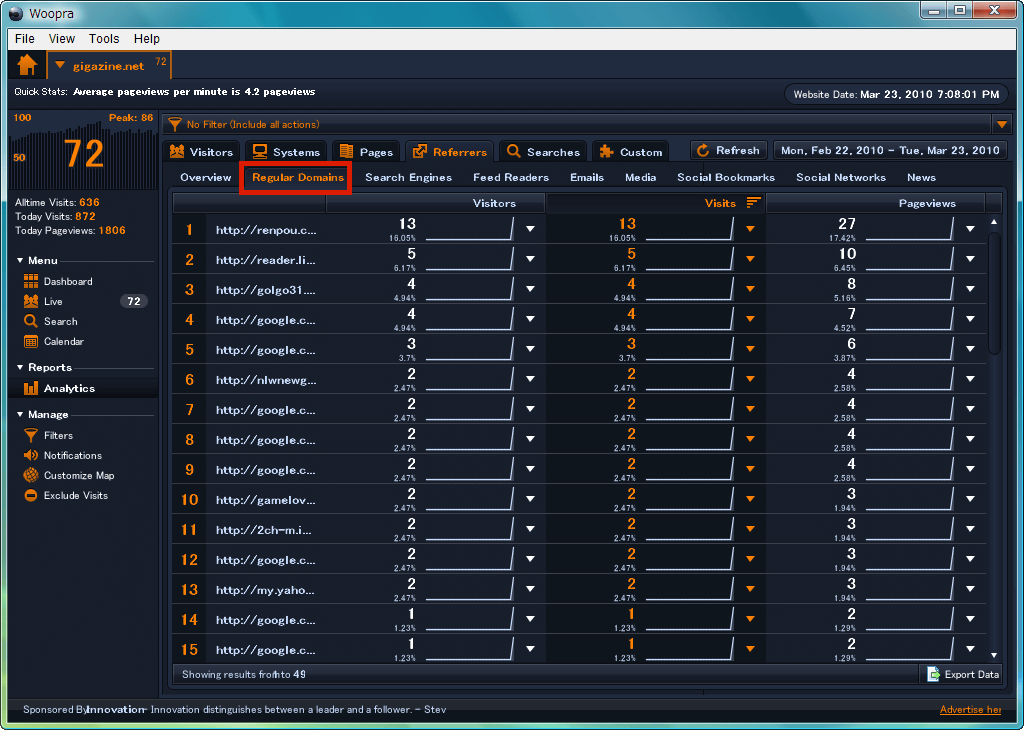
"Regular Domains" is a referer divided into pages of domains. You can see from which page of which site many people are linked and people are coming.
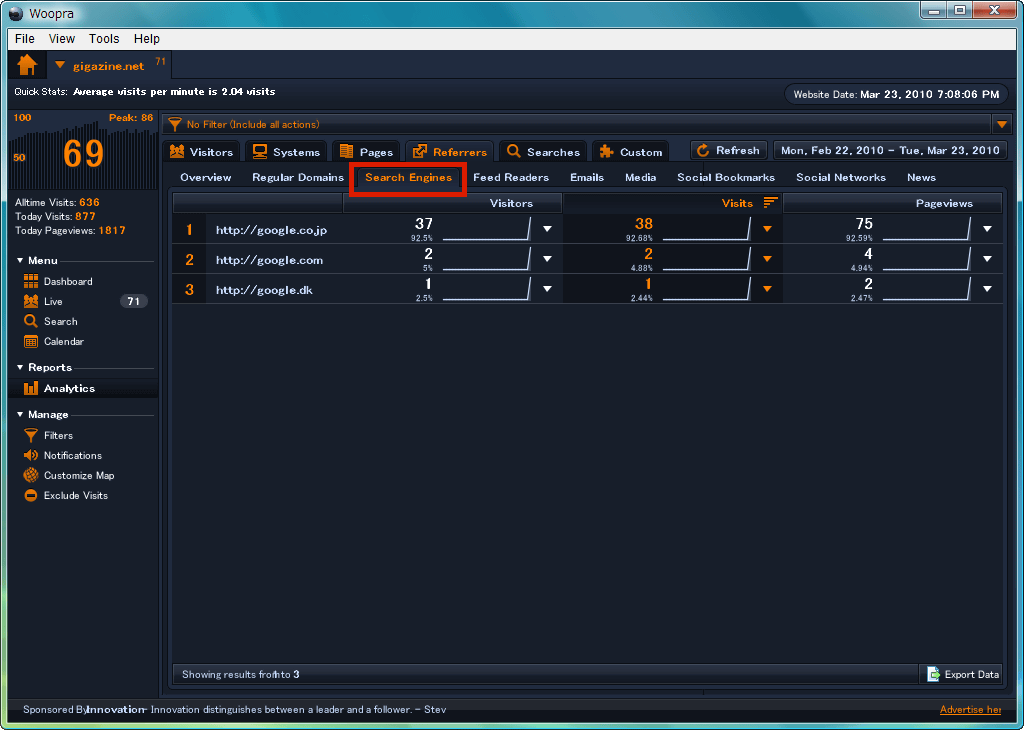
"Search Engines" is Google and Yahoo! Ranking via search engines such as
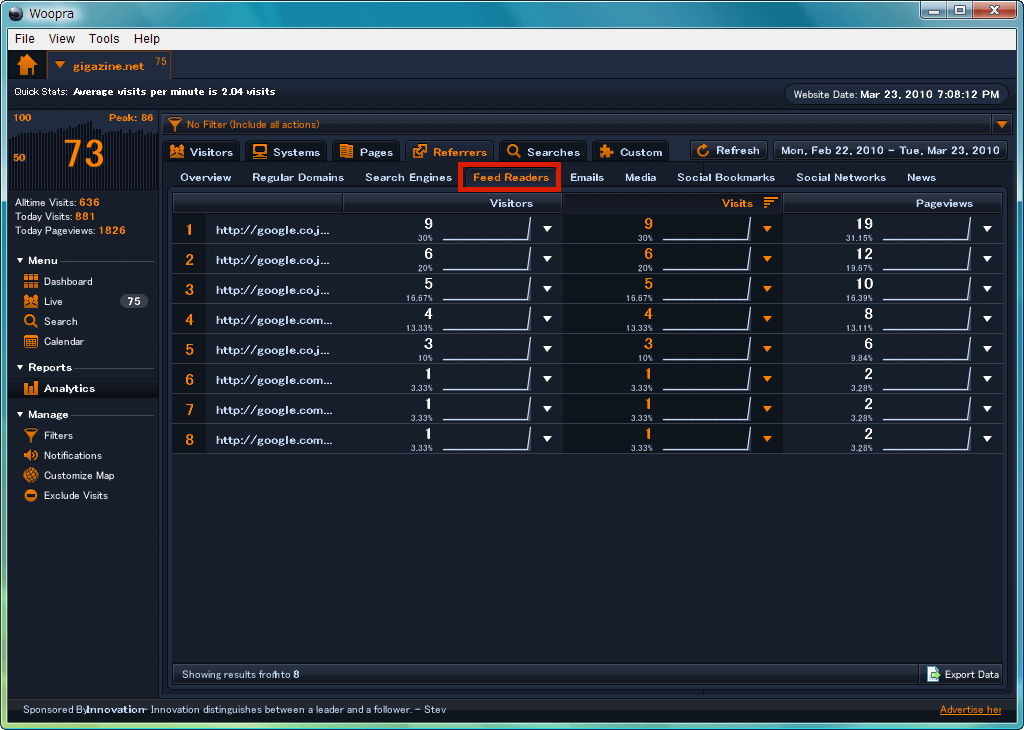
"Feed Readers" is accessed via so-called RSS reader
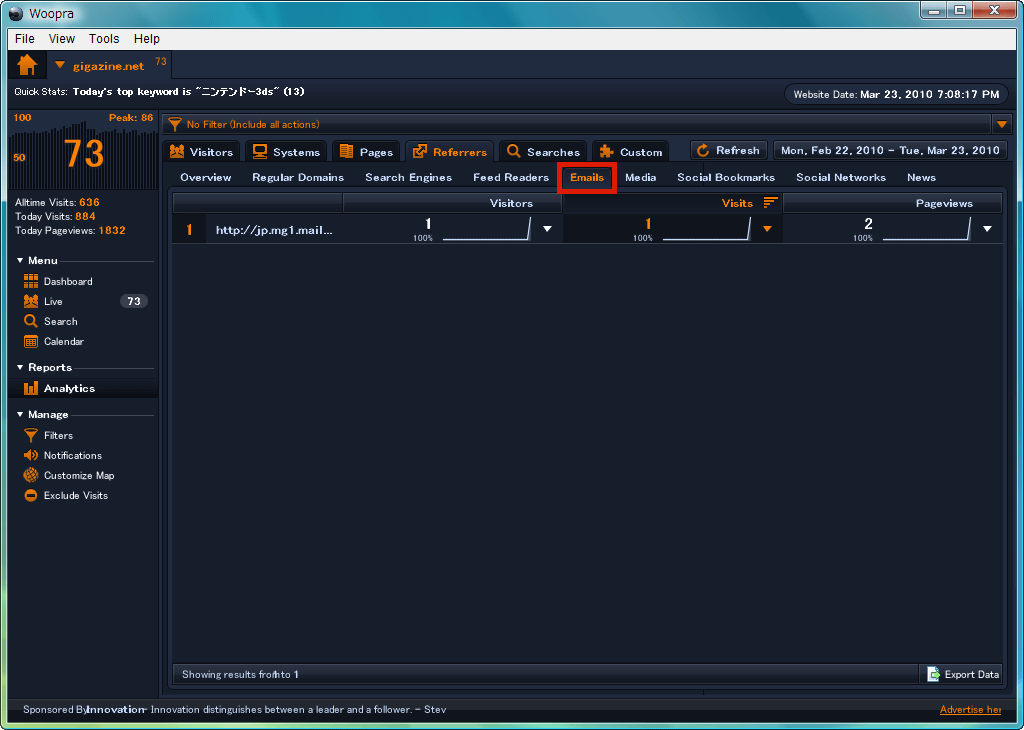
"Emails" when accessed from web mail access
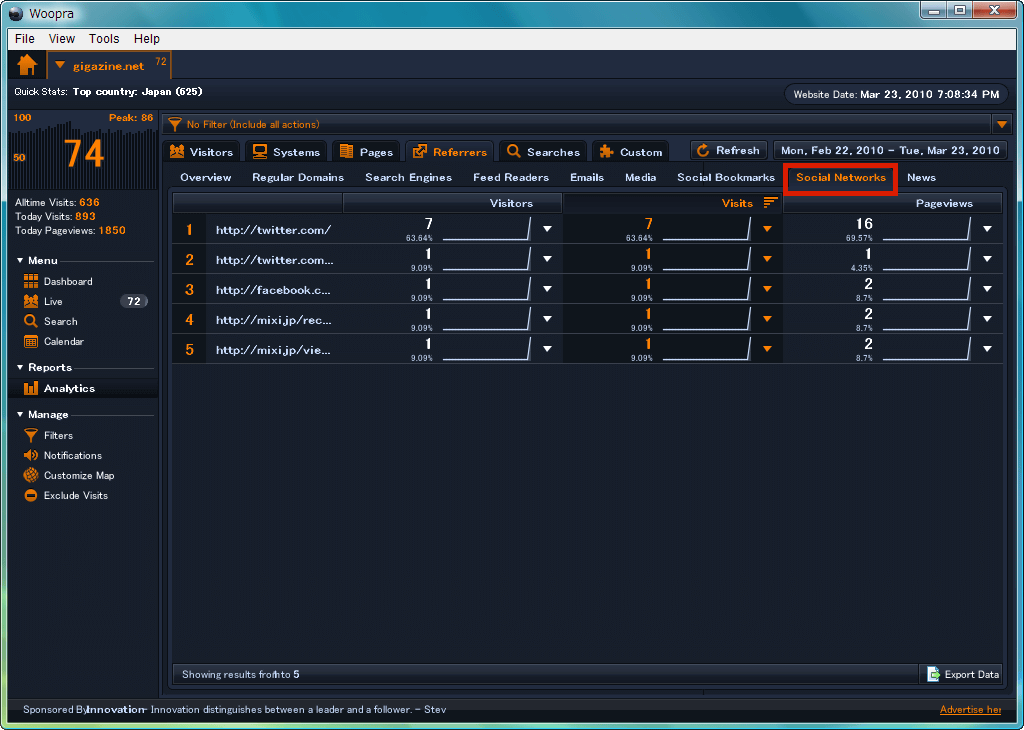
"Social Networks" is the result of analysis when linked via mixi or Twitter
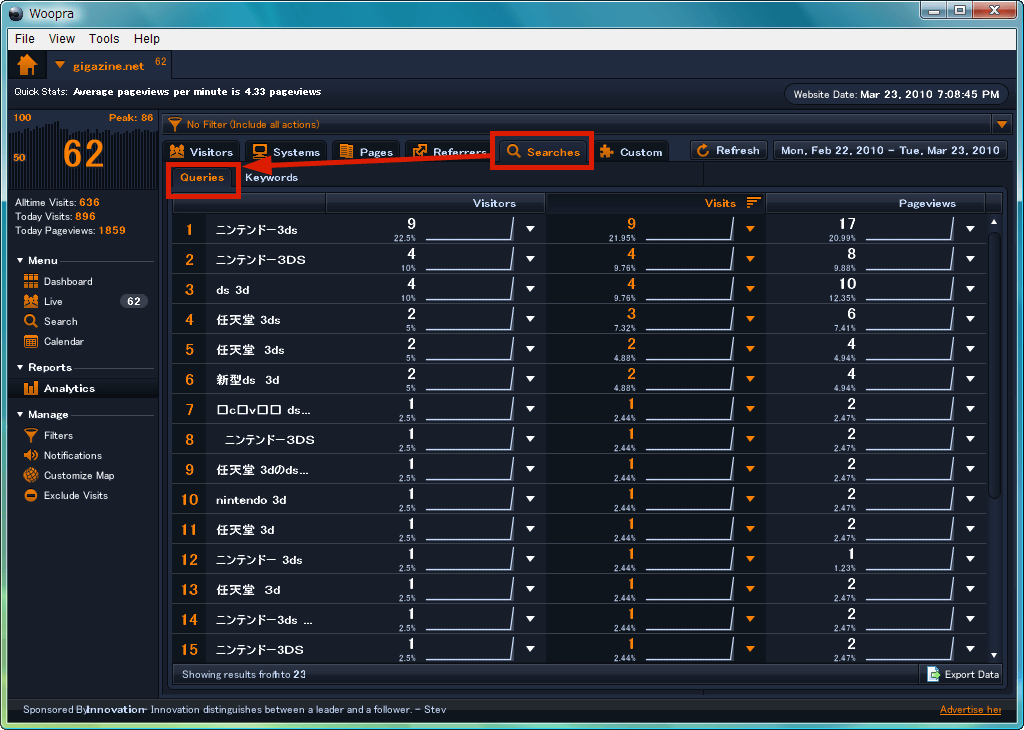
Access via search engine can also be seen in detail by each phrase or keyword, and it is possible from "Queries" and "Keywords" on "Searches" tab.
◆ How to make a custom filter
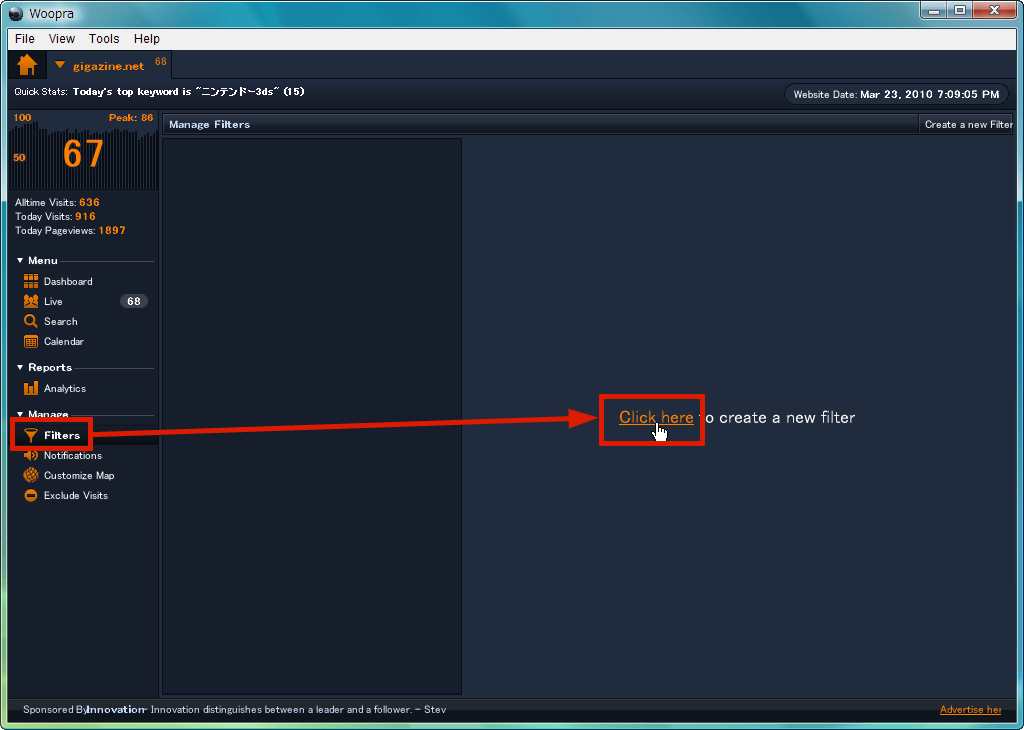
If you are using Quick Filter, you probably will want to save this condition. In that case, click "Click here" from "Filters".
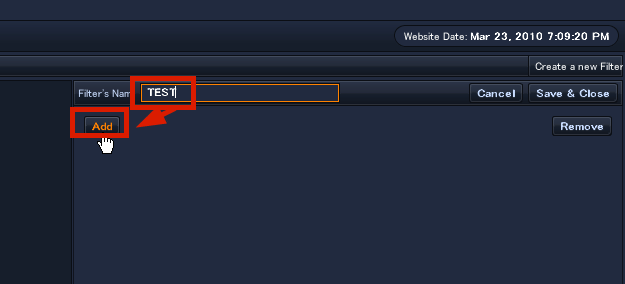
Decide the filter name appropriately, enter it, click "Add" button
Set the type of refinement. Basically all conditions are complete.

Also decide whether to match the type, whether it is equal to or less than the numerical value, etc.

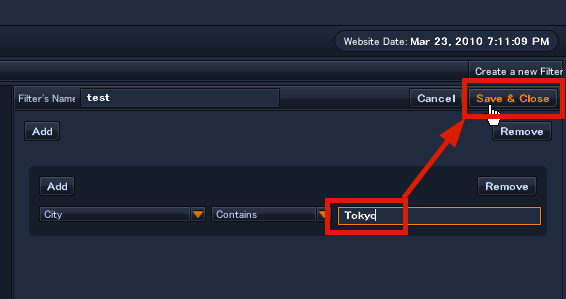
For example, if the type is set to "City" as the city name, the condition is set to "Contains" to be "Include", and to "Tokyo", the custom filter having the content "if the user who is accessing is from Tokyo" Become. When you are done, click "Save & Close" and save.
Next, select "Search" in the menu, select the custom filter name created earlier from the filter list above and click "Search", the users matching the conditions are narrowed down and displayed.
◆ How to notify by popup window or sound when a user with specific conditions comes
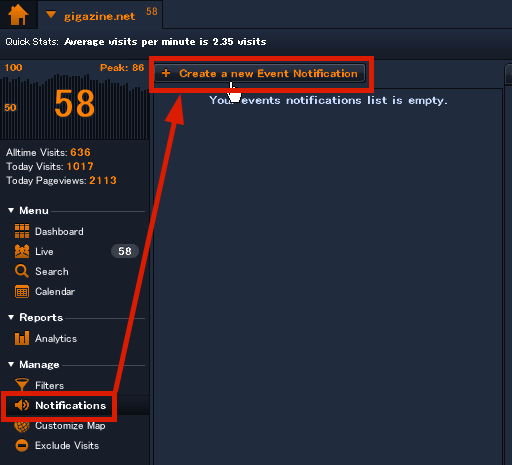
Click "Create a new Event Notification" from the menu "Notifications". In short, it notifies you when something happens.
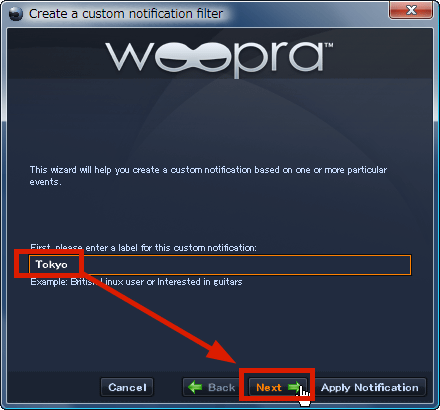
Give an easy-to-understand event name and click "Next". This time I will make an event saying that people in Tokyo will notify by pop-up window and sound, so I made the name "Tokyo" in an easy-to-understand way.
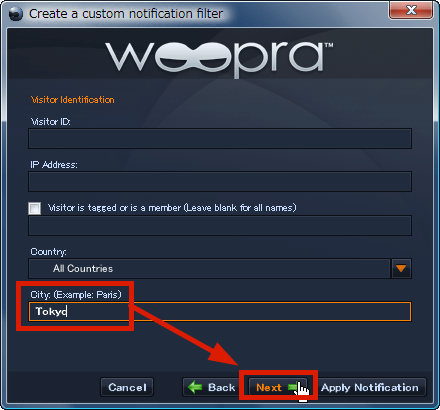
"Visitor ID" is the ID of each user (the pattern assigned by cookie), "IP Address" is the IP address, "Country" is the country name, "City" is the city name. This time it is all people from Tokyo, so enter "Tokyo" in "City" and click "Next". In addition, "Visitor is tagged or is a member" means that you can narrow down with the tag that you can trace from "Live" of the menu and give it to the user who wants to stalk.
"Page URL Contains" is the address of the page, "Page Title Contains" is the page title name, "Visitor downloading a file" is the name of the downloaded file, "Visitor clicks on an external link" is the address of the external link, "Referer URL Contains "is the address of the linking page. Since there is no relation at all this time, click "Next" with all the blanks left.

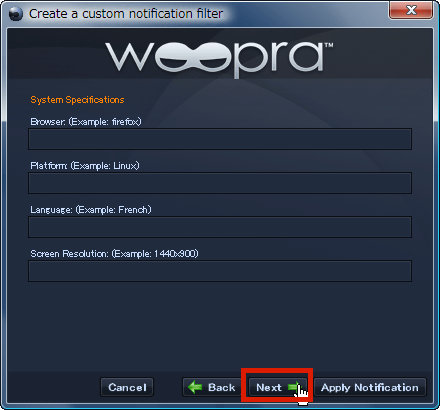
"Browser" is the browser name, "Platform" is the OS type, "Language" is the language name, and "Screen Resolution" is the screen resolution. Since there is no relation at all this time, click "Next" with all the blanks left.
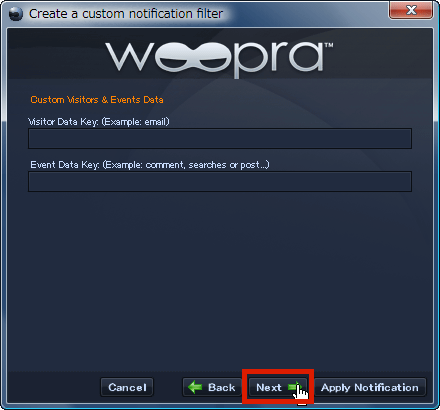
"Visitor Data Key" is the visitor data key, and "Event Data Key" is the event data key. To tell the truth, Woopra is actually able to cooperate not only with the website, but also with the desktop application, the mobile application, and the e-commerce platform,Woopra JavaScript"Tracking code is prepared. If you use them, it is possible for someone to purchase it, for example, on internet shopping, or trigger a user registration. I will not do anything complicated so far this time, so please leave the whole blank and click "Next".
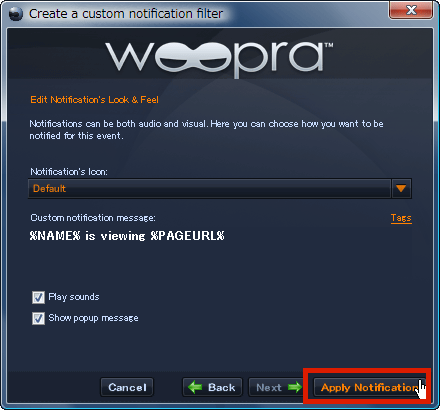
Finally, decide the notification method. "Notification's Icon" is a notification icon, "Custom notification message" is a message displayed when notifying, you can customize the message by embedding arbitrary tag by clicking "Tags". For example, "& PAGEURL%" will replace the address of the page you are looking at. In addition, if you check "Play sounds", you hear a sound when you notice, and if you check the "Show popup message", a popup window will be displayed on notification. Click "Apply Notification" when you are finished.
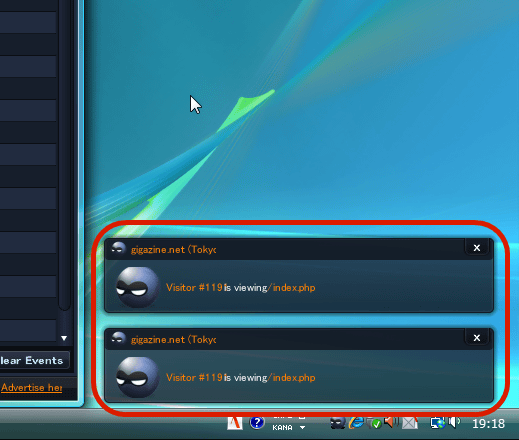
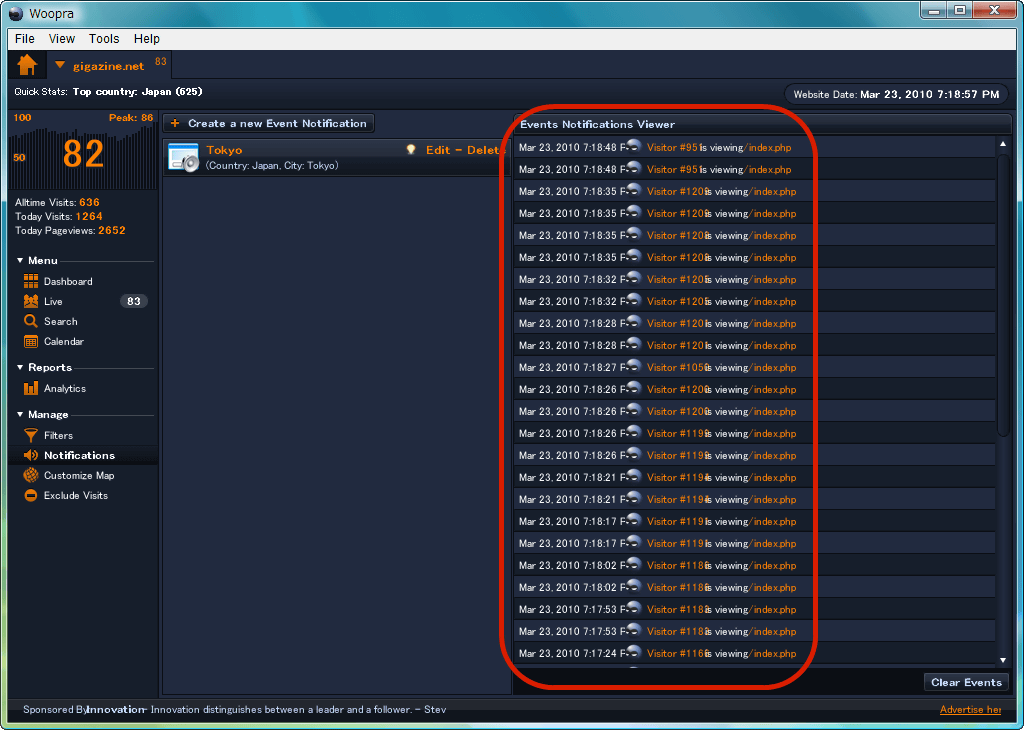
When an event occurs, it is displayed like this. I made this movie at the top of this article as well.
Events are recorded in this way in this way, and clicking "Clear Events" in the lower right will reset the recording.
◆ Other access analysis settings
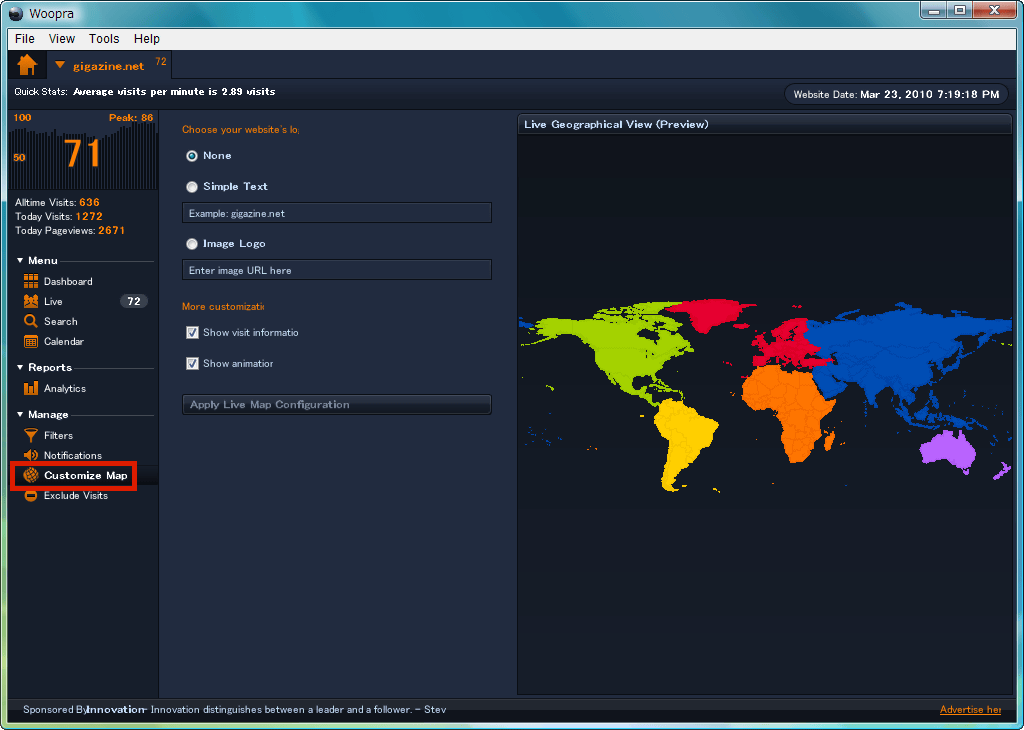
To customize the map, select "Customize Map" from the menu. You can set the location and text of the website, the image logo, whether or not to show users, whether animated.
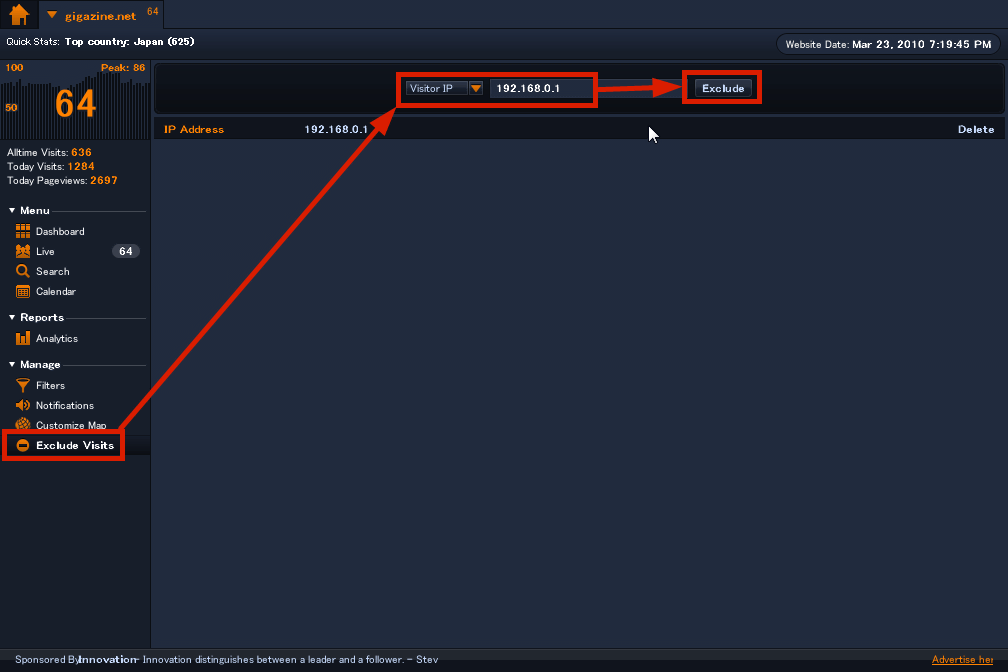
For example, if you do not want to include yourself in access analysis, such as a specific IP address, select "Exclude Visits" in the menu, fill in the required items and click "Exclude". As it is recorded and displayed every time you view the page by yourself, there is no point in real-time access analysis, so we recommend that you register it.
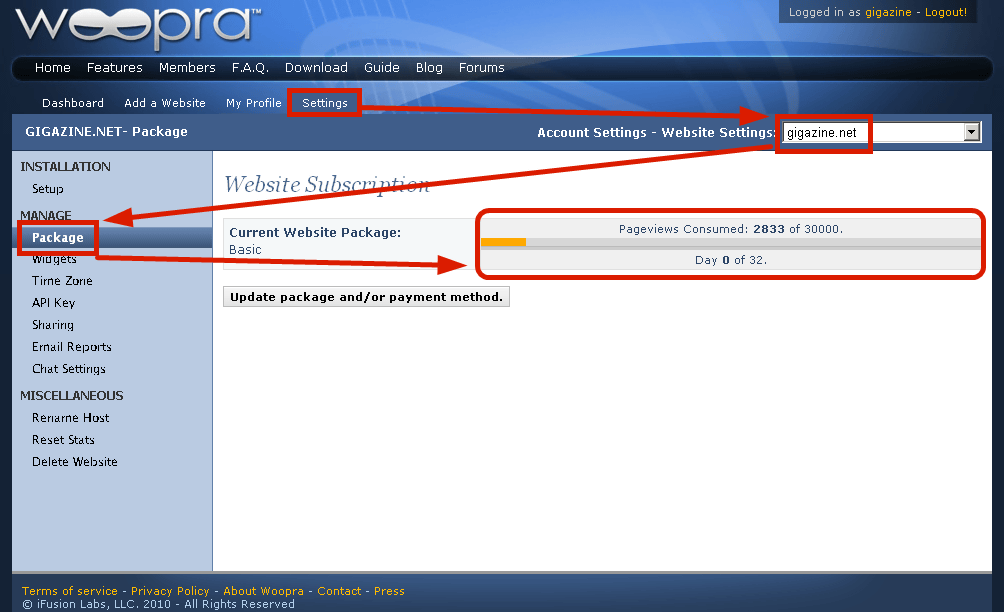
In addition, login to Woopra's website, select the registered site name from "Settings", and select "Package", you can see the page view up to the present time. If it is a free version, real-time access analysis is possible up to 30,000 page views in one month (it seems to be 32 days) and will not work if it reaches 30,000.
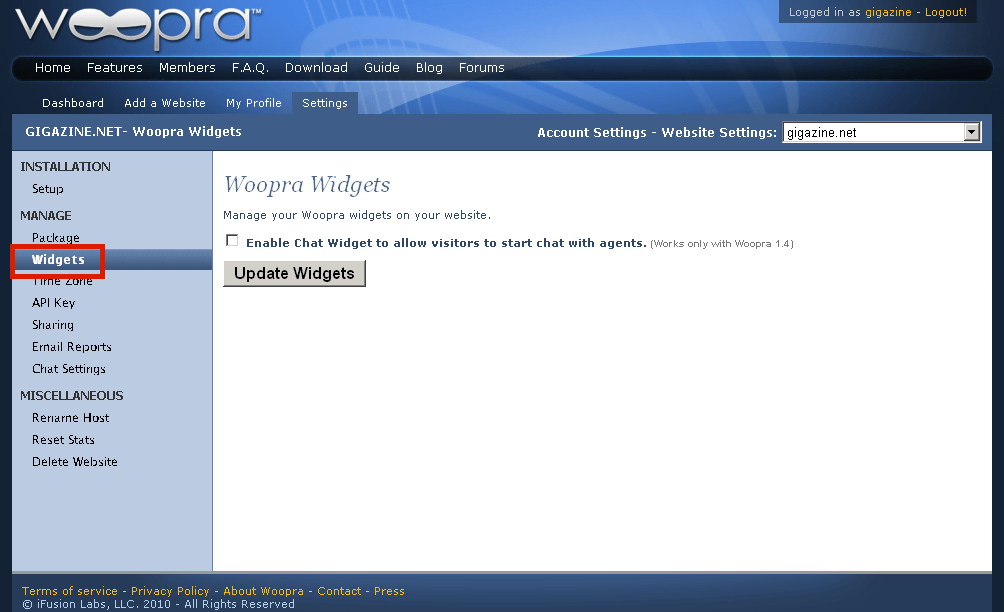
Also, it is possible to chat with the person who came to see the page. By selecting "Widgets" and checking and clicking the button, it becomes possible to talk directly to the person who is visiting the page I will.
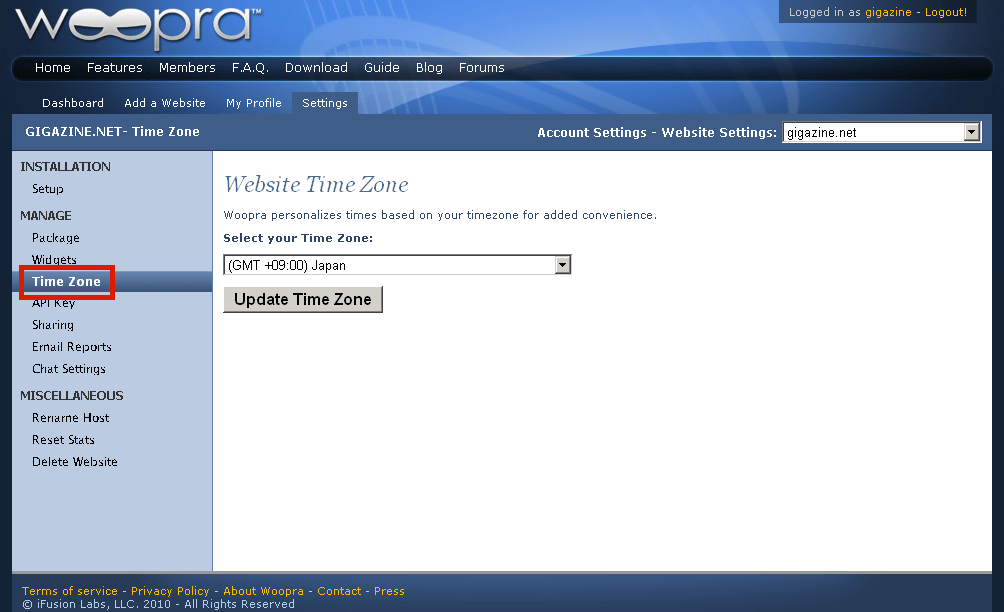
"Time Zone" is the time zone setting.
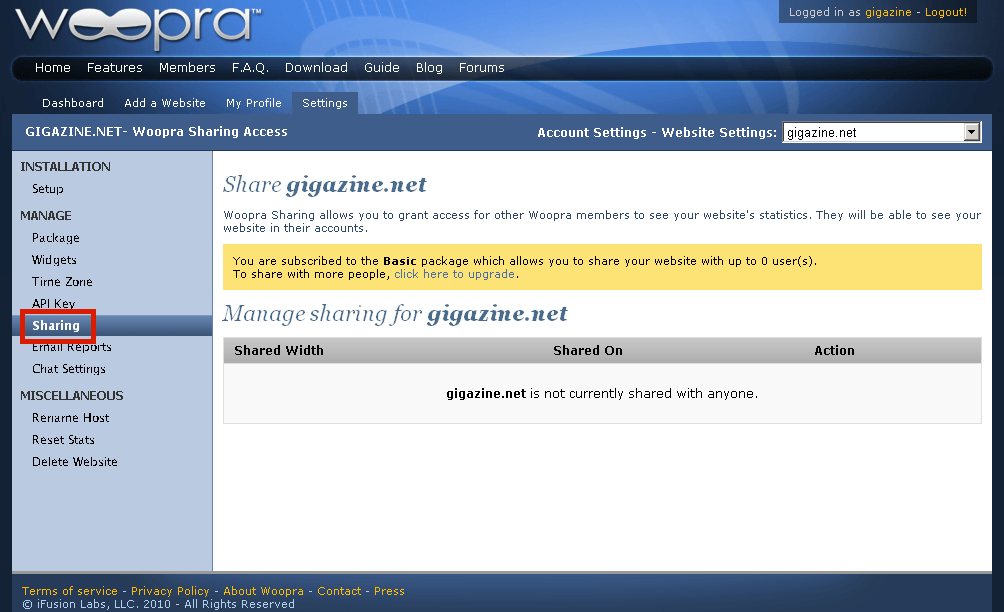
It does not work with the free version, is it a credit card?PaypalYou can use the "Sharing" function if you have a paid version that you can use with, you can increase the number of users who can use real-time access analysis.
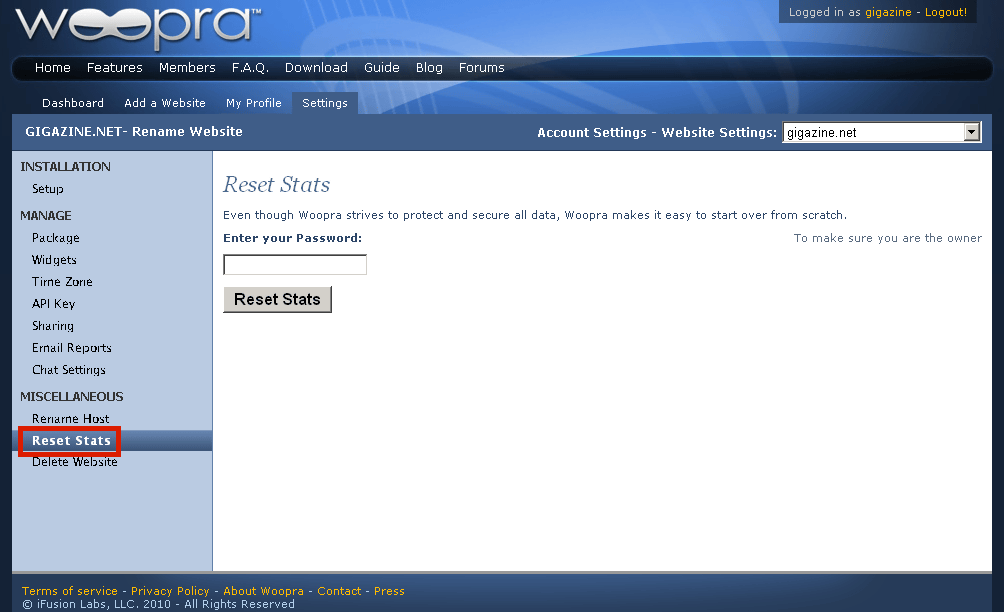
In addition, when applying to the site to be used for testing and publishing at the production site, you can reset to the initial state by selecting "Reset Stats" and entering the password at login.
By the way, not the application version of Woopra, but the web version of Woopra is like this.
This is also real-time access analysis, but it seems a little shabby ... ....
◆ Change appearance
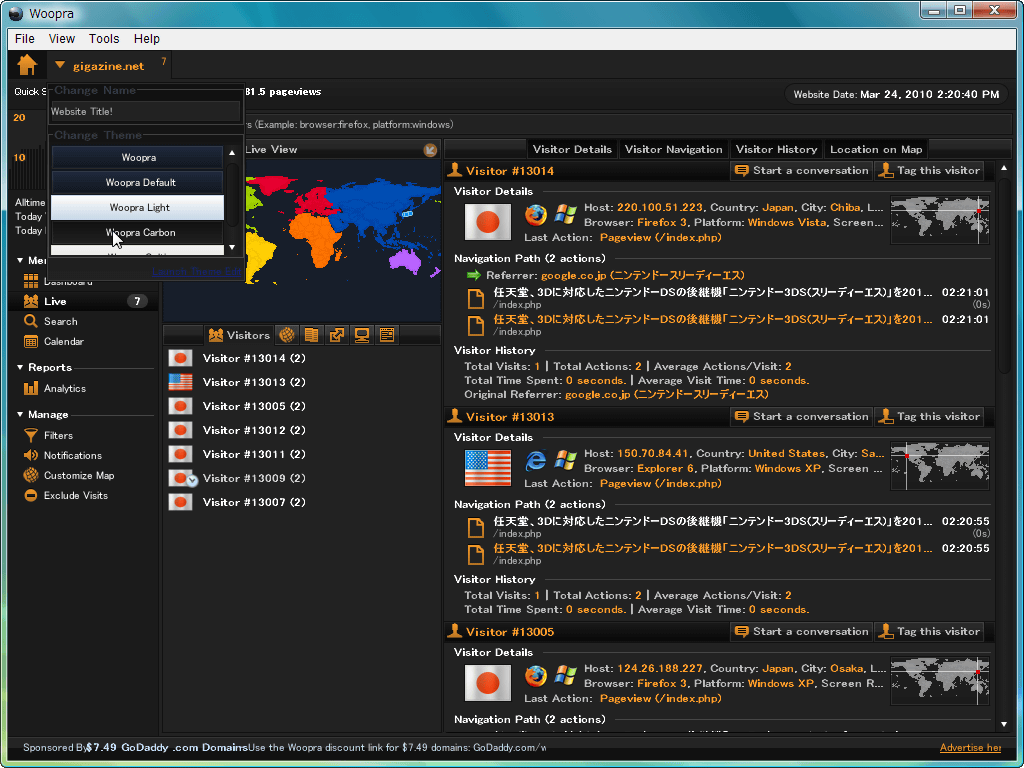
If Woopra's default coloring is difficult to see, you can change the coloring by changing the theme by clicking the "▼" button next to the site name.
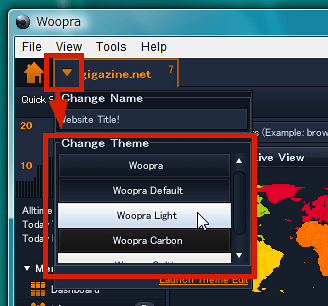
In the case of "Woopra Light"
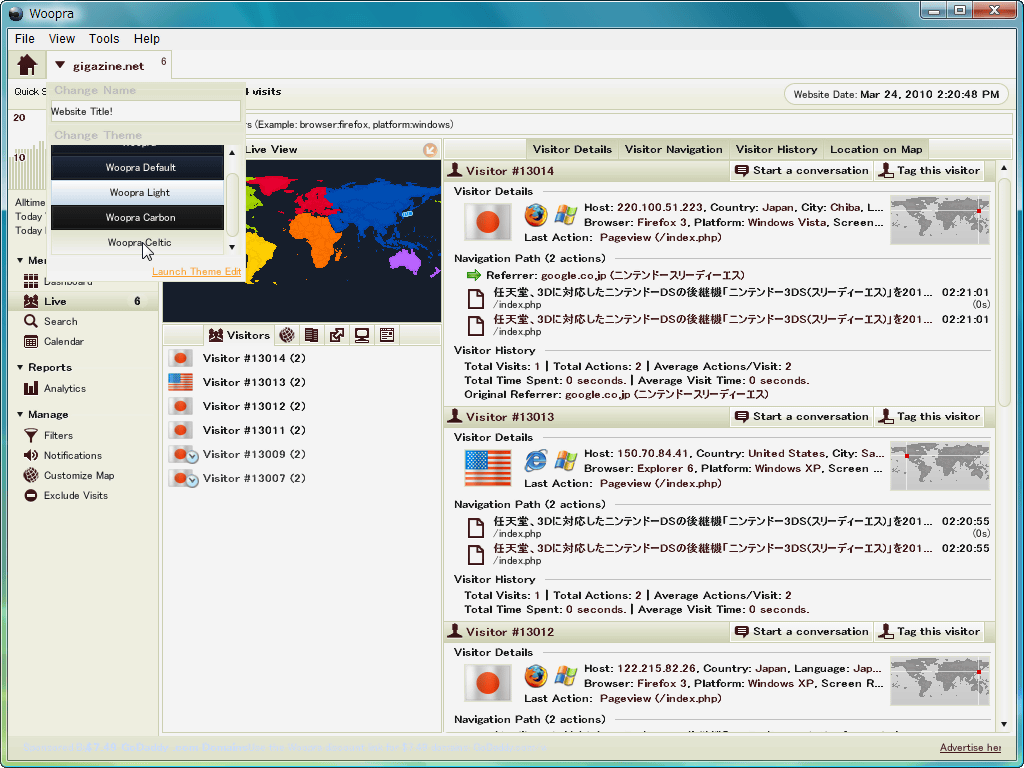
In the case of "Woopra Carbon"
In the case of "Woopra Celtic". You can create your favorite theme from "Launch Theme Edit" in the lower right, so you can make it more fancy.
Also, iPhone application release scheduled,Watch a demonstration movie on this pagecan do.
Besides thisInstallation guide pageaccording to,Plugin for WordPress,Plug-in for Joomla,For iWeb,Plug-in for Drupal, Etc., etc. are "Woopra API KeyYou can use it by registering it.Plug-in for jQueryThere is also.
Furthermore, it is not a built-in mapUse Google EarthDoing, such as e-mail magazinesCount access from emailIt is also possible to do.
The limitation of the free version is "Up to 30,000 page views per month", "Log retention period is three months" "Advertisement is displayed at the bottom of the status bar of Woopra's software" "We do not support SSL" "There is no segmentation function" "It can not be shared by multiple users"You can check the price of the paid version from this pageis. Payment is made by credit card or Paypal.
As a comment actually used, it is very interesting, especially the "Live" function that knows who is watching which page in real time, and the "Notification" function to notify when a user matching the set event comes Excellence. If we assume that Google Analytics is "to analyze afterwards", this Woopra can be distinguished by being positioned as "to respond flexibly", rather than to set it on every page I also felt that it might be quite powerful when combined with shopping carts, user registration, questionnaires and so on. Also, possibly Google Analytics may possibly incorporate these real-time access analysis functions, but as much as we have special software, Woopra is easier to use and easier to read It seems easy for everyone to understand.
2010/03/25 1:54 Addendum
As you can see from the plan on the above page, unfortunately it can not be used in the top plan even if it is GIGAZINE level access number, but if you read the site well, "Please contact me via email as there is an enterprise plan!" Thing. So as I wrote an e - mail promptly (as of March 23) I got a reply, the reply came. Each enterprise plan has its own stage, and in the case of the most basic enterprise plan "Basic", it can be used up to 45 million page views per month for 499 dollars (about 45,000 yen), Woopra API and e-mail full report It is accessible, it seems that the maximum number of users who can share is 50 and the data retention period is "unlimited".
Related Posts:


in Video, Software, Web Service, Review, Posted by darkhorse