"HttpWatch Basic Edition" that can debug HTTP communication status and discover bottlenecks
HTTP / HTTPS request header display, HTTP compression ratio display with free software running on Internet Explorer 6/7/8 Beta 2, Mozilla Firefox 2.0 / 3.0 / 3.1 Beta 2 on Windows XP / Vista / 2003/2008 Server , Charting the reading time of each element in the page, displaying the status code and response size, filtering, and recording these series of communication in the log file.
Since it is possible to display time in milliseconds and it is just a level that can be said to be an HTTP debugger, "I'd like to know the cause of slow page loading" or "Whether the server settings are properly reflected I want to check "" I want to check the operation of the web application "It is useful. It does not mean that it is impossible to interpret the Japanese character code which tends to be in this type of software.
Downloading and installing, actual usage etc. from the following.
HttpWatch: An HTTP Viewer and HTTP Sniffer for IE and Firefox
http://www.httpwatch.com/
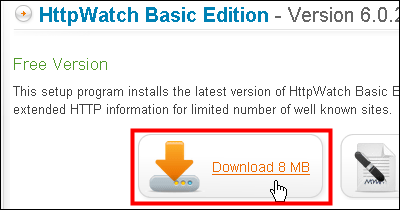
First of allThis pageVisit and click to download
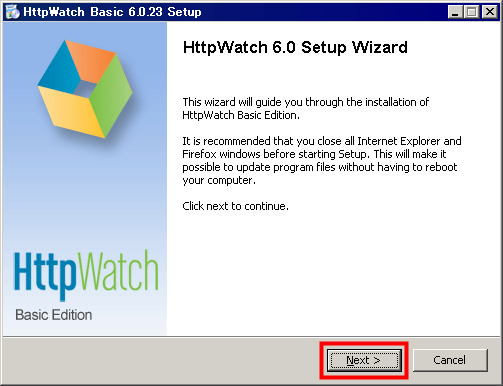
Click on it to start the installer

Click "Next"
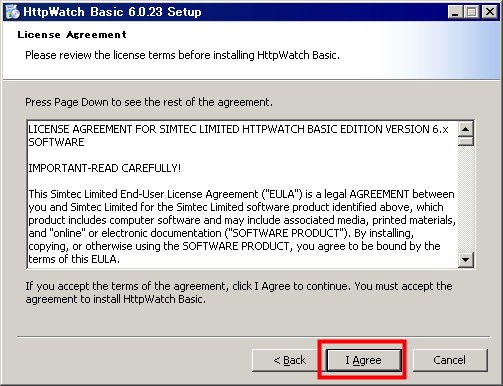
Click "I Agree"
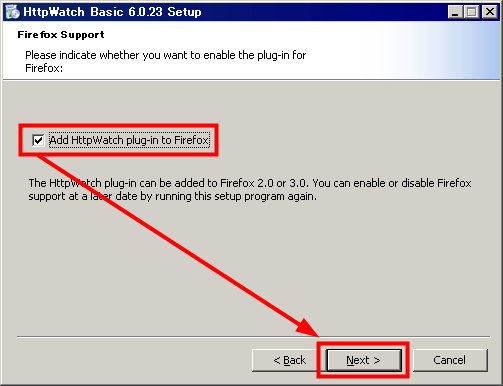
To install not only on IE but also on Firefox, put a check and click "Next"
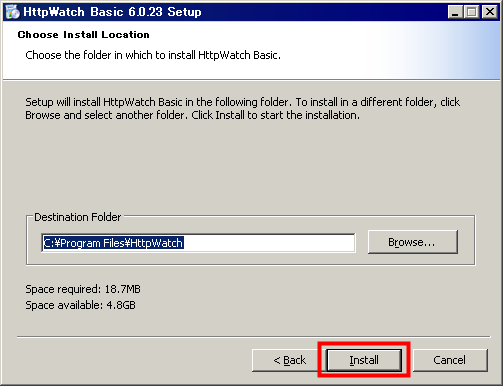
Click "Install"
Click "Finish" to complete

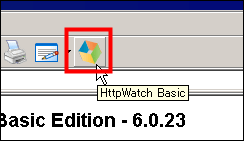
This time I will use it as IE. As these buttons are newly appearing in the toolbar, let's click on them.
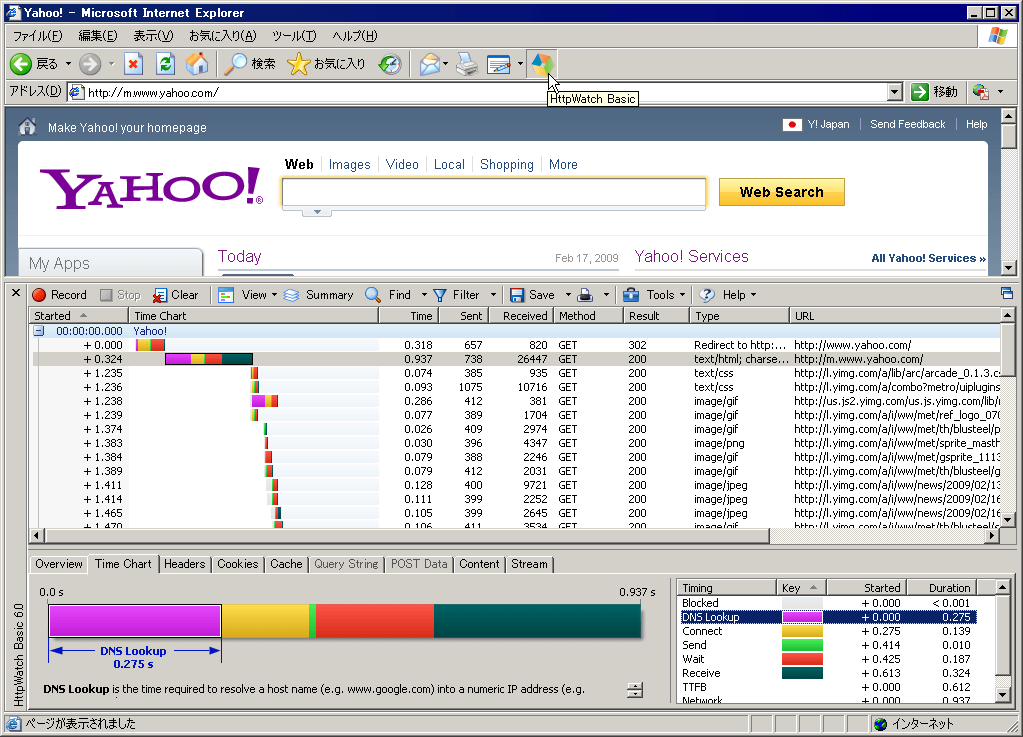
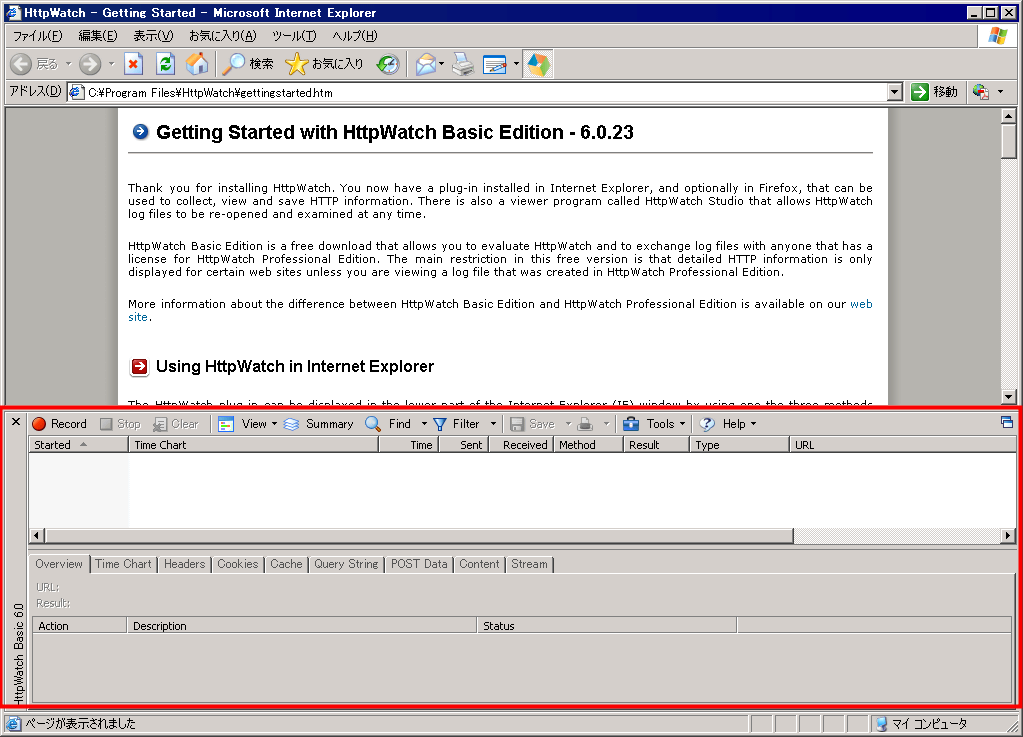
"HttpWatch Basic Edition" will be launched as an explorer bar
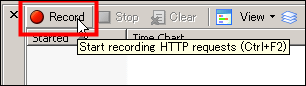
To analyze the communication status, click on "Record" and then read the page of the server you want to view the log of the communication status, read the page as usual, or perform the specific operation you want to measure OK.
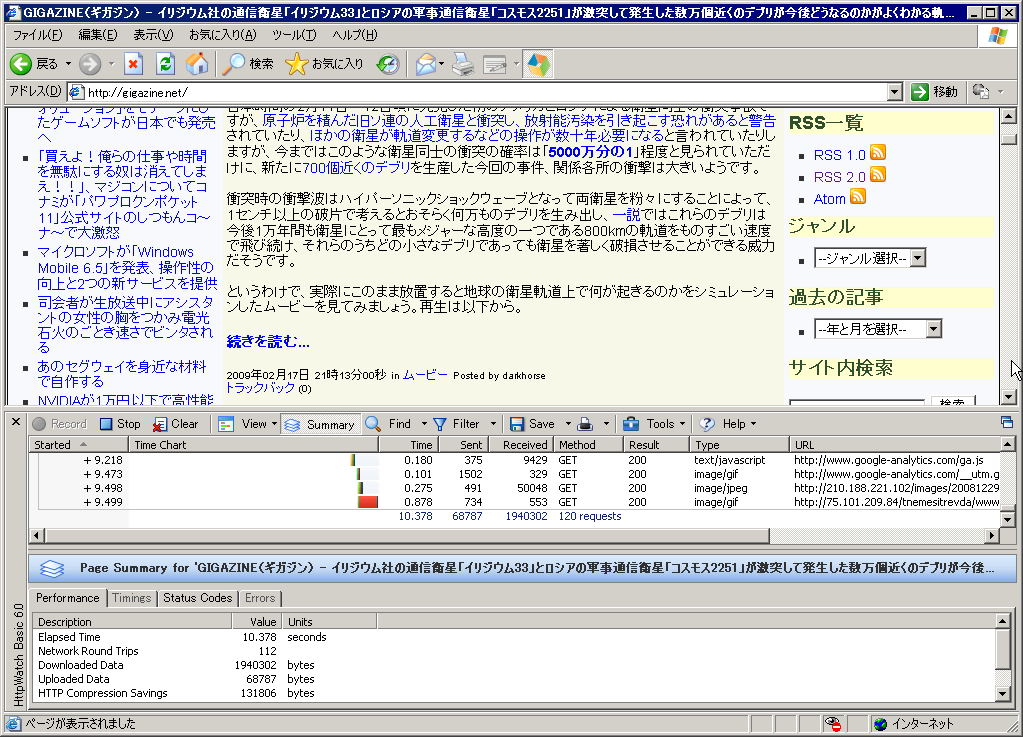
For example, I accessed the top page of GIGAZINE and it looked like this.
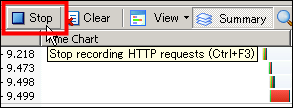
It is okay to keep watching pages one after the other like this, but as this will add extra logs, let's click "Stop" to stop.
The communication record can be saved as it is as a log file. Click "Save".
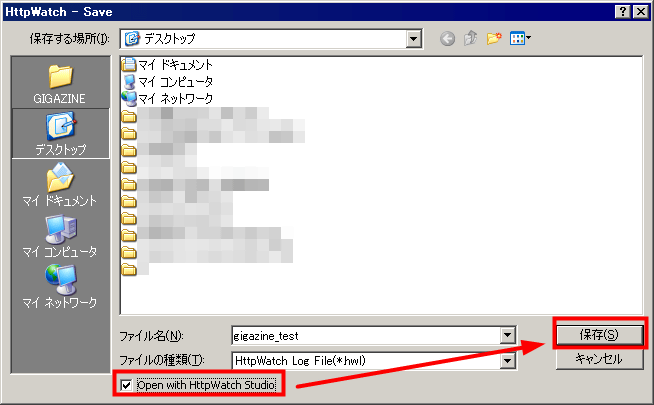
Analysis can be done as it is in the browser, but using "HttpWatch Studio" installed at the same time makes it easier to see the contents of the log file. Let's check and click the "save" button.
In this way, "HttpWatch Studio" starts up, it automatically reads the log file saved earlier, and it shapes it easily
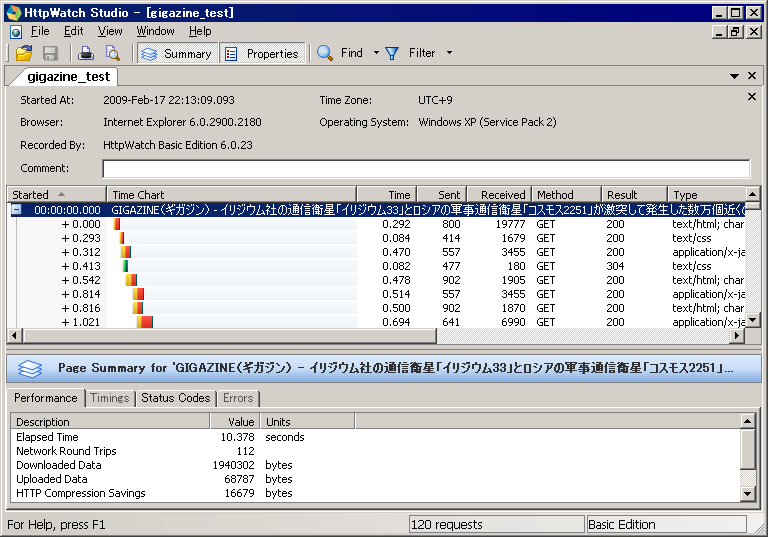
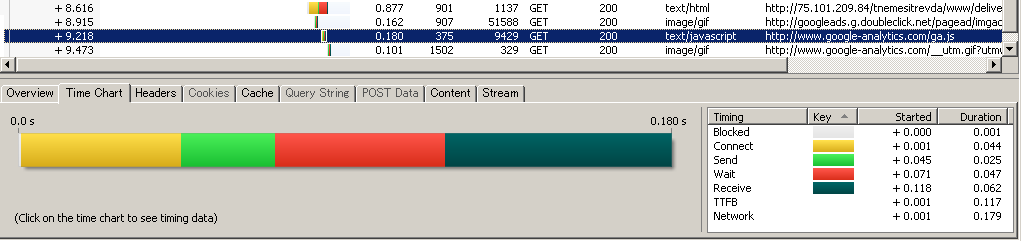
This "Time Chart" function is able to analyze not only what it took for each element but also what the bottleneck is. In the free version, only www.amazon.com, www.ebay.com, www.google.com, www.microsoft.com, www.slashdot.org, www.yahoo.com etc. are displayed, but it is really powerful.
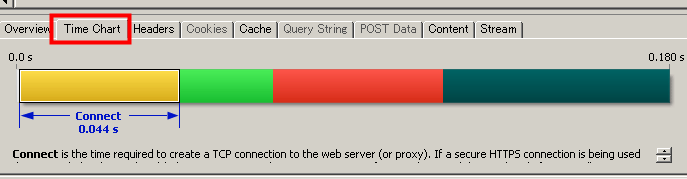
If you click in this way commentary will come out
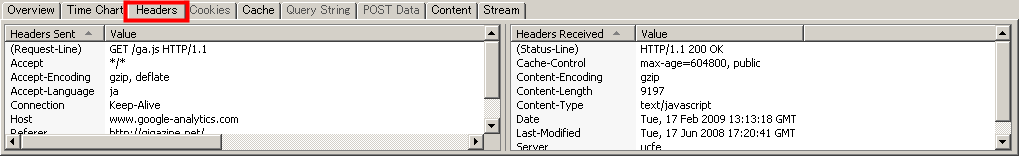
"Headers" is information in the header as it is. It is divided into transmission and reception, so it is easy to understand.
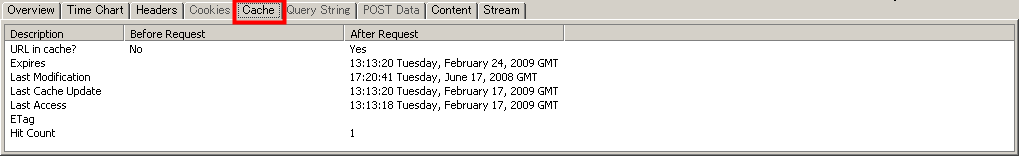
In addition to simply analyzing the log of communications, you can also see if you used the browser's cache.
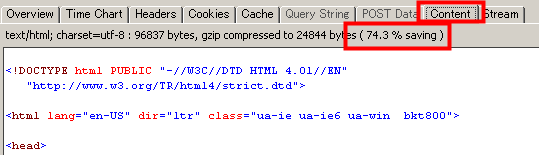
Furthermore, the content of each file can be checked from "Content", and if it is an image file, the image will be displayed.
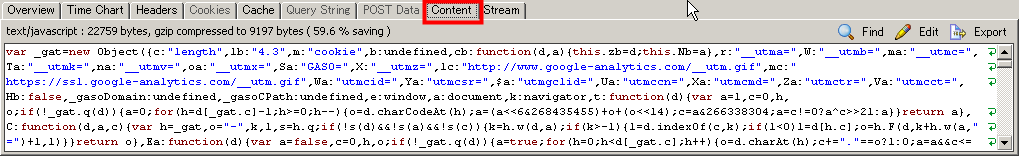
The compression ratio is also written
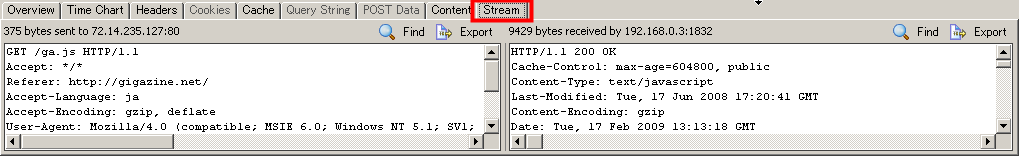
"Stream" can confirm the RAW data as its name
You can also separate it as an independent window by clicking the button on the upper right

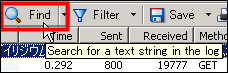
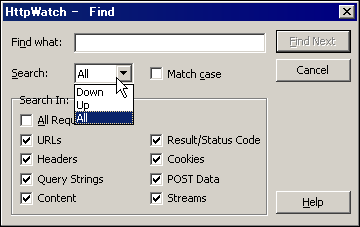
Search function is also powerful, you can use "Find" by clicking
In this way it is possible to search on quite detailed conditions
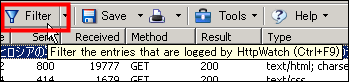
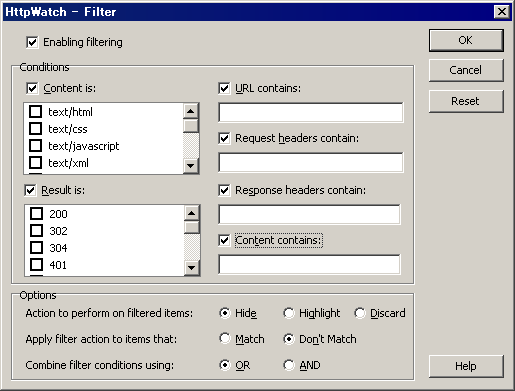
Since the read communication data is displayed as it is in real time, filtering is possible by using "Filter".
You can specify options like this
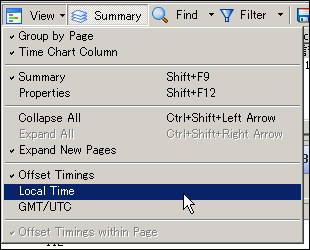
You can also use time other than the local time display
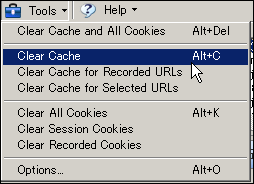
In addition, it is easy to erase and record cache and cookies, it's a button one shot
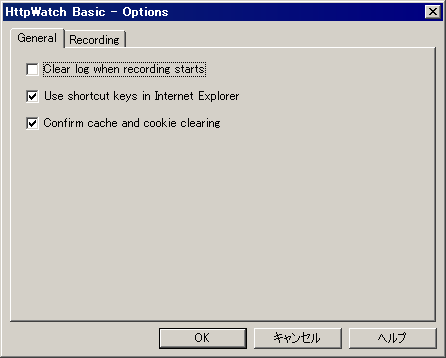
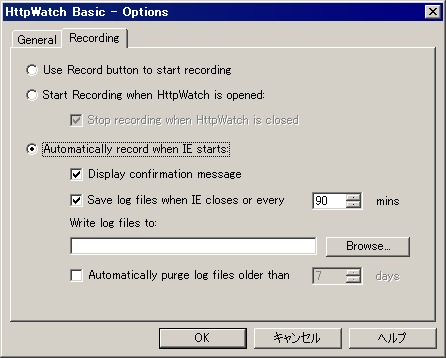
From the option, it clears the log after starting recording, uses the shortcut key in IE, and confirms when you clear the cache and cookie.
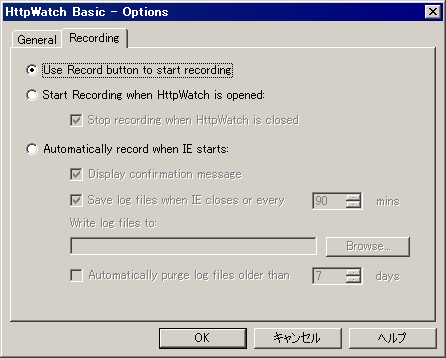
In addition to the method to start logging after pressing the button, it is also possible to record the log fully automatically
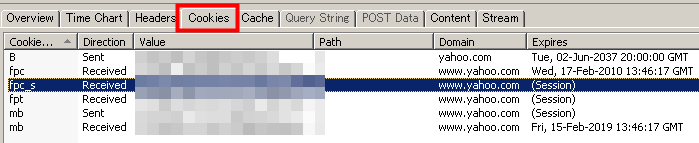
Since details of each cookie are displayed properly in relation to the domain etc., it is considerably convenient
It is also possible to record for 90 minutes until IE is closed, and nice thing that it divides files before the specified date and time by the specified capacity
In Firefox, click on this icon that appears in the lower right OK.
In addition, CSV output and function restrictions are removed and the full function is available "HttpWatch Professional EditionIs from $ 395 (about 36,000 yen), and as similar software runs on FirefoxFirebugYaLiveHTTPHeader, Operate with IEIeHTTPHeaders,Fiddler,WFetchthere is ........., ........., etc. It is best to use what you like.
Related Posts: