Intel's performance measurement tool ``PresentMon'' that can display GPU performance on the game screen in real time and supports third-party GPUs has been released, so I tried using it
On August 18, 2023, Intel
Intel® Arc™ Graphics - Present Mon
https://game.intel.com/story/intel-presentmon/
◆PresentMon installation procedure
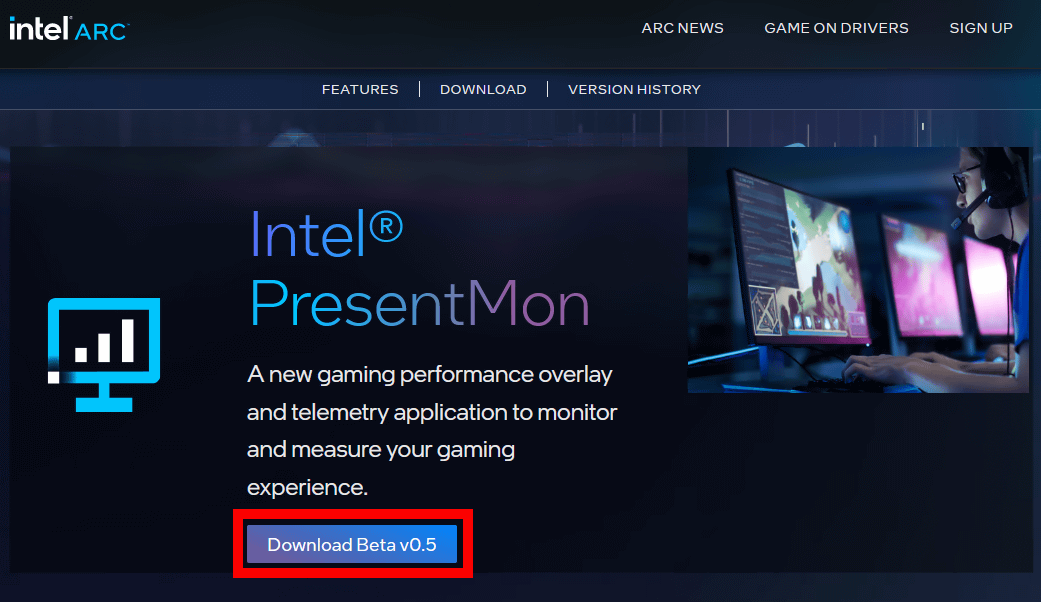
To install PresentMon, first download the installer by visiting the link above and clicking the blue download button. Although PresentMon is an Intel tool, it can also be used on PCs with GPUs other than Intel. This time, I will use it on a PC equipped with NVIDIA's 'GeForce RTX 3060'.
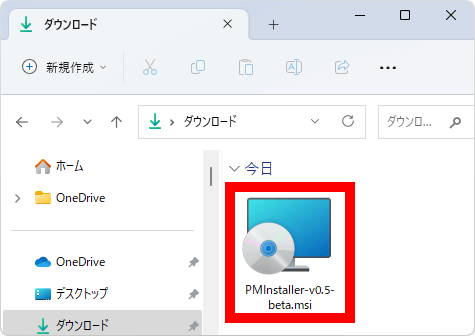
Once the installer is downloaded, double-click to run it.
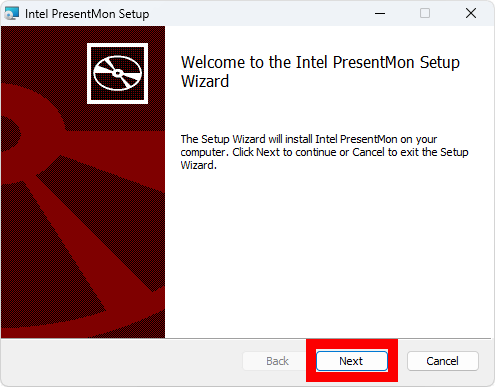
When the following screen is displayed, click 'Next'.
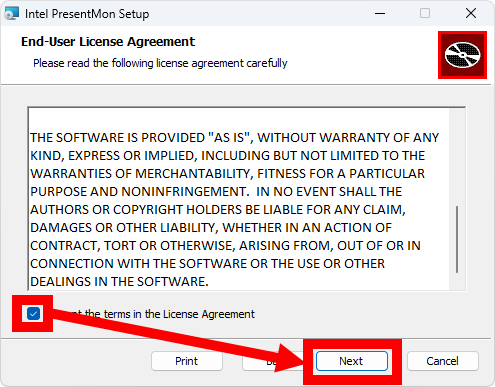
After calling the license well, check the agreement and click 'Next'.
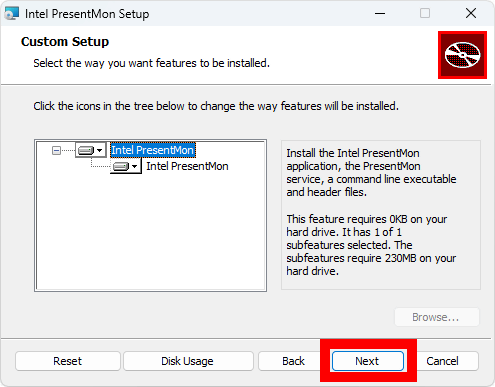
When the following screen is displayed, click 'Next' without changing anything.
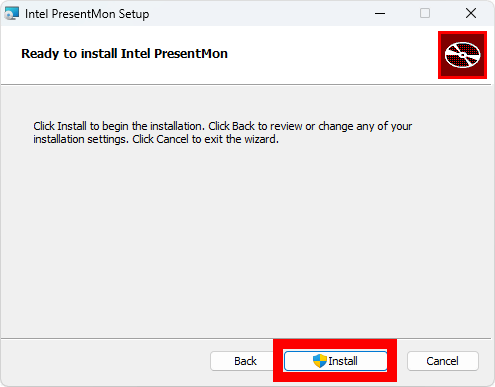
Click 'Install'.
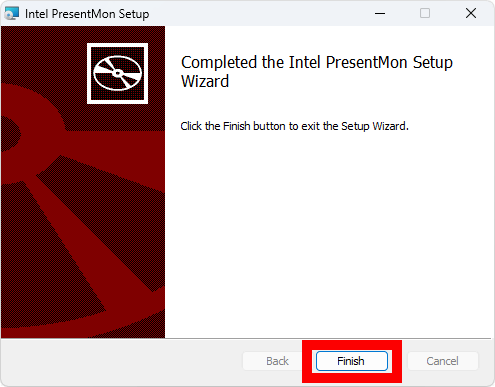
Click 'Finish' when the installation is completed.
◆ Procedure for measuring GPU performance with PresentMon
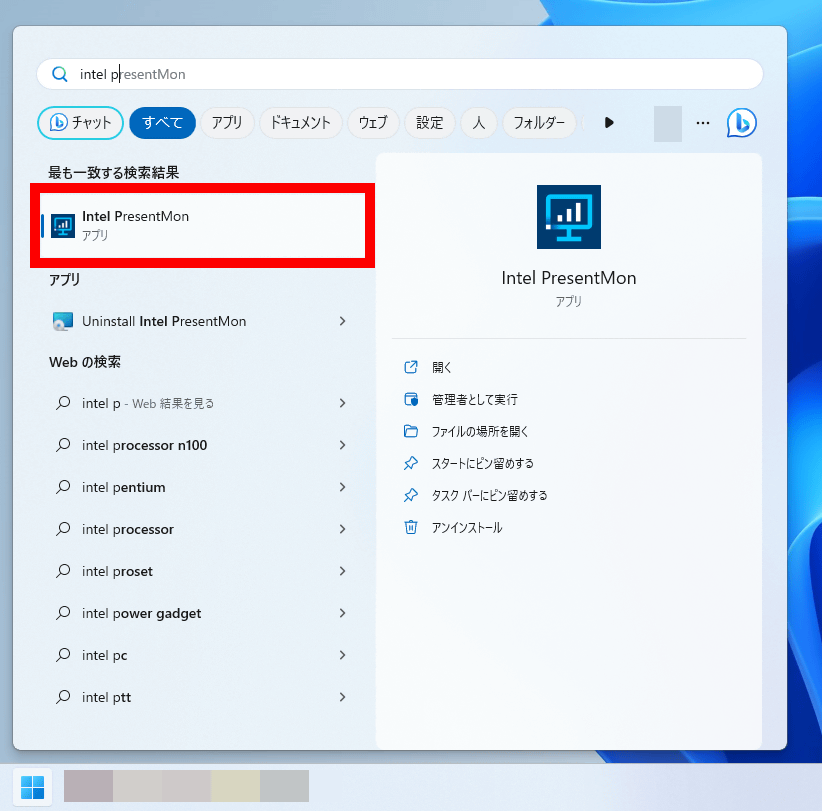
To measure GPU performance with PresentMon, search for PresentMon from the start menu and launch it.
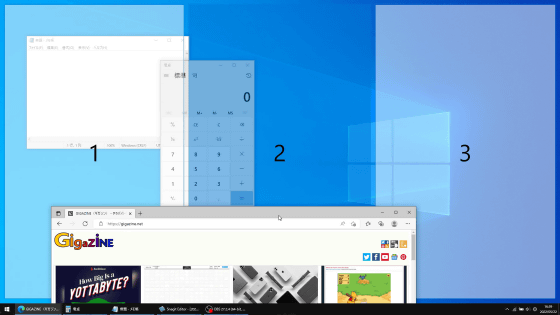
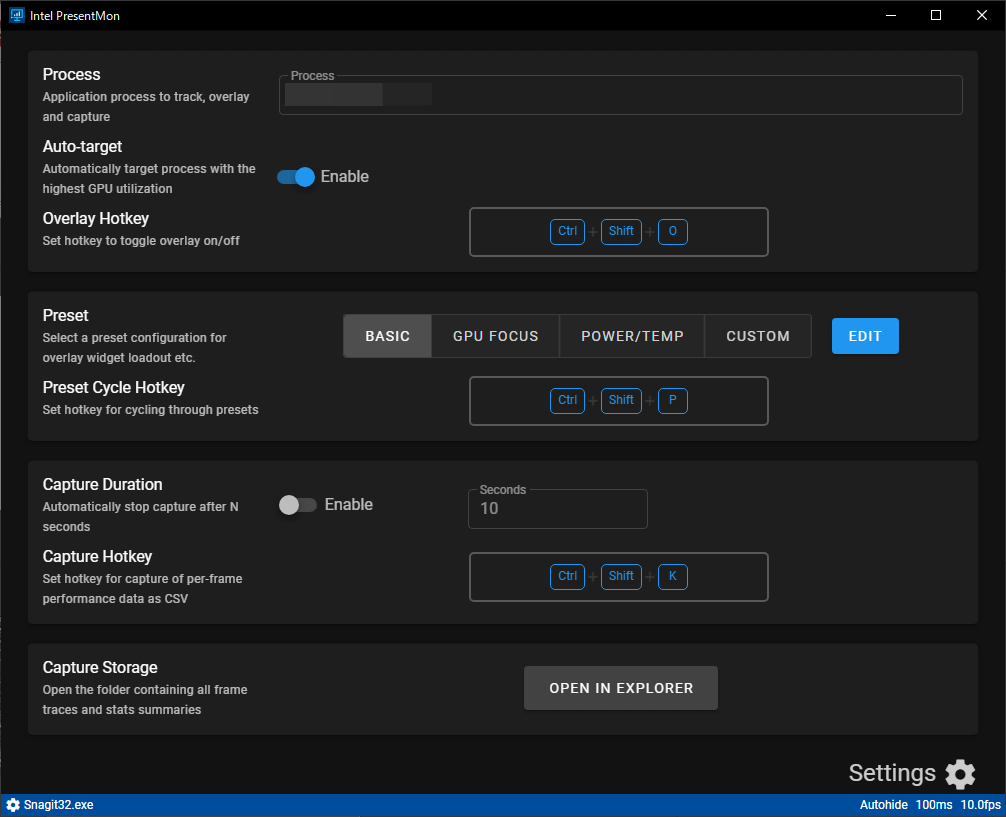
When the following screen is displayed, the performance measurement will start automatically just by starting the game etc.
When I tried to launch the shooting game '

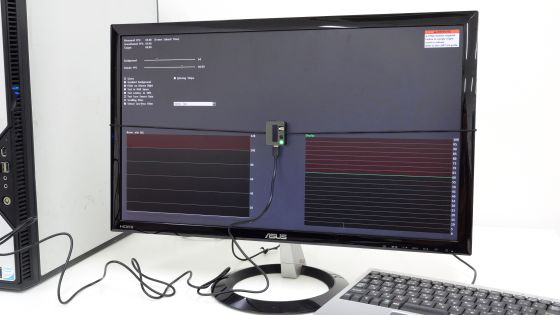
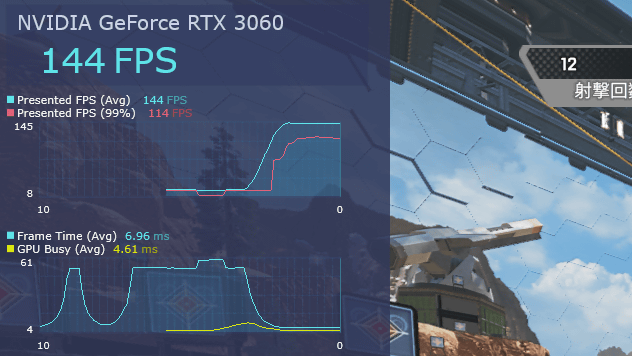
The measurement result display screen looks something like this. 'GPU model name' and 'application frame rate' are displayed. This screen can be displayed or hidden by pressing 'Ctrl', 'Shift' and 'O' at the same time.
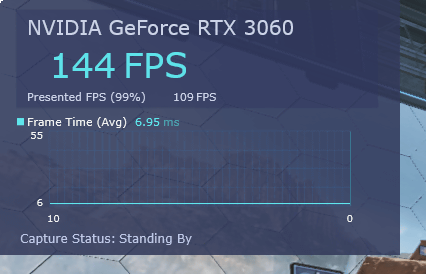
Press 'Ctr', 'Shift' and 'P' at the same time to switch the displayed contents of the measurement results. The yellow-green line drawn in the second graph from the top of the image below is the 'GPU Busy' value advocated by Intel, which shows the time spent by the GPU to draw the frame.

◆Convenient settings
By default, pressing 'Ctrl + Shift + O' at the same time switches between display and non-display, 'Ctrl + Shift + P' switches the display contents, and 'Ctrl + Shift + K' enables log acquisition. Depending on the application, it overlaps with the prescribed short key and may not work well. In such a case, you can change the key by clicking each shortcut key.
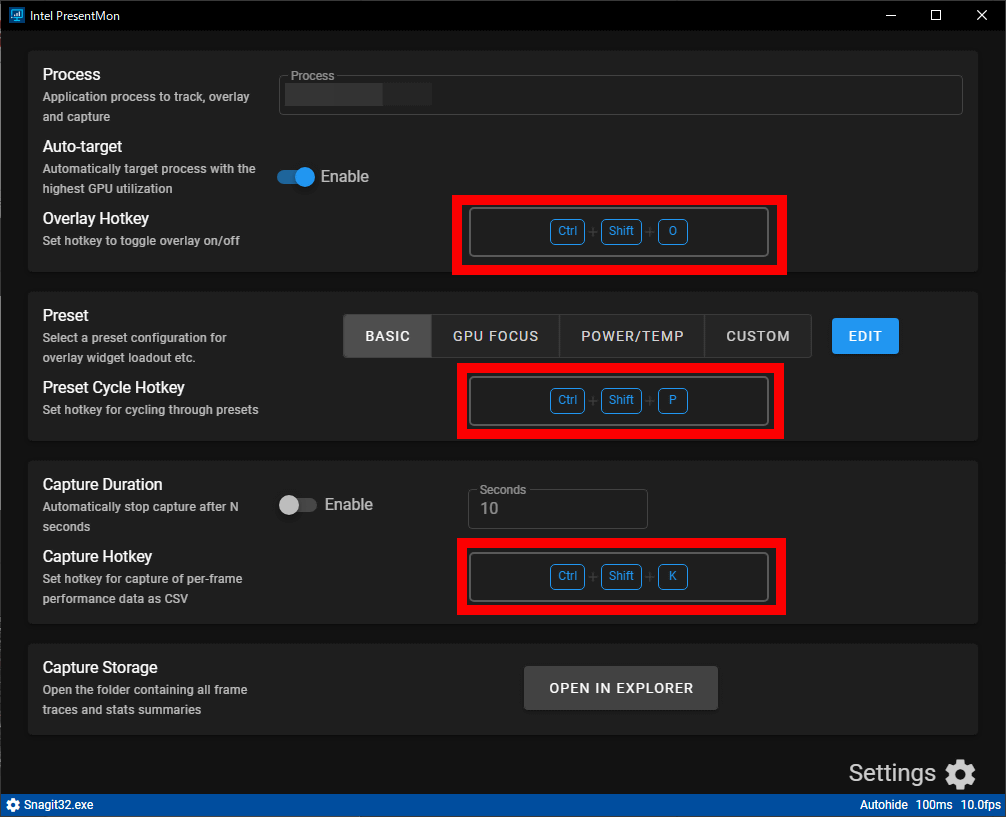
The shortcut key change screen looks something like this.

Also, by default, the measurement results are displayed in an overlay on the upper left of the application screen, but you can change the display position. To change the position of the overlay display, first click 'Settings'.
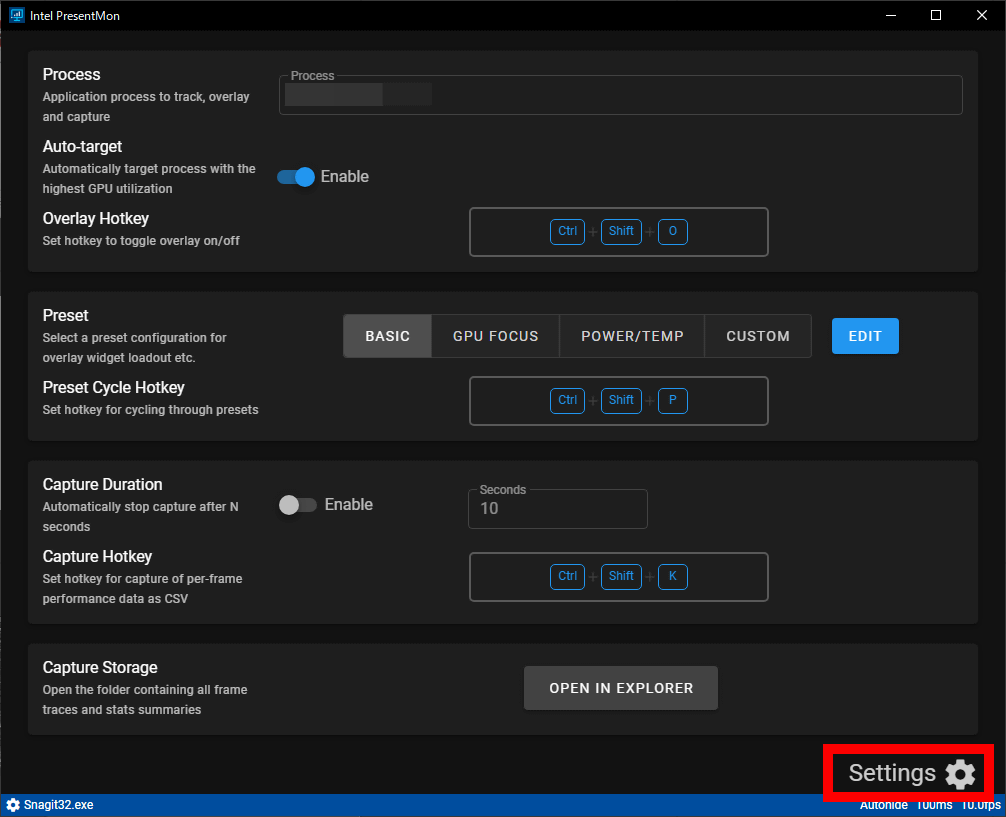
When the setting screen opens, you can select the display position from four positions in the 'Position' column: 'upper left', 'upper right', 'lower left', and 'lower right'.

Related Posts: