GitHub supports 'Mermaid', a library that automatically creates graphs from text
As the saying goes, 'a picture is worth a thousand words,' you can often understand what you couldn't understand no matter how carefully you explained it, just by looking at a single image. It has been announced that the software development platform GitHub has officially supported and made available the library ' Mermaid ' that automatically generates graphs from text.
Include diagrams in your Markdown files with Mermaid | The GitHub Blog
Since GitHub is a site used by programmers, it is designed with a focus on text, and until now it was necessary to embed images to give a visual explanation. In the future, it will be easier to create graphs by using Mermaid, which will make it easier to create and maintain documents, and it will be easier to give visual explanations when making proposals on issues and explaining pull requests. It has become.
The types of graphs supported by Mermaid are as follows.
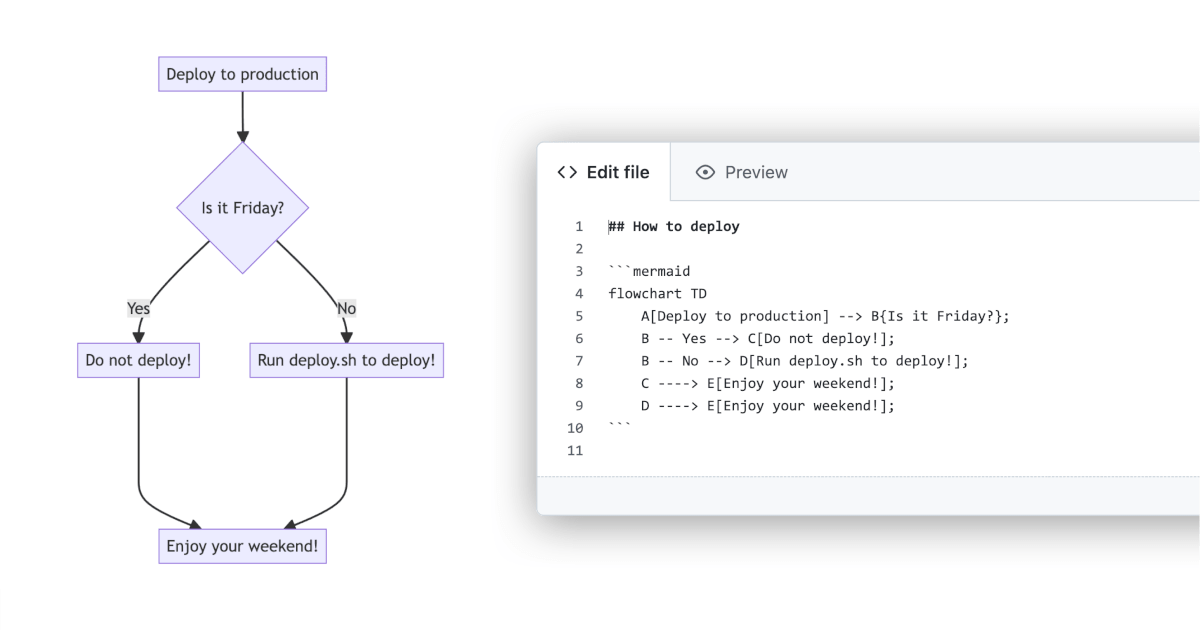
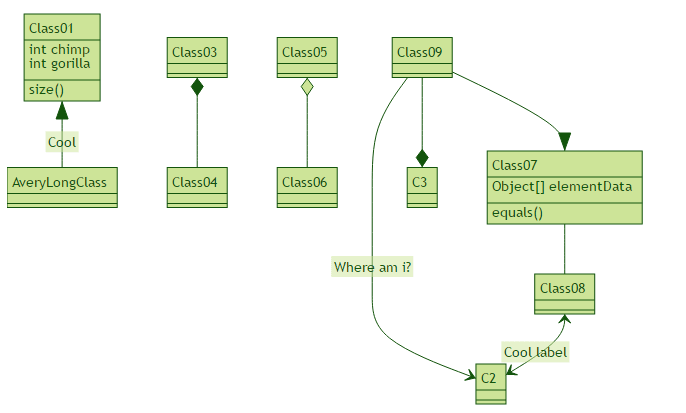
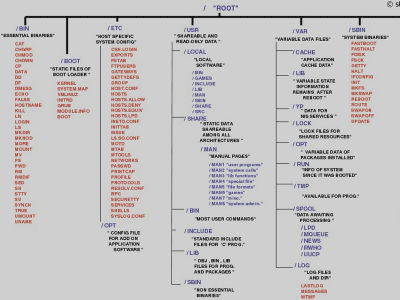
◆ Flow format
◆
◆
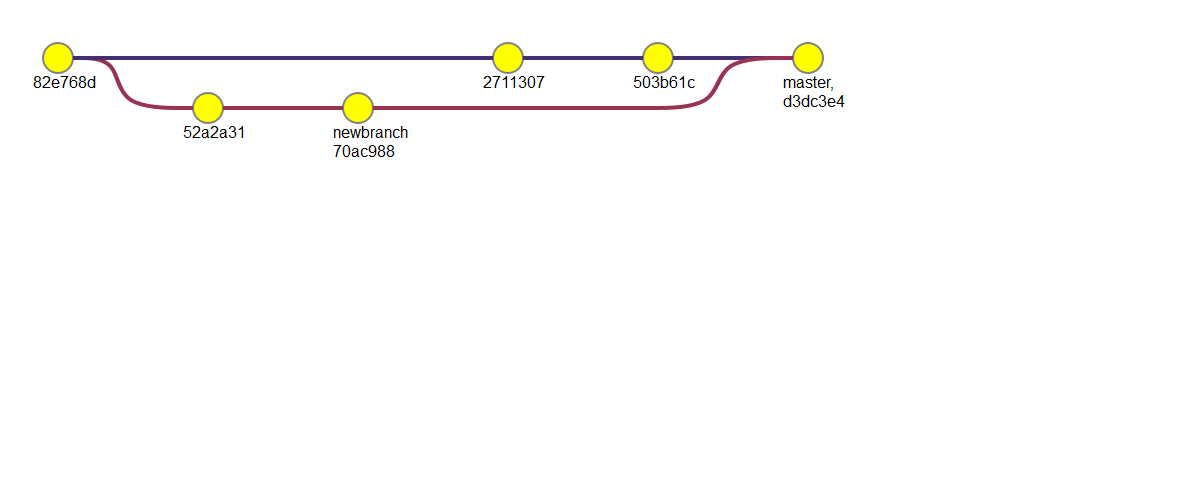
◆ Git graph
◆
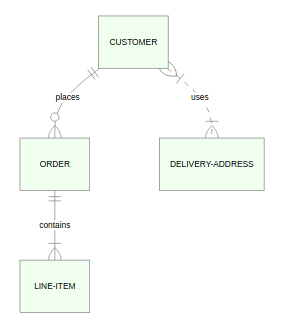
◆ Journey map

A graph that arranges the relationships between users and services in chronological order.
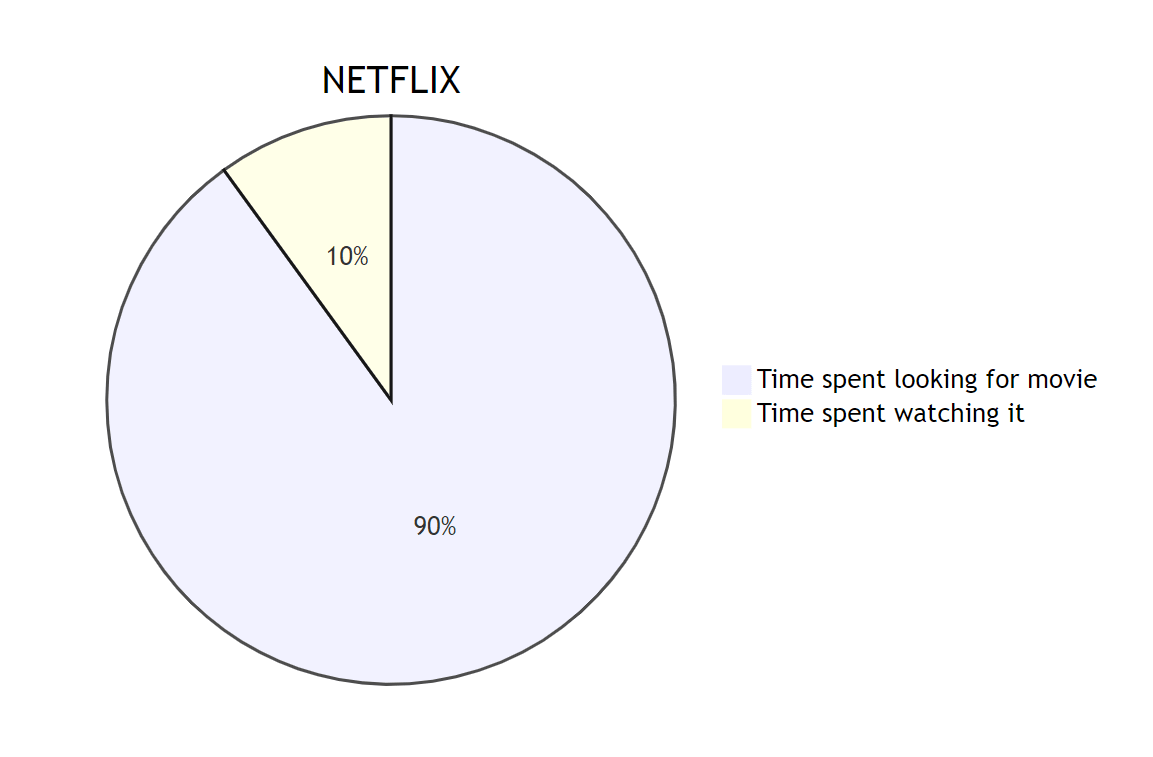
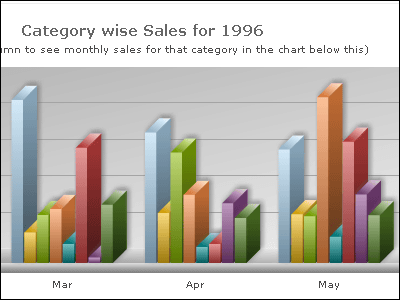
◆ Pie chart
◆

When using it on GitHub, enclose the Mermaid notation part with three backticks and write 'mermaid' after the first three backticks.
[code] ``` mermaid
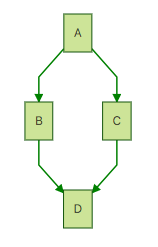
graph TD;
A-> B;
A-> C;
B-> D;
C-> D;
`` `[/ code]
In the above case, the following flow format graph is automatically generated.
Mermaid itself is a graphing tool that has been under development since 2014, so you can't miss the fact that the surrounding environment such as a live editor is in place.
Related Posts:


in Software, Web Service, Posted by log1d_ts