'Isoflow' that allows you to create an easy-to-read network diagram with a three-dimensional expression on the browser
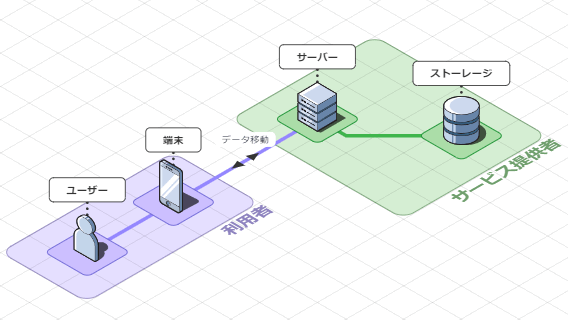
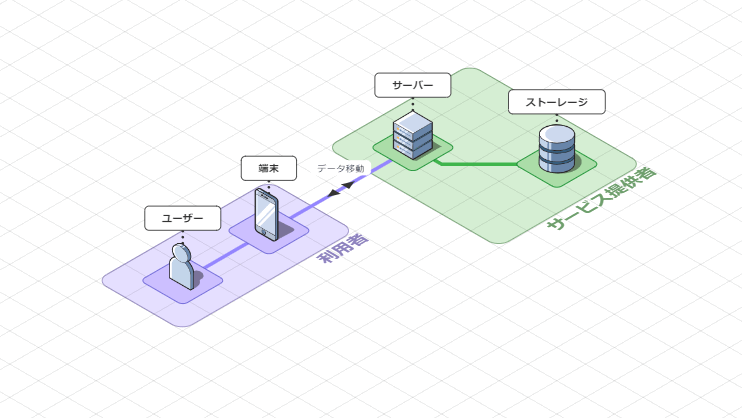
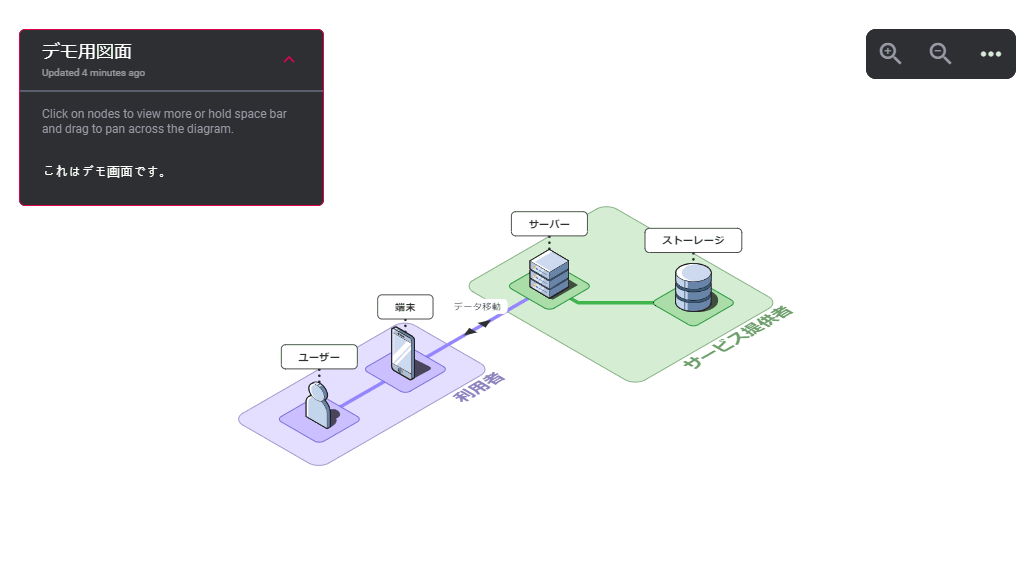
'Isoflow ' is an online service that allows you to express the network configuration in an isometric diagram that is easy to understand visually, and to share the created drawing and show it to the other party.
Isoflow
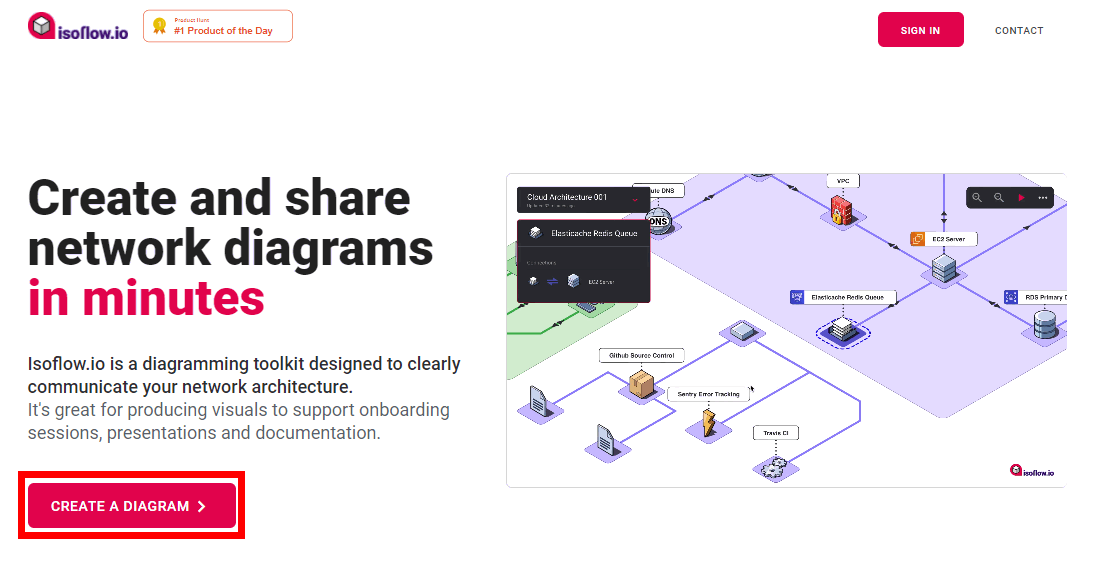
First of all, you can go to the drawing creation screen immediately by trial. Click 'CREATE A DIAGRAM'.
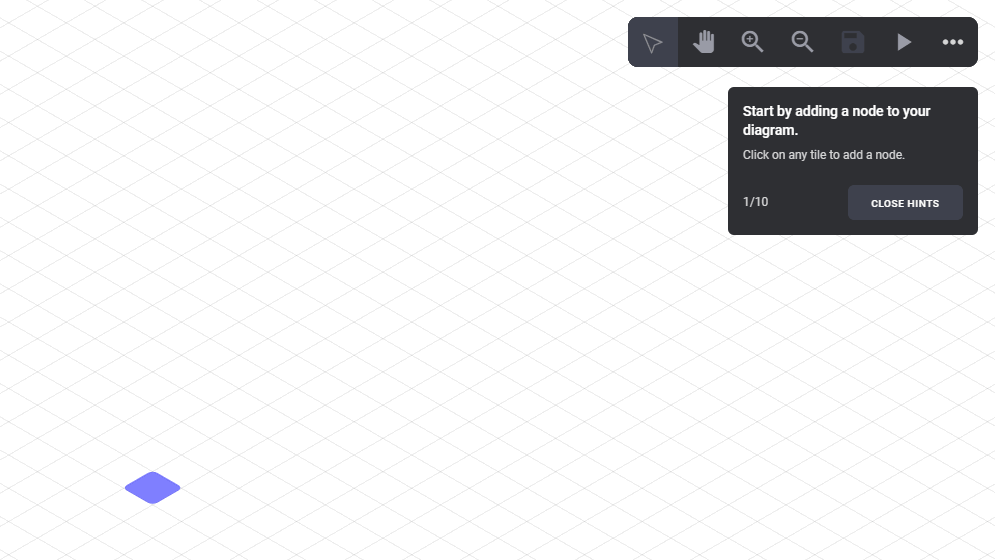
Click the square at the desired position on the displayed canvas to install the node part.
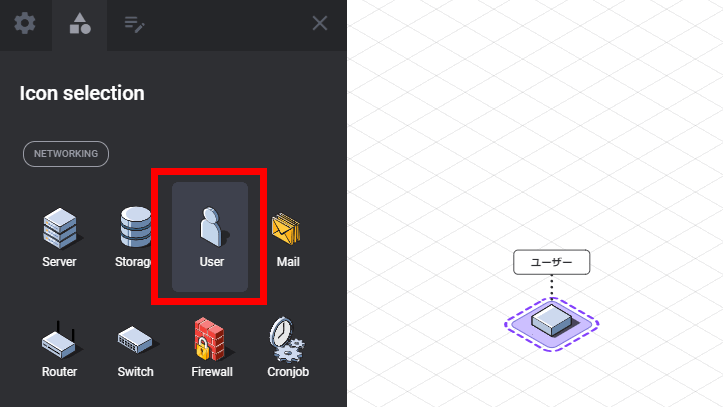
When the node is installed, a dialog will appear on the left side, so name it in the Label input field. Click 'Node icon' to change the node icon.
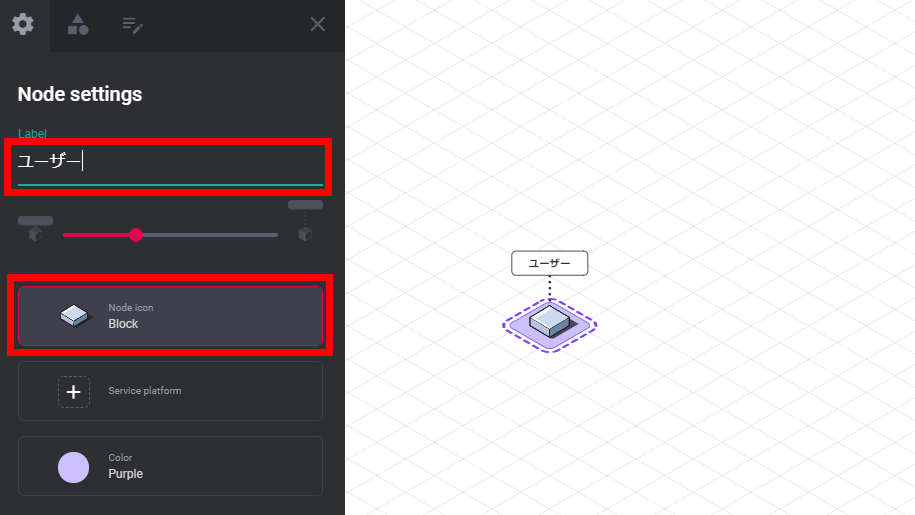
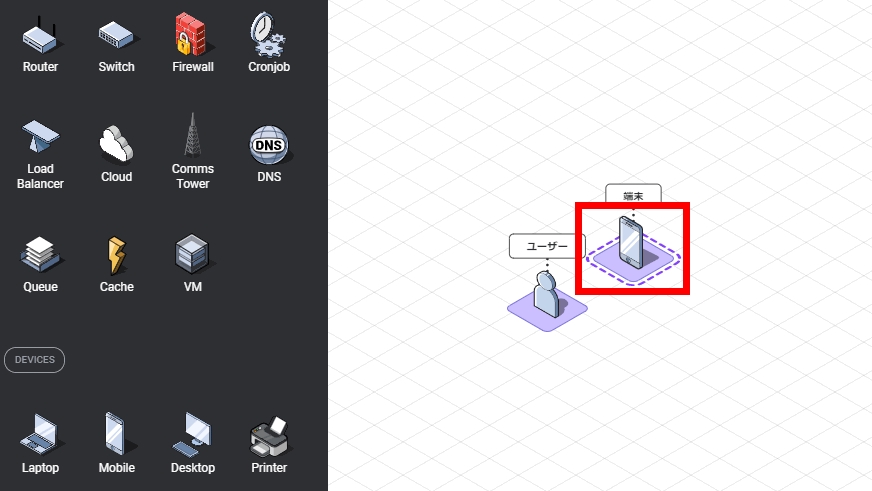
A list of icons will be displayed, so click the picture of the desired icon to change it.
After adding more nodes, click the node icon.
A node submenu will be displayed, so click 'Connect'.
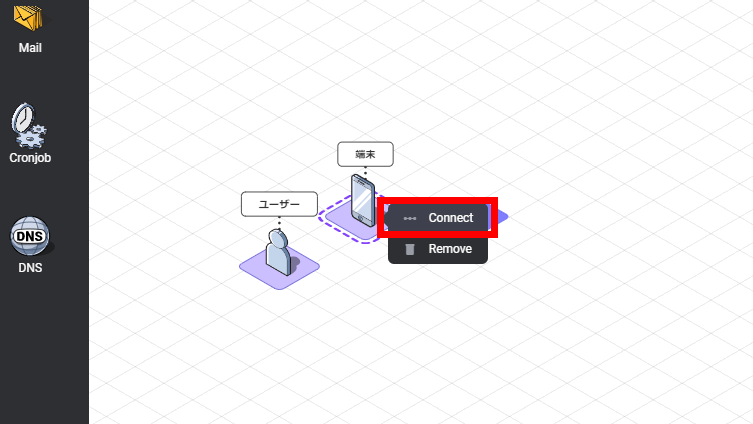
Move the pointer for connecting nodes with the mouse and click on the node of the other party you want to connect.

The nodes are connected.
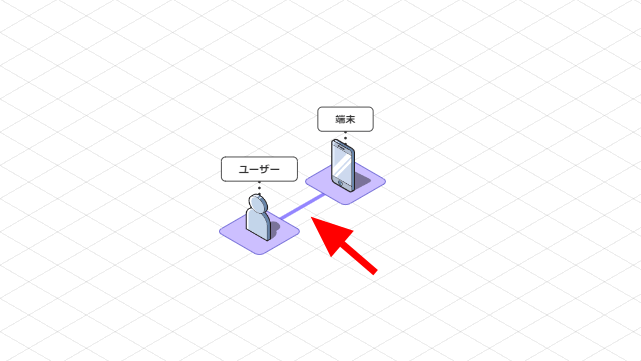
Repeat these steps to create a drawing.
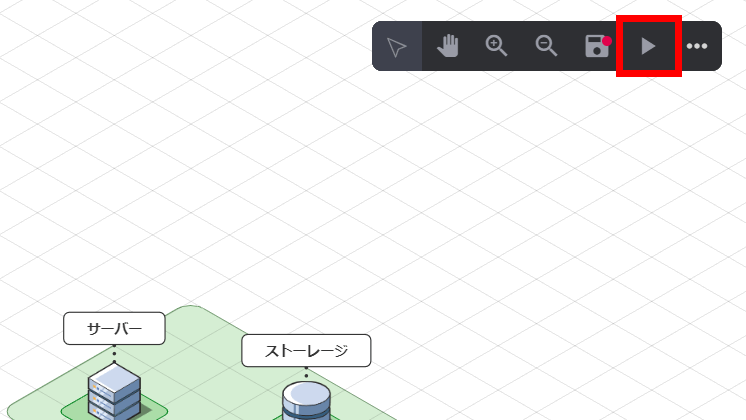
A moving demo is also possible, click the 'Present' button in the upper right menu.
When you hover your mouse over the line connecting the nodes ...
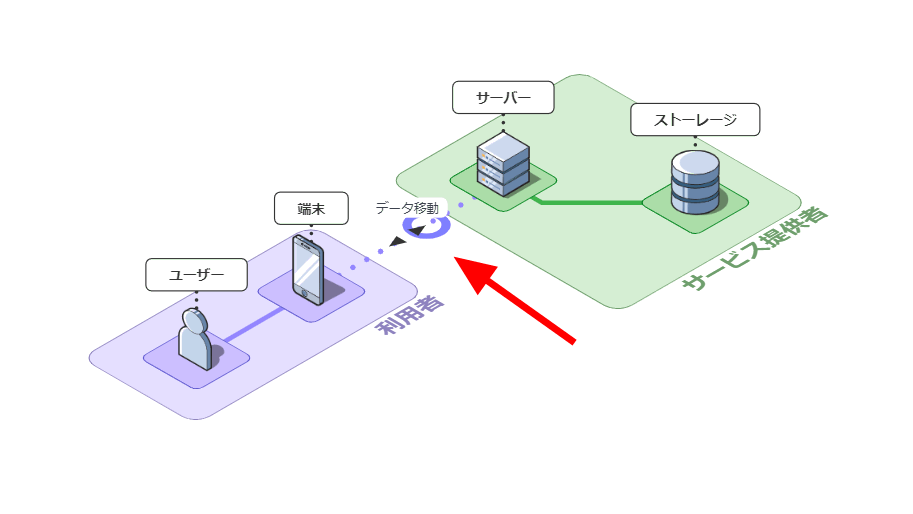
It changes from a line to a round point and moves with animation. It is possible to show the direction of communication with a moving picture.
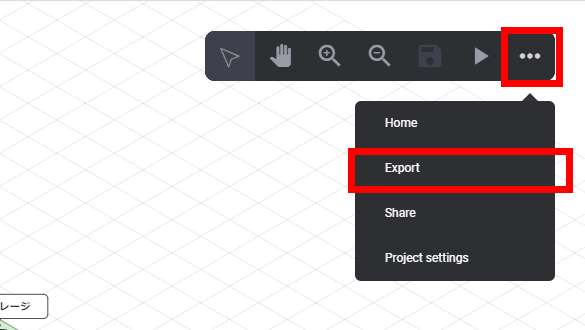
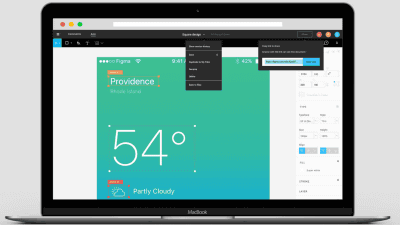
Output as PNG images is also possible. Click 'Export' from the menu on the upper right.
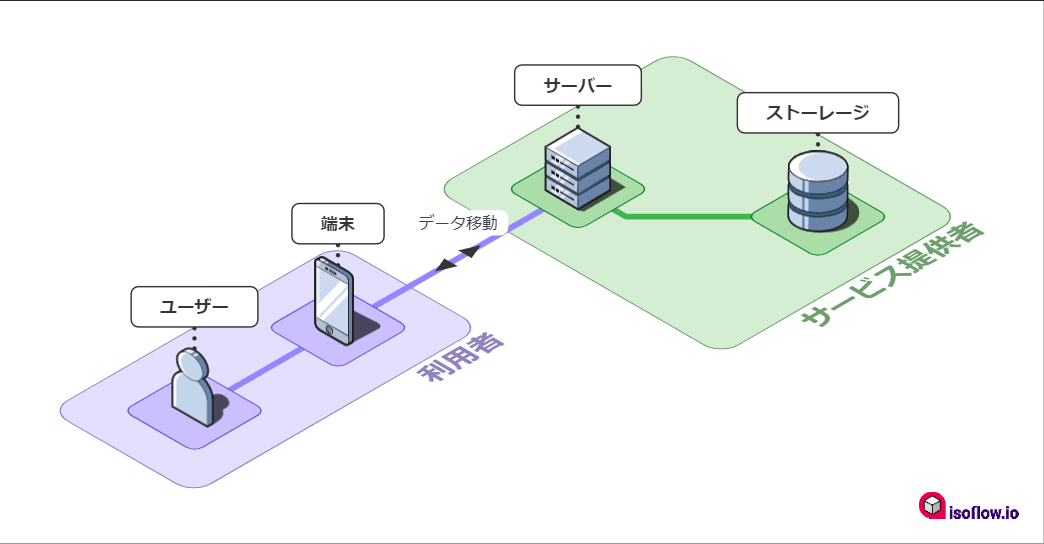
A PNG image that is automatically cropped to fit the entire drawing is saved.
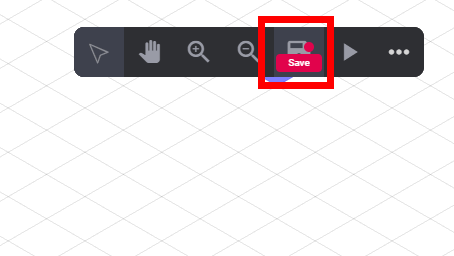
Click 'Save' to save the created drawing project.
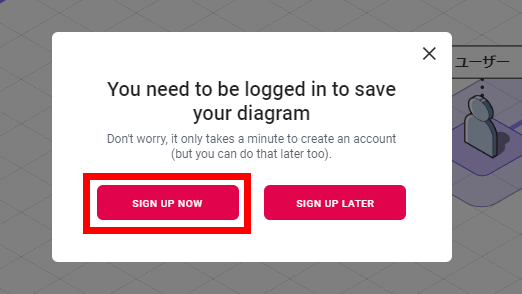
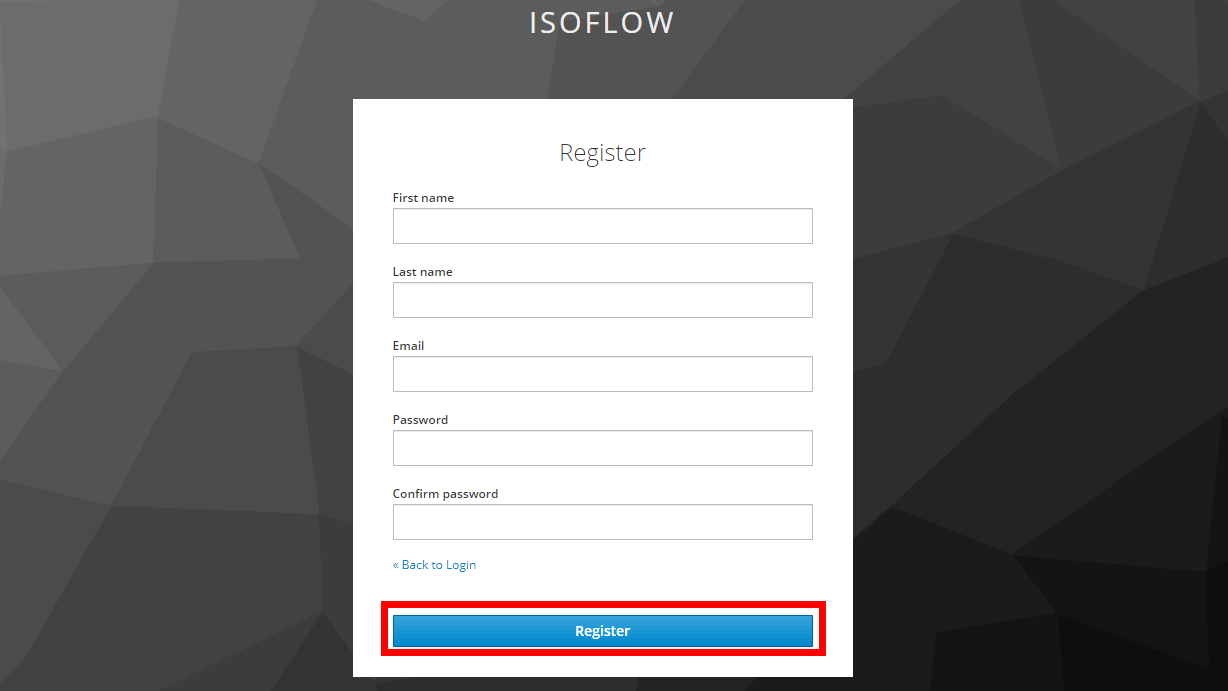
Registration is required to save. Click 'SIGN UP NOW'.
Enter the required items and click 'Register'. It will be saved automatically when registration is completed.
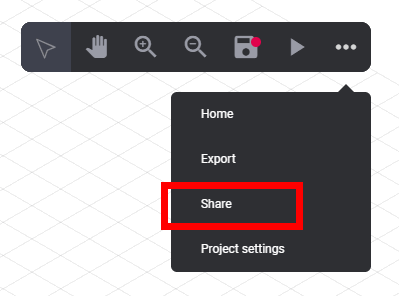
To use the share function, click 'Share' from the menu on the upper right.
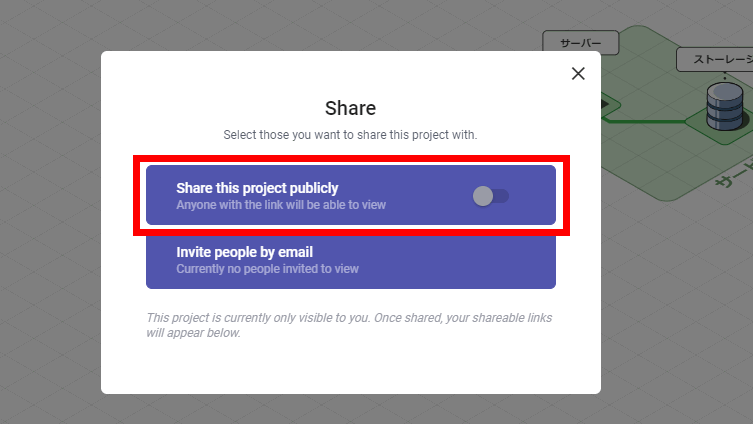
Let's create a public link. Click 'Share this project publicly'.
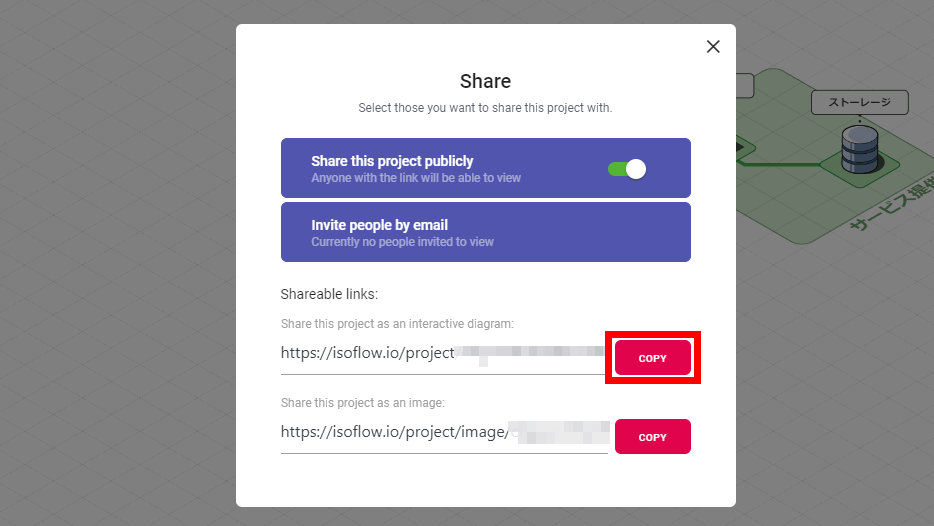
Click 'COPY' at the top to show it interactively on the browser, or click 'COPY' at the bottom to introduce only the image.
When I pasted the copied URL into another browser and accessed it, I was able to see the drawing in the state of the presentation.
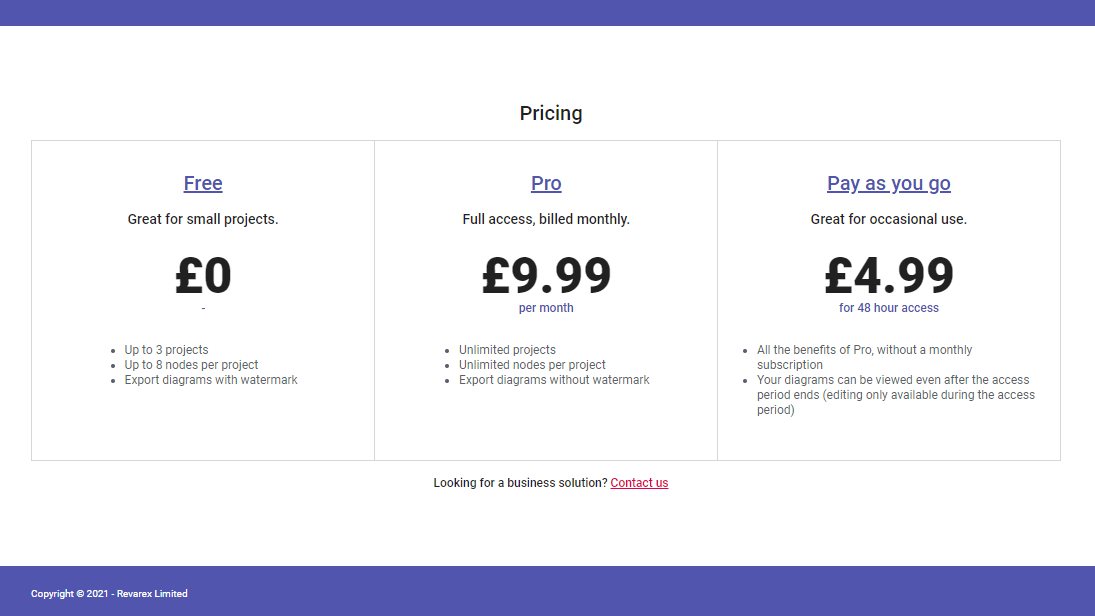
In the free version, there are restrictions such as '8 nodes can be installed', '3 projects can be saved', and 'watermark is inserted when the image is output', but a simple network diagram can be used enough. I have.
Related Posts:

in Web Service, Review, Posted by darkhorse_logmk