How to spot what really works for SEO

Demystifying SEO with experiments | by Pinterest Engineering | Pinterest Engineering Blog | Medium
https://medium.com/pinterest-engineering/demystifying-seo-with-experiments-a183b325cf4c
In conducting the A / B test, Pinterest first divides the traffic into groups according to a specific cut, such as 'with or without the related item bar', and aggregates the number of accesses for each group by date and time. In addition, it seems that the dashboard that displays the aggregate results was also developed independently.
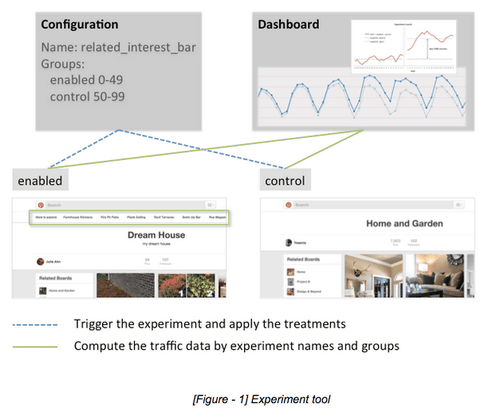
A/B testing is usually done by segmenting users, but Pinterest's experiment was done by segmenting pages. In other words, 50% of all pages were divided into 'changed group (enabled)' and the remaining 50% were divided into 'control group (control)', and each page was classified by URL hash. . Since the hash of the URL was attached in a form that included the experiment name, it was possible to distribute pages evenly within the experimental group and to conduct multiple experiments simultaneously with various group sizes.
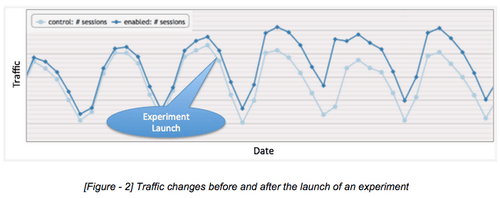
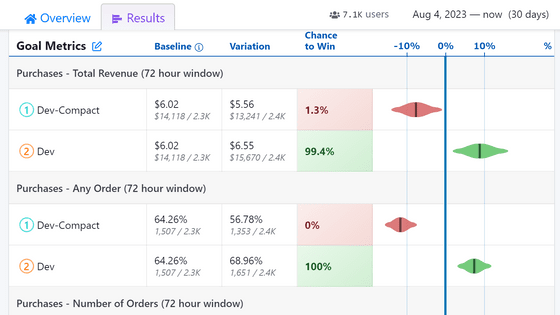
After the experiment, Pinterest compared the performance of each group by comparing traffic. In the figure below, the vertical axis shows traffic, the horizontal axis shows the date, and the part where the balloon says 'Experiment Launch' is the start point of the experiment. After the start of the experiment, you can see that the graph slowly opens up. The reason why the two graphs do not match perfectly at the starting point is that some pages are popular and some are not.
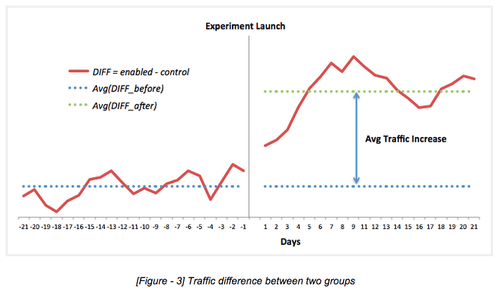
To normalize this difference, Pinterest replotted the data as follows. In the figure below, the vertical axis is traffic, the horizontal axis is date, and the gray line drawn in the middle is the start of the experiment. The blue dotted line is the average value before the experiment, and the green dotted line is the average value during the experiment. If you show the ``changed group minus the control group'' with a solid red line, you can see that there is a big difference before and after the start of the experiment.
A/B testing can include a variety of things, such as site map changes, linking methods, and site designs that are effective for search engines. And what is effective as SEO depends on the website, the products handled on the website, and the timing. For this reason, there is no choice but to conduct a large number of experiments in order to identify effective methods for SEO, and when Pinterest conducted experiments, there were some that were completely useless even among SEO that was generally considered effective, while others said, 'It really does not make sense.' Is there such a thing?” It seems that the method that I doubted was effective.
For example, Google Search Console found that there were too many title tag duplicates on Pinterest's 'boards' where pins are stored together. The board page title tag was set to '{board_name} on Pinterest,' and multiple users were signing up with the same name. Since the page title is an important factor for SEO, it is generally said that reducing duplicate title tags is effective. Therefore, an experiment was conducted to prevent duplication of title tags by changing the page title to '{board_name} on Pinterest | ({number} Pins).', but no significant difference in traffic between groups was observed.
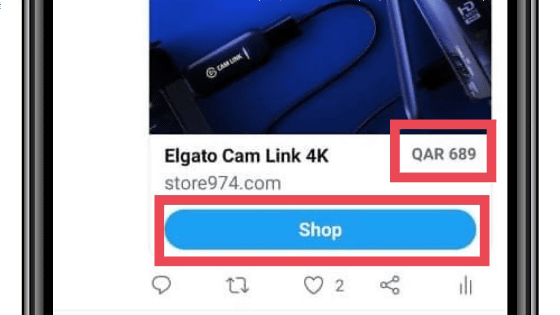
On the contrary, the measure that worked well was to 'eliminate the lack of description'. Some have a text description when the user pastes the pin, some don't. So Pinterest picked up the descriptive images in the Pins and applied them to the same undescripted images pinned by others. The change had more impact than expected, with additional follow-up experiments resulting in a 30% increase in traffic.
In most cases, Pinterest says that the impact of the experiment on traffic starts to become apparent within a few days of the experiment starting. The difference between the groups will continue to expand over a period of 1-2 weeks until the difference stabilizes, and it is necessary to determine ``what is a successful experiment'' during this time.
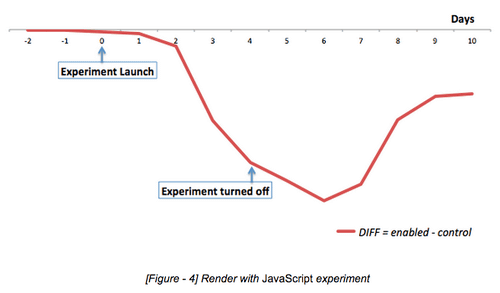
For example, the graph below shows the experimental results of rendering using JavaScript to improve website performance. He wanted to make sure that the use of JavaScript did not adversely affect SEO, but the adverse effect began to be seen on the second day from the start of the experiment. At this time, Pinterest decided to 'see the situation for a few more days', but the traffic did not improve even after a few days, and the experiment ended in failure. Pinterest emphasizes the importance of decision timing, as it took a full month to recover from this adverse effect. In addition, it was also found from this that another experiment is necessary to ``do not adversely affect SEO''.
Related Posts:


in Note, Posted by darkhorse_log