How much did people want pornography on Election Day in the 2020 US presidential election?

2020 Election Day Insights – Pornhub Insights
https://www.pornhub.com/insights/2020-election-day
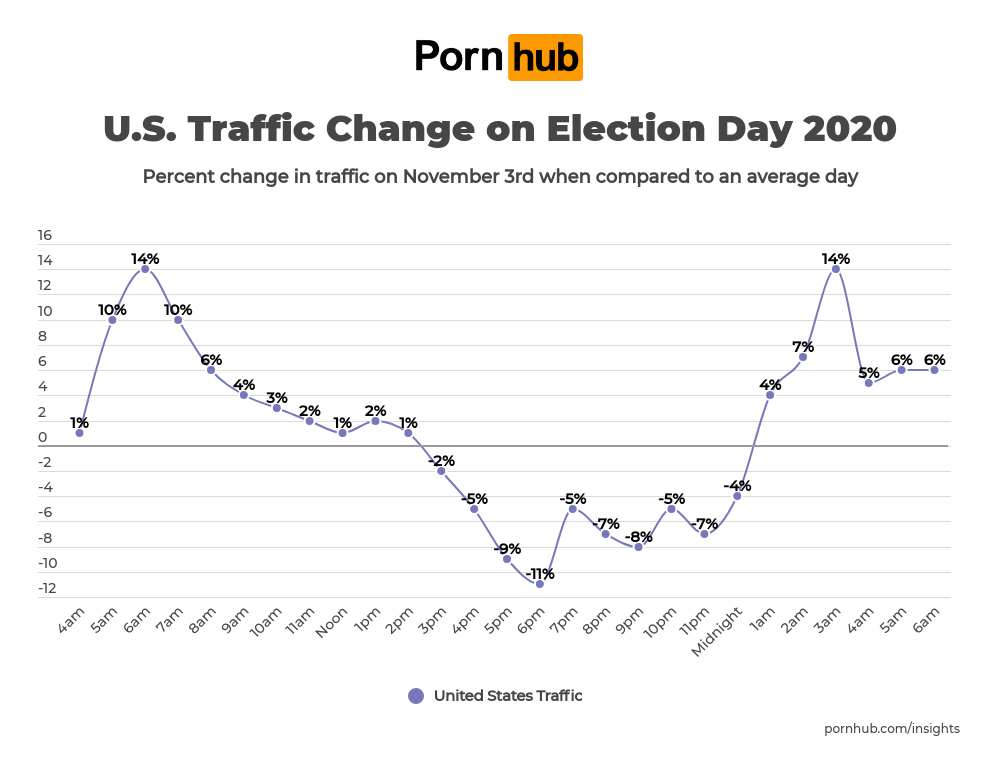
The graph below shows the traffic ratio between normal time and November 3, the election day of the US presidential election. From early morning (4 o'clock) to morning, there is more traffic to Pornhub than usual, and at 6 o'clock, 14% more traffic than usual. On the other hand, after 14:00, the traffic was lower than usual, and the traffic was the least at 18:00 (11% decrease). The day after the election day, traffic was higher than usual, and at 3 o'clock, it recorded a 14% increase again.
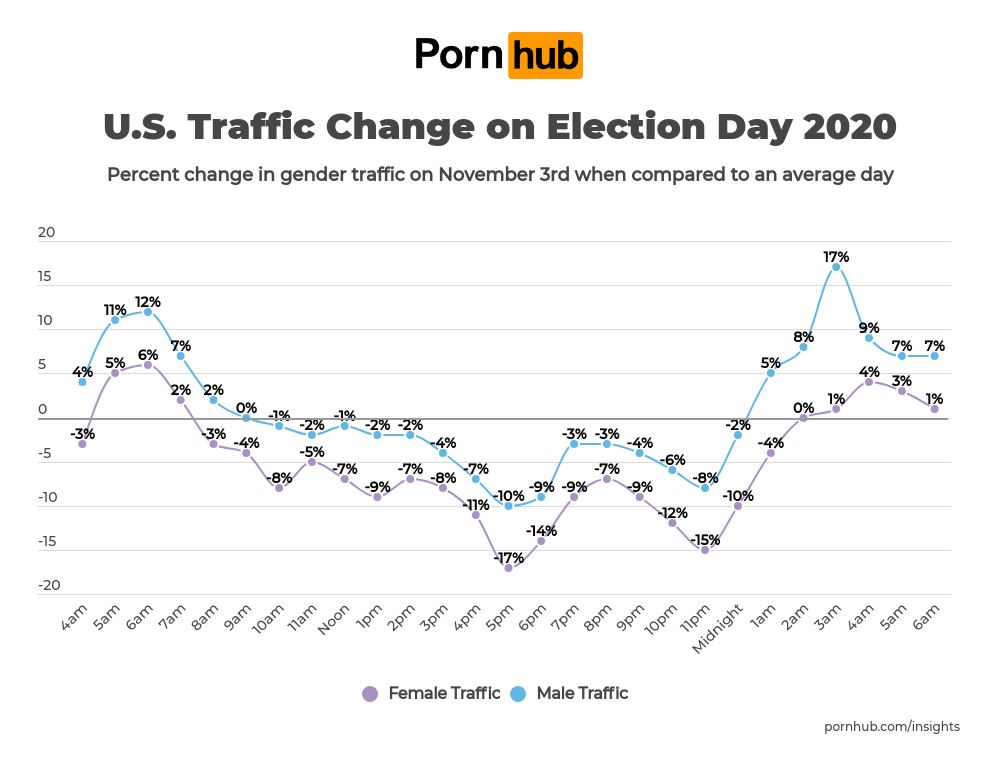
The graph below shows the traffic ratio between normal time and election day by gender. The blue line shows the traffic ratio for men and the purple line shows the traffic ratio for women. The time zone when the male traffic ratio increased the most compared to normal times was around 3 o'clock (17% increase) on the 4th, the day after the election day, and conversely, the time when it decreased the most was around 17:00 (10) on the 3rd. % Decrease). For women, the time of day when the traffic ratio increased the most was around 6 o'clock on the 3rd (up 6%), and conversely the time when it decreased the most was around 17:00 on the 3rd (down 17%).
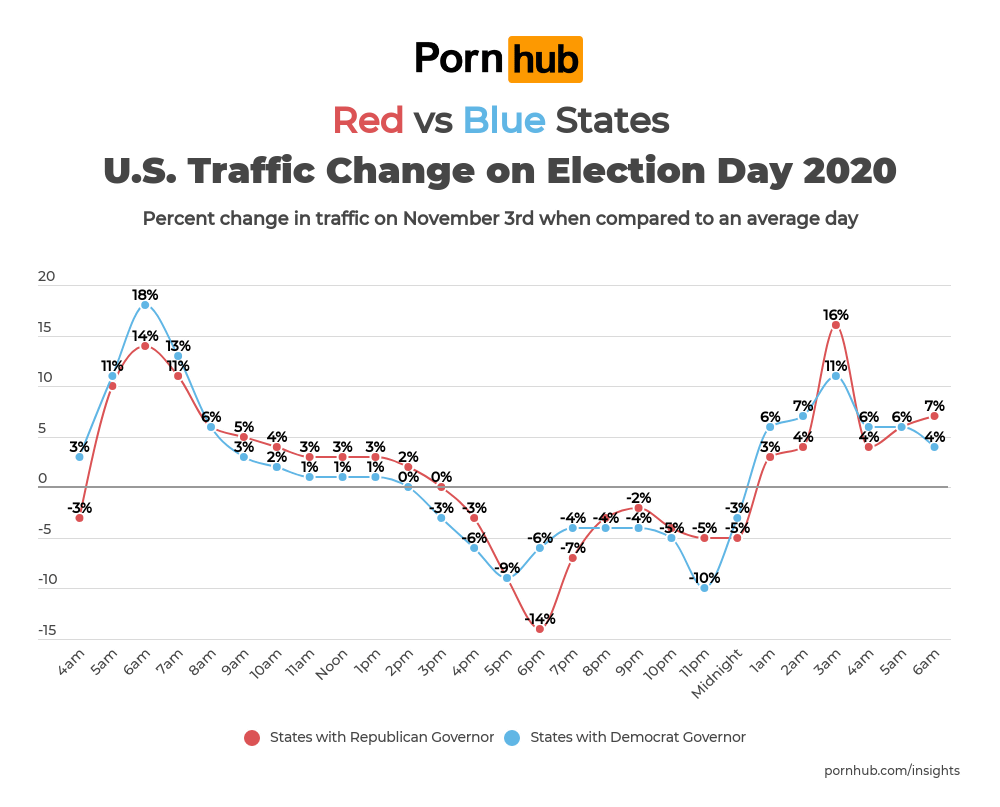
The graph below summarizes the traffic ratio between normal times and election days by supporting political party. Democratic supporters are marked with a red line, and Republican supporters are marked with a blue line. The time when the traffic ratio of Democratic Party supporters increased the most compared to normal times was around 3 o'clock (16% increase) on the 4th, the day after the election day, and on the contrary, it decreased the most around 18:00 on the 3rd. (14% decrease). For Republican supporters, the time of day when the traffic ratio increased the most was around 6 o'clock (up 18%) on the 3rd, and conversely the time when it decreased the most was around 23:00 (down 10%) on the 3rd.
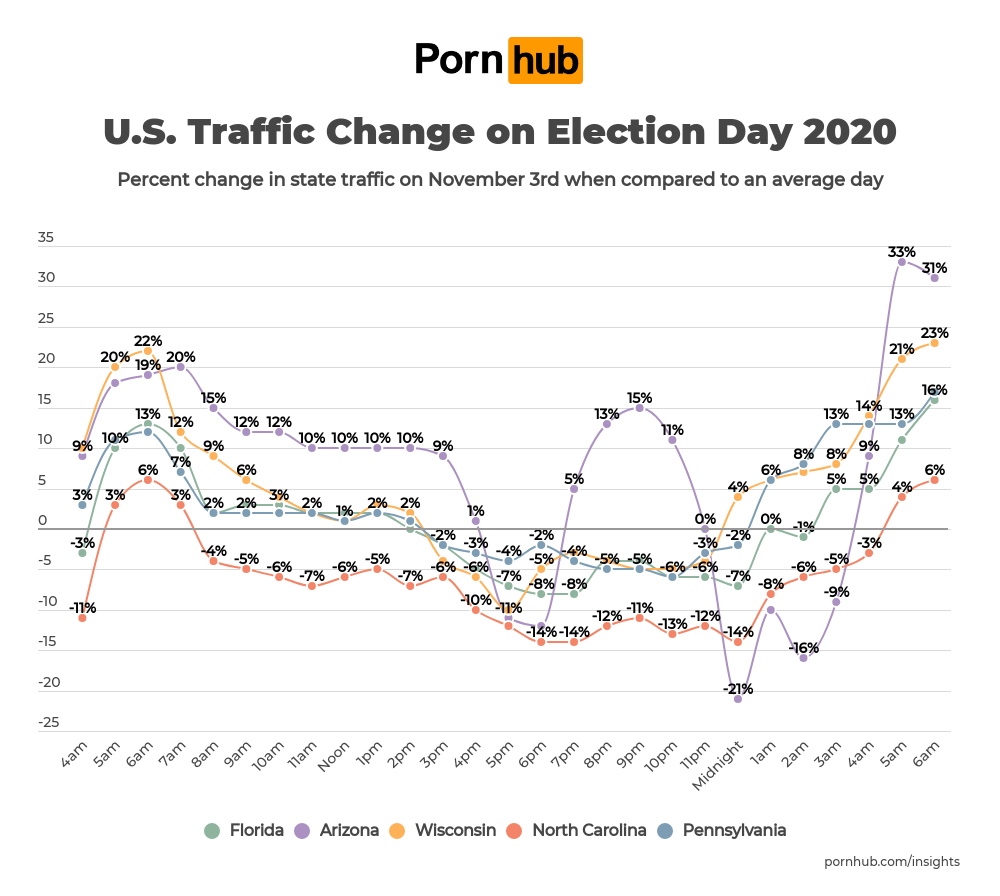
The graph below summarizes the traffic ratio between normal time and election day by state. The graph below shows the traffic ratios for Florida (green), Arizona (purple), Wisconsin (yellow), North Carolina (red), and Pennsylvania (blue). Overall, changes in the traffic ratio show similar trends, but Arizona has more traffic than normal during the hours of 19:00 to 23:00 on the 3rd, and from 0 to 3 on the 4th than normal. Also recorded a special change that traffic decreased sharply, and traffic increased sharply from 4 to 6 o'clock on the 4th.
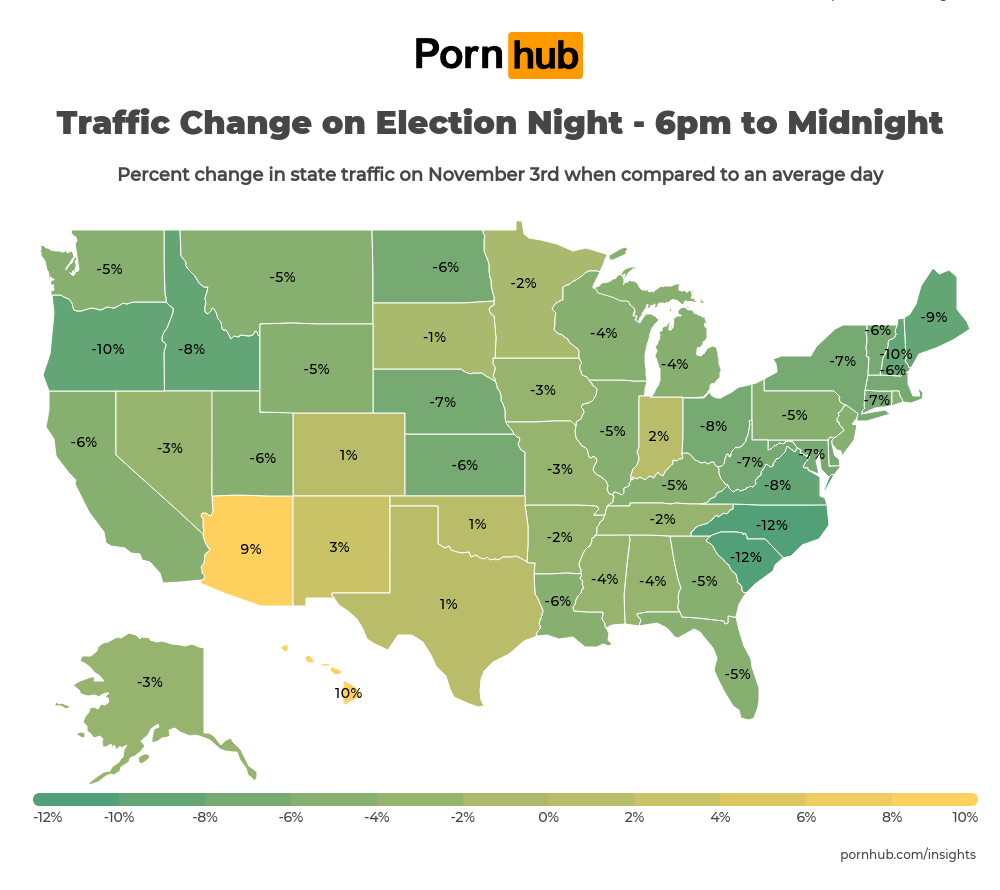
The map below shows the traffic ratio between normal time and election day (time zone after 18:00) by state. While most states have lower traffic than normal, Hawaii (up 10%) and Arizona (up 9%) have increased traffic.
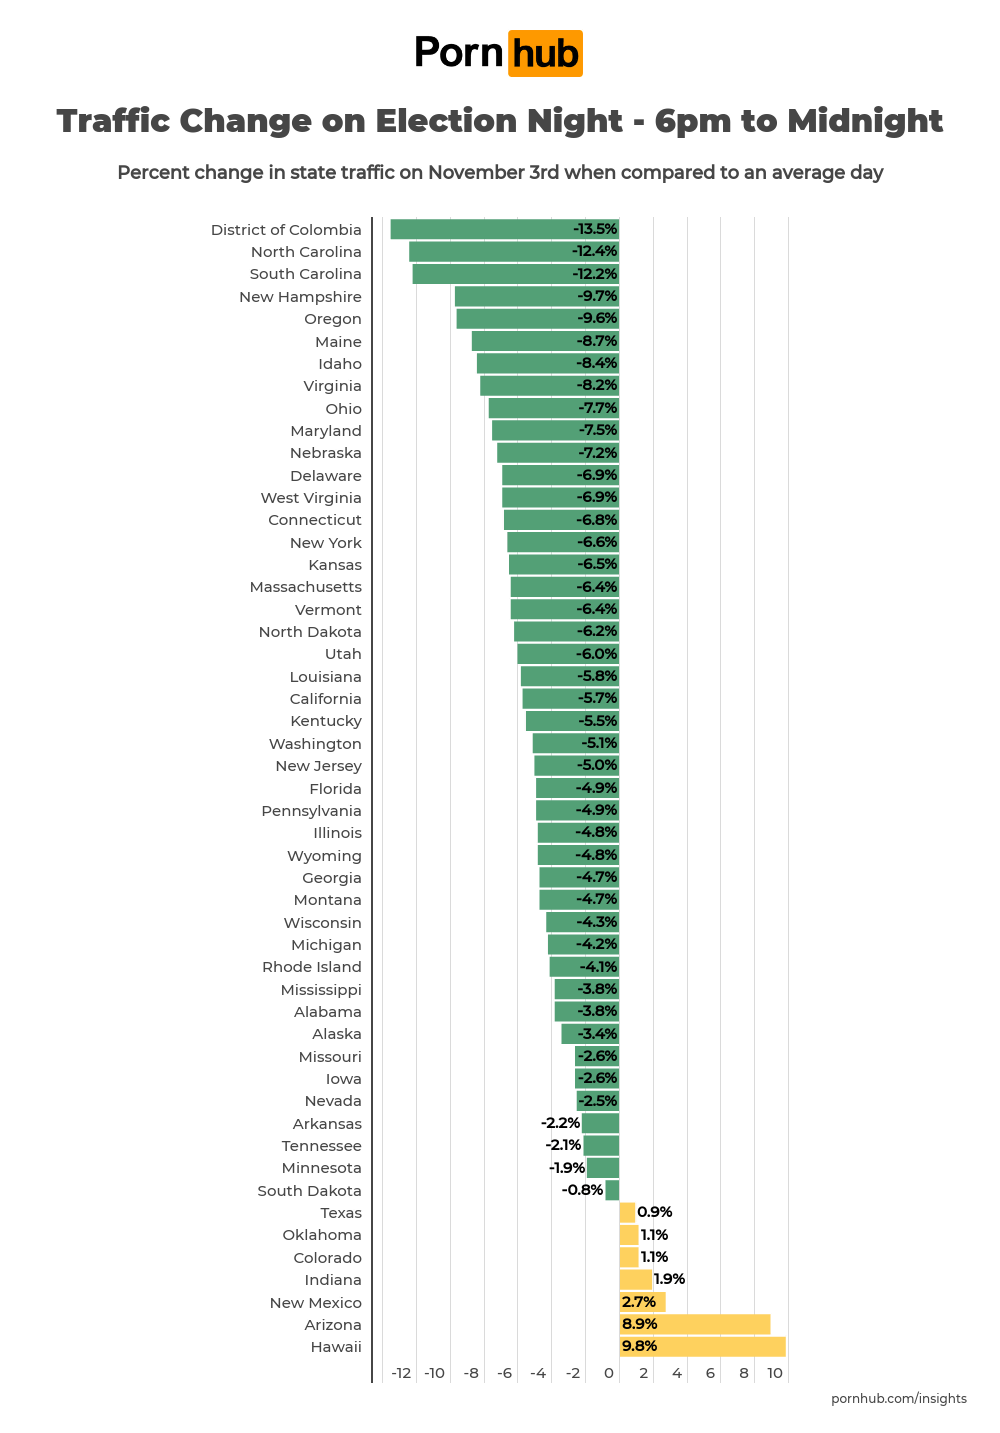
Below is a graph showing the traffic ratio between normal time and election day (time zone after 18:00). More traffic than usual is in Texas (up 0.9%), Oklahoma (up 1.1%), Colorado (up 1.1%), Indiana (up 1.9%), and New Mexico (up 2.7%). %), Arizona (8.9%), Hawaii (9.8%) only. Conversely, traffic is particularly low (10% or more down) from normal times in the three states of District of Columbia (down 13.5%), North Carolina (down 12.4%), and South Carolina (down 12.2%). is.
Related Posts:


in Note, Posted by logu_ii