What you can see by comparing the revenue sources of Amazon, Microsoft, Alphabet, Apple, Facebook with a graph

Google's parent company, Alphabet, and Amazon, Apple, Microsoft, and Facebook all have grown tremendously as technology-driven companies, and have come to generate huge profits. The combined revenues of the five companies are comparable to national GDP, but they appear to be similar, and what they earn and how they earn it are very different. If you graph the 2019 revenue breakdown of the five companies, you'll see the difference clearly.
How Big Tech Makes Their Billions-Visual Capitalist
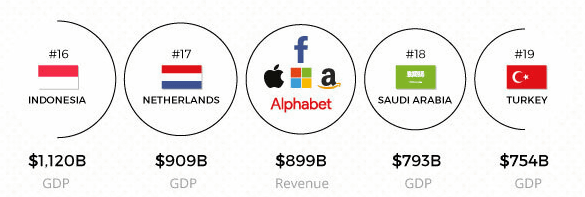
The combined annual revenue of the five companies of Alphabet, Amazon, Apple, Facebook and Microsoft is $899.0 billion (about 95 trillion yen), which is comparable to GDP in Saudi Arabia and the Netherlands.
The five companies have the similarities of being technology-driven, but what they earn is very different. For example, looking at Amazon's revenue in detail, overall revenue is 281 billion dollars (about 30 trillion yen) and net profit is 11.6 billion dollars (about 1.2 trillion yen), 50.4% of revenue is Online store. Revenue from third-party sales was 19.2%, followed by Amazon Web Services (AWS) with the second largest share at 12.5%. In addition, Amazon Prime has 6.9%, physical retailers have 6.1%, and others have 5.0%.

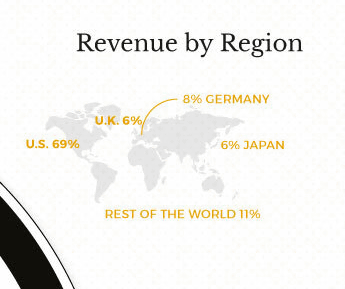
69% of revenues are generated in the United States, 8% in Germany, 6% in the UK and Japan, and the remaining 11% in the region.
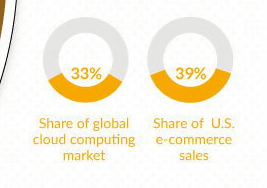
Also, looking at Amazon's overall revenue, cloud business like AWS is about 10% revenue, but Amazon's share of the global cloud computing market is 33%. The e-commerce business accounts for 39% of the total US market, with Amazon accounting for more than one-third of all markets.
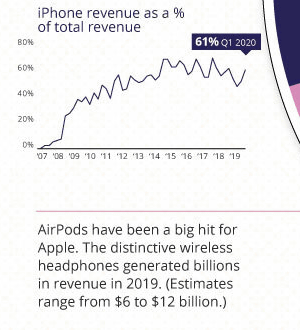
In the case of Apple, of the 260 billion dollars (about 27 trillion yen) of revenue, the net profit is 55.2 billion dollars (about 5.8 trillion yen), and 54.7% of the revenue comes from the iPhone. The second most common is Web services such as Apple Pay, Apple Music, and Apple TV, with 17.8%, followed by Mac with 9.9%, iPad with 8.2%, and other products with 9.4%, which are mostly hardware related sales. I will.

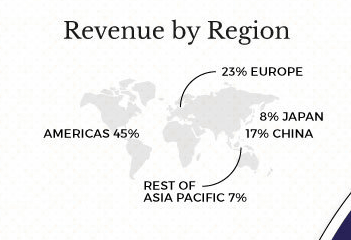
Looking at sales by region, the United States is 45%, Europe is 23%, China is 17%, Japan is 8%, and Asia Pacific is 7%.
Apple accounts for more than half of the revenue from the iPhone, but the percentage of revenue from the iPhone is gradually declining, and you can see that Apple is also focusing on other businesses.
In the case of Alphabet, net income is 34.3 billion dollars (about 3.6 trillion yen) out of 161.9 billion dollars (about 17 trillion yen). 70% of the revenue comes from advertising business such as Google Search, YouTube, Google Play, Gmail, Google Maps. The advertising placement service 'Google Ads' accounted for 13.3%, another Google service accounted for 10.5%, and Google Cloud accounted for 5.5%. The breakdown is suitable for being the largest advertising company in the world.
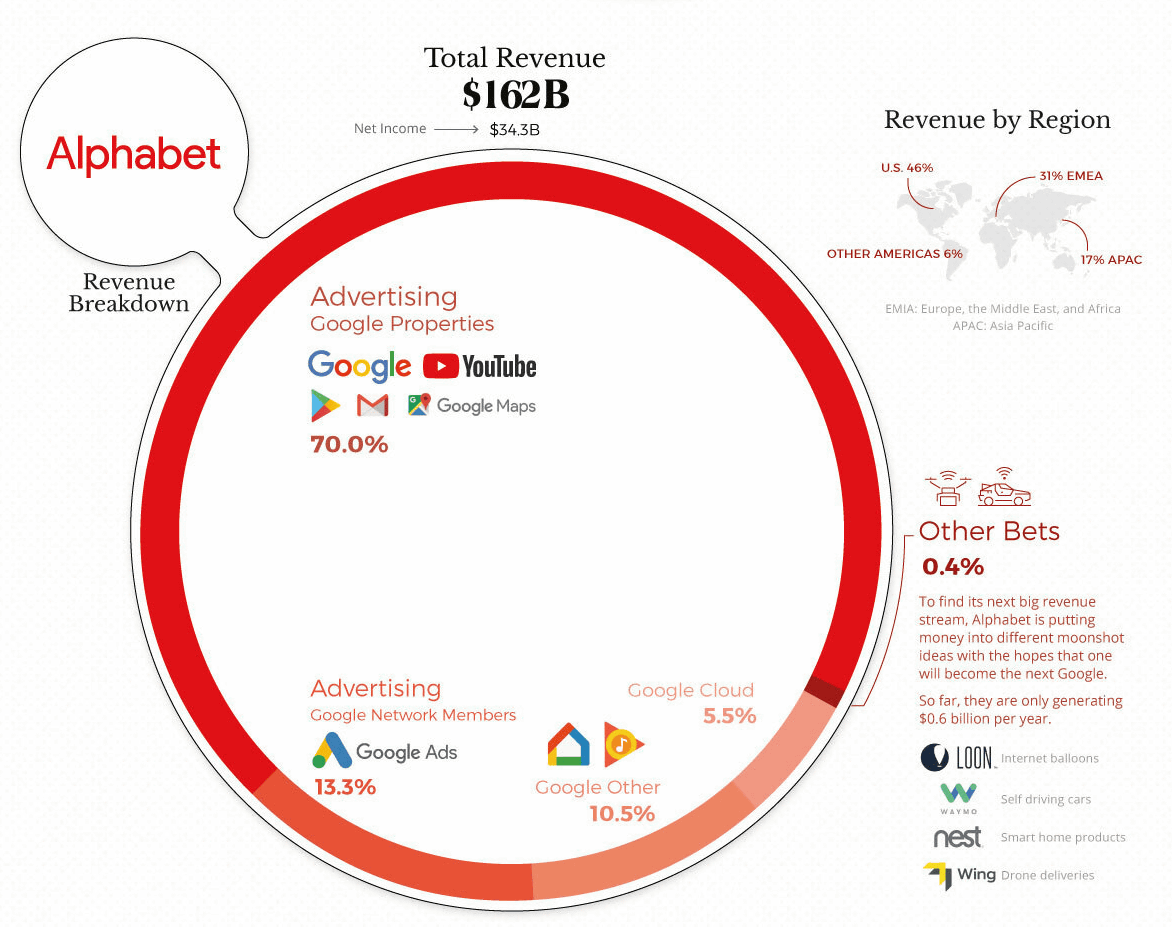
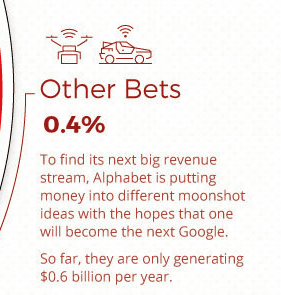
'Other Bets', which is small in the graph, is due to new projects that Google is investing in, such as
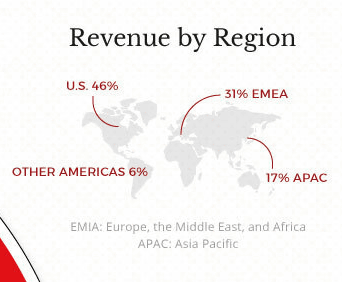
By region, 46% in the United States , 31% in Europe, the Middle East and Africa , 17% in the Asia-Pacific region, and 6% in the Americas other than the United States.
While the companies mentioned above tended to rely on revenue from one category, Microsoft earns from a variety of categories. Microsoft has net income of $39.2 billion (about 4.1 trillion yen) out of $125.8 billion (about 13 trillion yen) of revenue. The cloud service with the highest revenue ratio is 25.9% for Microsoft Azure, then 25.2% for Office, 16.2% for Windows, 9.1% for game sales, 6.1% for Bing search advertising revenue, and for corporate services. 4.8%, Surface sales 4.8%, Business specialized platform LinkedIn revenue 5.4%, Other 2.4%.
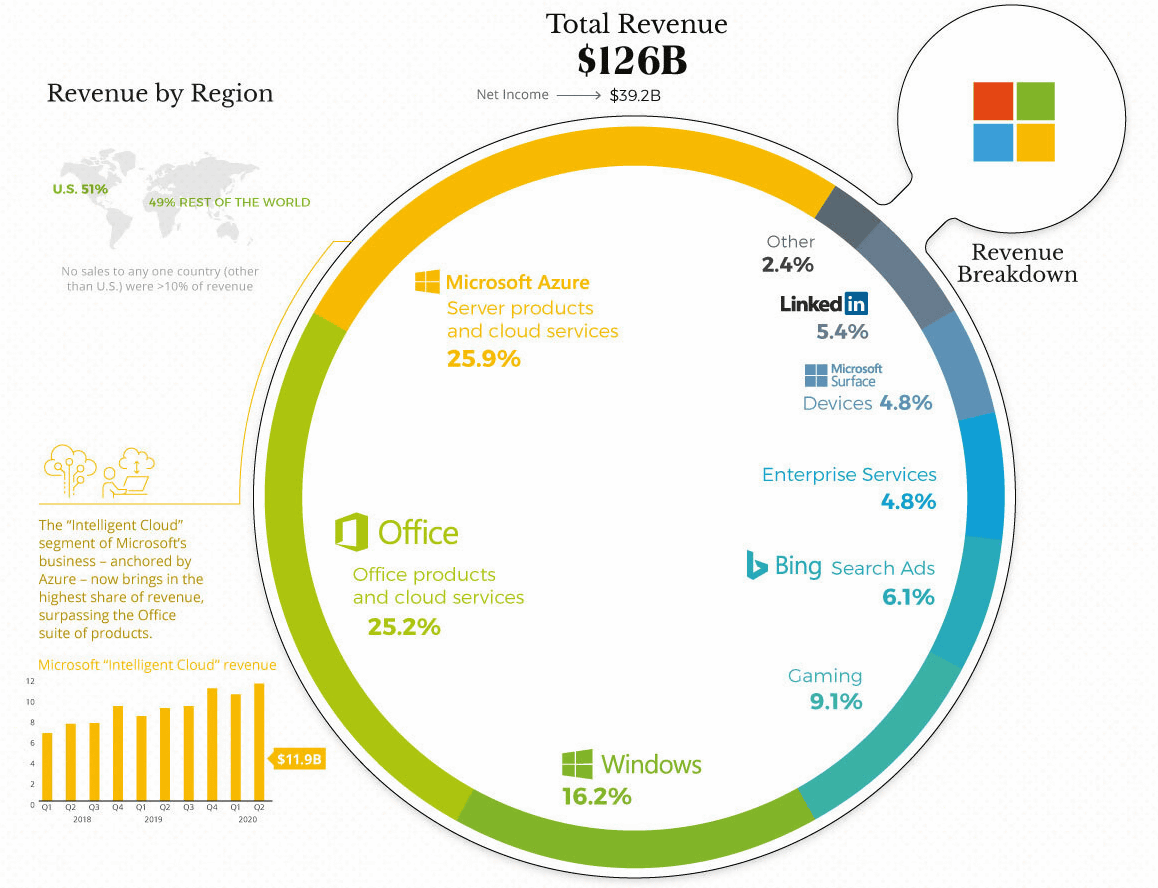
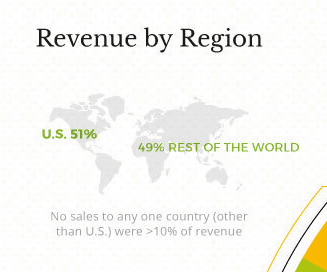
Sales by region are half in the US and 49% in other regions.
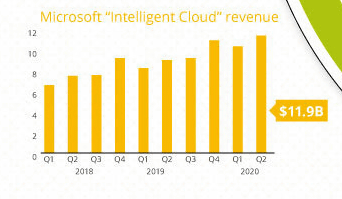
I think that Microsoft's revenue is mainly Windows and Office, and now

Graphing the revenue from intelligent cloud every quarter from 2018 is like this. You can see that the profit is steadily increasing.
And in the case of Facebook, the net income is 70.8 billion dollars (about 7.5 trillion yen) and the net profit is 18.5 billion dollars (about 2 trillion yen), 98.5% of the total is advertising revenue. The remaining 1.5% comes from revenue from payment services and the video chat terminal ' Portal TV '.
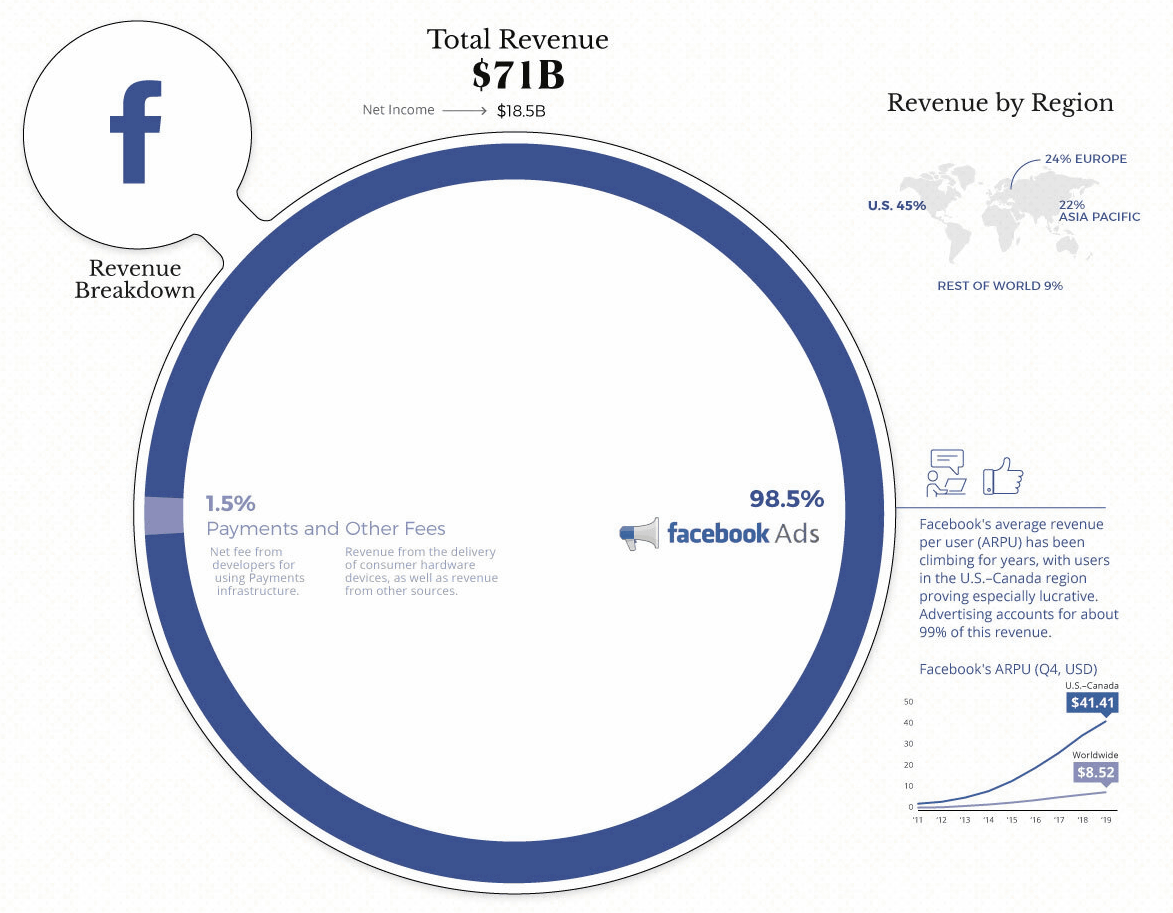
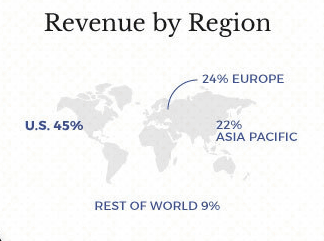
Looking at revenue by region, the United States is 45%, Europe is 24%, Asia-Pacific is 22%, and others are 9%.
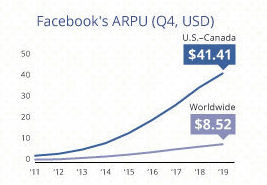
Facebook's average revenue per user has risen in recent years, especially in the US and Canada.
Related Posts:


in Note, Posted by darkhorse_log