'Zoom Earth' where you can check the typhoon's appearance with satellite images updated in almost real time
' Zoom Earth ' is a website where you can check the status of hurricanes and typhoons with satellite images in almost real time. Zoom Earth includes live satellite images from GOES , Himawari-8 and Meteosat , image data from NASA's GIBS and EOSDIS , map data from Microsoft's Bing Maps Platform and Esri , National Hurricane Center , Joint Typhoon Warning Center , IBTrACS , etc. It is created by getting typhoon information from the service.
Zoom Earth-View live satellite images
https://zoom.earth/
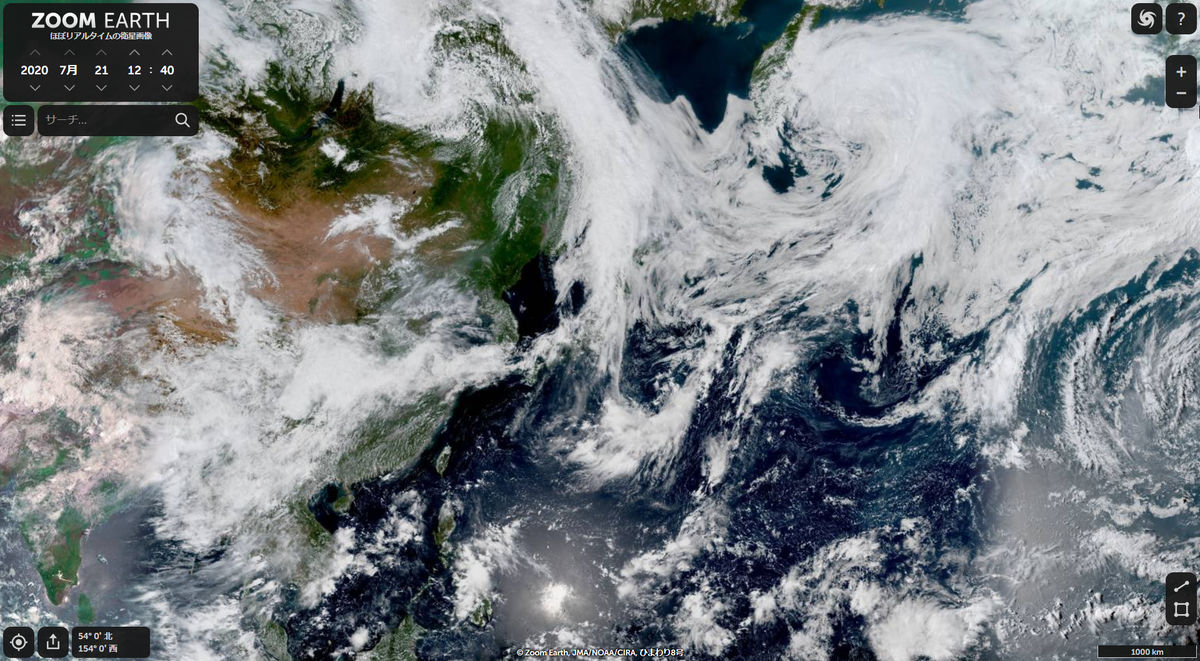
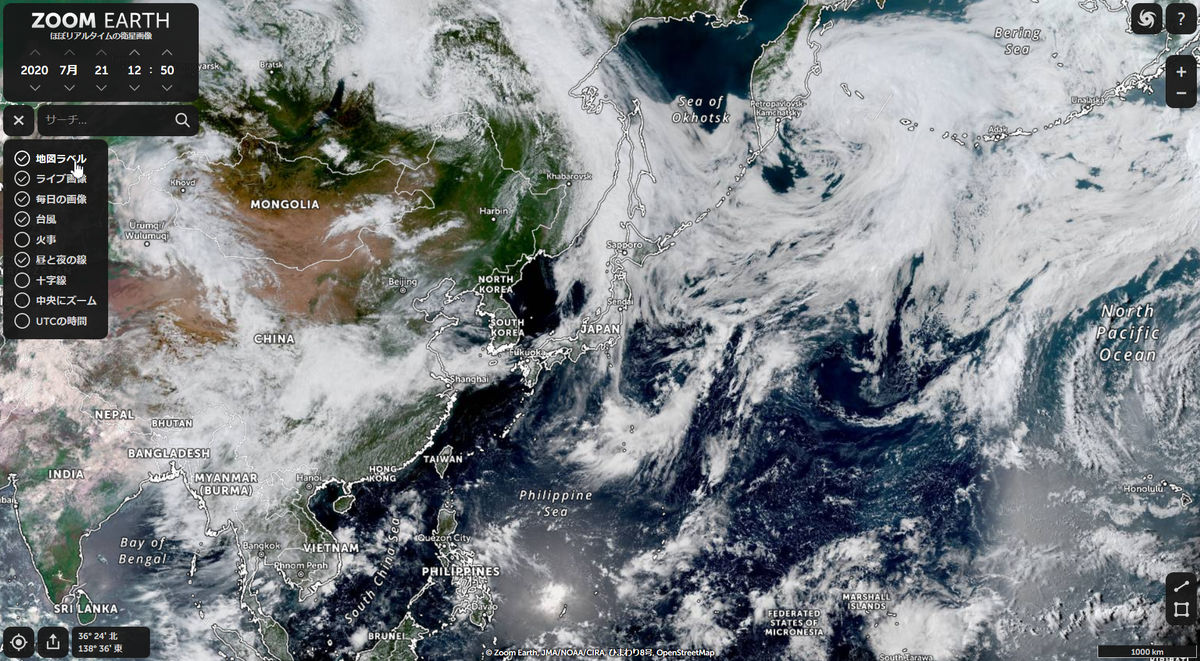
Zoom Earth is a website where you can check almost real-time satellite images like this.
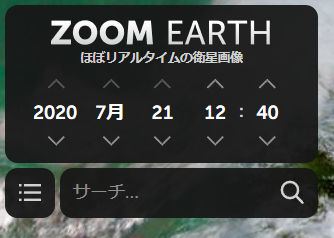
At the upper left of the screen is a search bar for searching the date and time when the displayed satellite image was taken and a specific place.
Click 'Settings' next to the search bar and select 'Map label', 'Live image', 'Daily image', 'Typhoon', 'Fire', 'Day and night line', 'Cross line', 'Zoom in center', 'UTC time'. Options such as '' are displayed. In the initial state, four live images, daily images, typhoons, and day and night lines are on. For example, if you click on the map label...
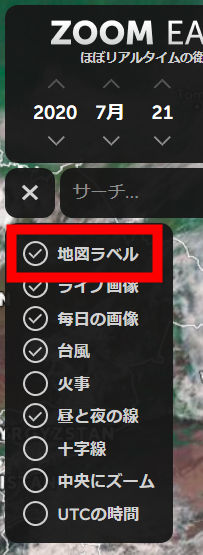
City names and borders are displayed on the map.
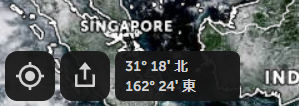
At the bottom left of the screen are buttons for using location information, buttons for sharing satellite images, and latitude and longitude information for the points displayed on the screen.
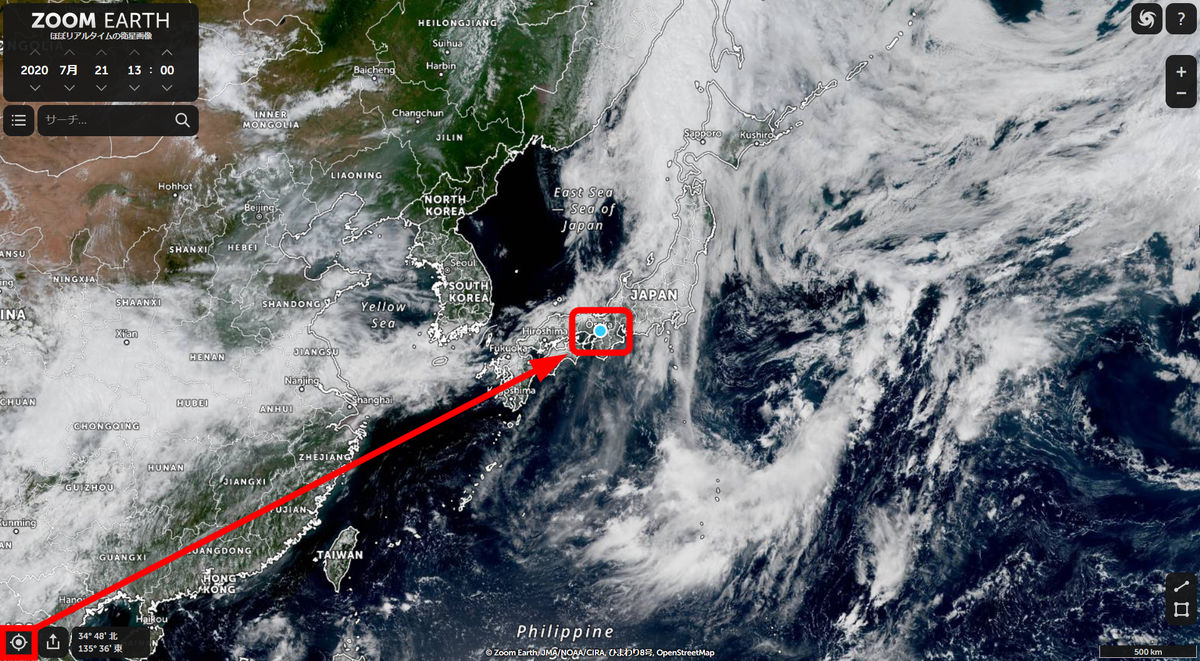
Click the location information button to display the current location as a blue dot on the map.
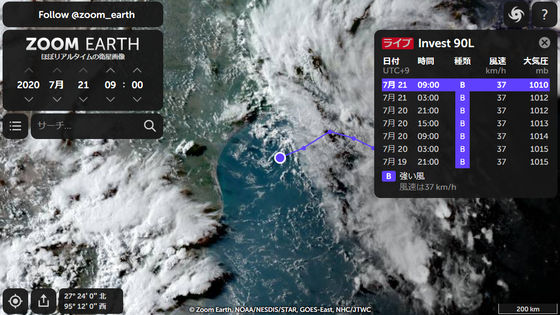
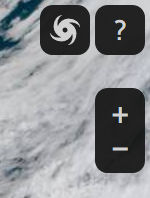
In the upper right corner of the screen are a typhoon button, a button for displaying details about Zoom Earth, and a button for enlarging/reducing the map.
When you click the typhoon button, the names of typhoons from the past to the present are displayed in a row on the screen.
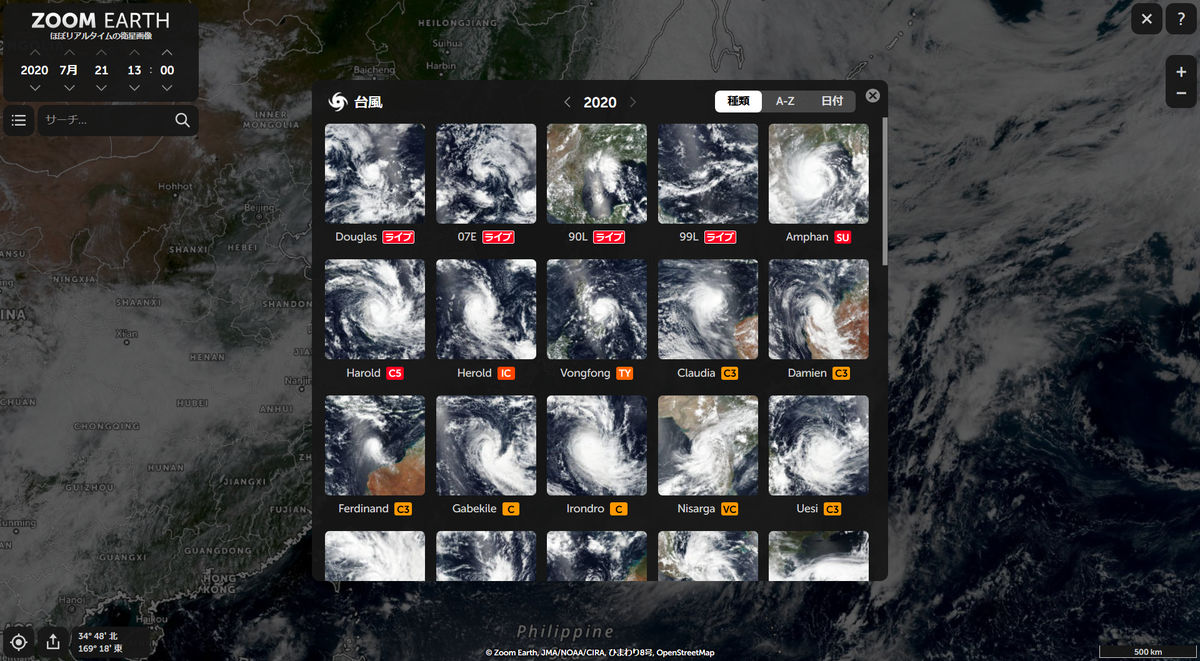
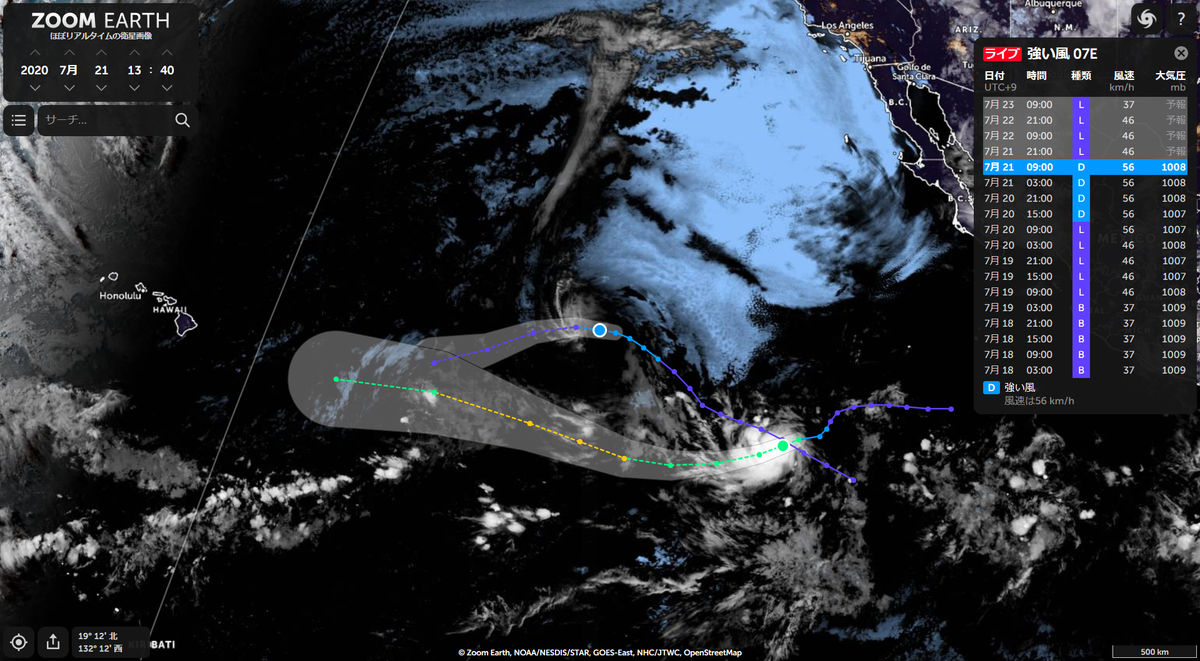
For example, looking at the state of tropical cyclone
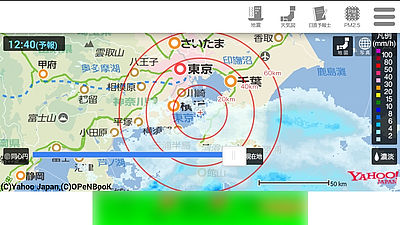
In addition, there are 'Measure distance' button and 'Measure area' button at the bottom right of the screen.
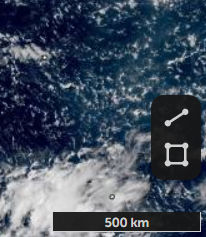
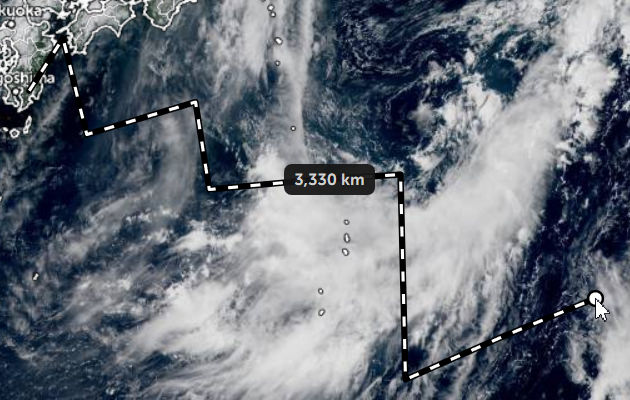
To use the 'Measure distance' button, just click on the screen multiple times. Distance can be measured in a polygonal line format.
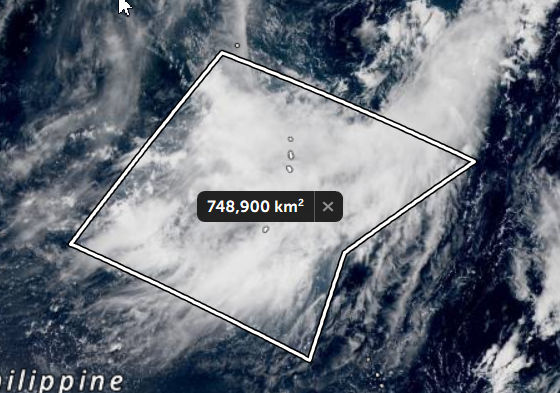
You can use the 'Measure Area' button to create a polygon by clicking on the screen multiple times. Since the area of a polygon can be measured, it is possible to measure the size of a typhoon.
Related Posts:
in Review, Web Service, Posted by logu_ii