Apple has released a graph showing how the movement of people in each city is decreasing, how much people are decreasing from cities in Japan compared to other countries?

Apple has aggregated user data in 63 cities around the world and released a graph showing how people's movement in each city is decreasing. It is possible to compare changes in human movement in various cities such as Tokyo, Osaka, New York, Milan, and Taipei during the period from January 13 to April 13.
Apple makes mobility data available to aid COVID-19 efforts-Apple
Tim Cook, Apple's CEO, said on April 15: `` While protecting user privacy, we help public health authorities understand how people behave in the community, as well as the new coronavirus infection (COVID-19 We'll share data on people's movements gathered from Apple maps to provide important insights to stop the). ”Post on Twitter.
While protecting your privacy, we are sharing aggregated mobility data from Apple Maps to help public health authorities learn how people travel in their communities and to provide valuable insights to stop the spread of COVID-19. Stay safe and healthy! Https: // t .co / Nok77HKIXN
— Tim Cook (@tim_cook) April 14, 2020
You can see how the movement of people in each city is changing from the following websites.
COVID‑19-Mobility Trends Reports-Apple
https://www.apple.com/covid19/mobility
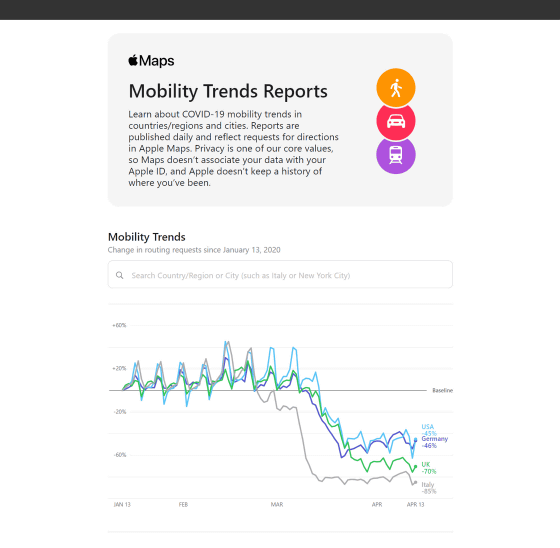
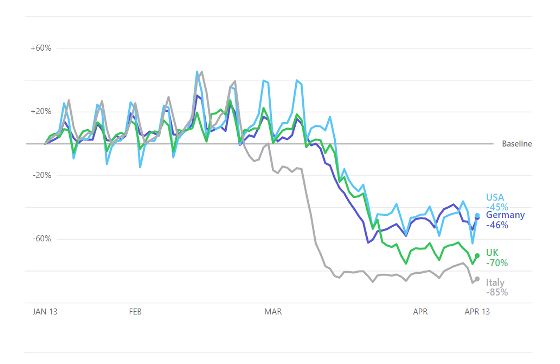
When you open the above URL, first you will see how the movement of people in the four countries of the United States, Germany, the United Kingdom and Italy is decreasing. Both have March as their turning points, with the US down 45% from baseline, Germany down 46%, the UK down 70%, and Italy down 85% as of April 13.
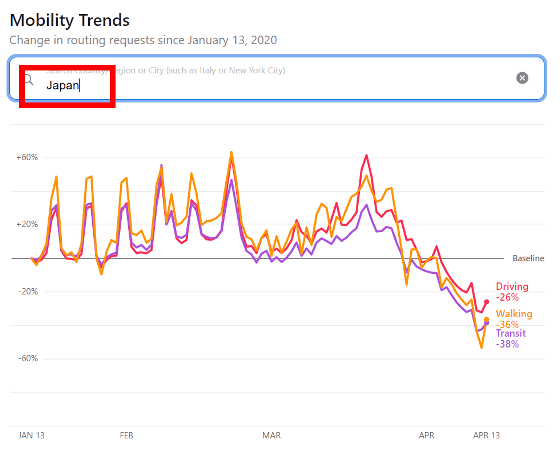
You can specify the country or city from the search field above the graph. When I searched Japan, the movement was small in early March, but increased in the latter half. After that, the graph gradually decreased, and as of April 13, driving decreased by 26%, walking decreased by 36%, and public transportation decreased by 38%.
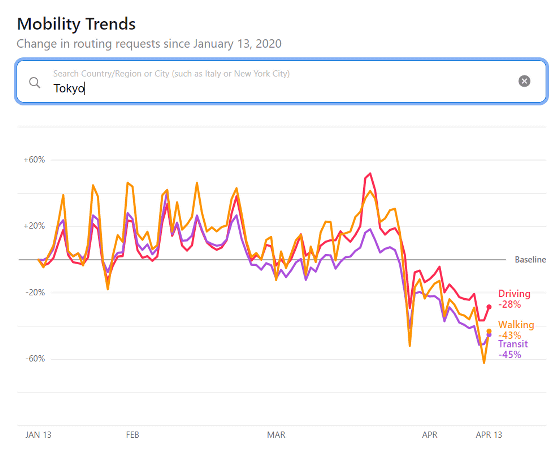
If the region is limited to Tokyo, the downward trend will become even more pronounced. Driving decreased by 28%, walking decreased by 45%, and public transportation decreased by 45%.
In Osaka, driving decreased 27%, walking decreased 44%, and public transportation decreased 44%.

Turning to cities around the world, New York City today saw 64% less driving, 81% less walking, and 87% less public transportation.

Milan, Italy, has 88% less driving and 91% less walking. Please note that public transportation is not available so it is not shown in the graph.

In the case of Paris, the capital of France, driving decreased by 86%, walking decreased by 91%, and public transportation decreased by 92%.

In Berlin, the capital of Germany, which is said to
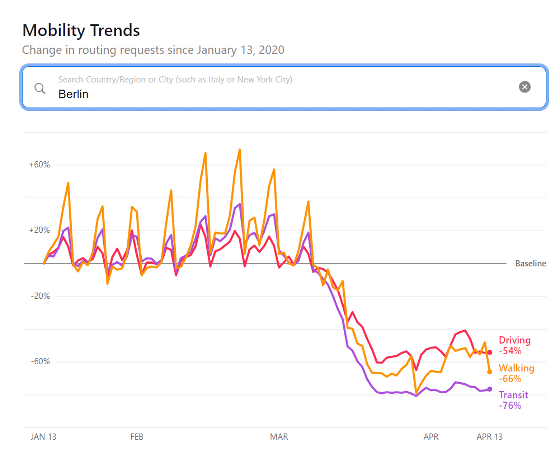
In addition

According to Apple, Apple's official map application does not link the user's movement data with the Apple ID, and the user's location information history is not stored in Apple. The information that the data came from is generated by counting the number of requests that users make to the map for directions. Apple emphasized that the data collected is associated with randomly assigned identifiers and is frequently reset, thus protecting user privacy.
Related Posts:
in Note, Posted by darkhorse_log


