A service 'QuickChart.io' that automatically generates various graphs simply by setting data by URL
Graphs are a big success when you want to express numbers, such as sales and temperature changes. It is a place where I want to use it in as many scenes as possible because I can understand whether it is going up or down at a glance compared to a table with simple numbers, but preparing a graph is troublesome. ' QuickChart.io ' is a service that plays an active part in such a situation, and I tried to actually use it because it is possible to freely generate an image of a graph simply by setting an appropriate URL.
Open Source Image Charts Replacement | QuickChart
https://quickchart.io/
There is no need to pre-register, etc. for use, and a graph image will be generated according to the information entered simply by accessing “ https://quickchart.io/chart?c= (graph information) ”. As it is an image, you can also specify it directly as the img tag source.
The information part of the graph is described in JSON format. This is simply represented as follows.
[code] {
type: '(type of graph)',
data: {(data used to generate a graph)}
} [/ code]
According to this format, prepare the following text, for example ...
[code] {
type: 'bar',
data: {
labels: ['1st', '2nd', '3rd', '4th', '5th'],
datasets: [
{
label: 'Dogs',
data: [50, 60, 70, 180, 190]
},
{
label: 'Cats',
data: [100, 200, 300, 400, 500]
}
]
}
} [/ code]
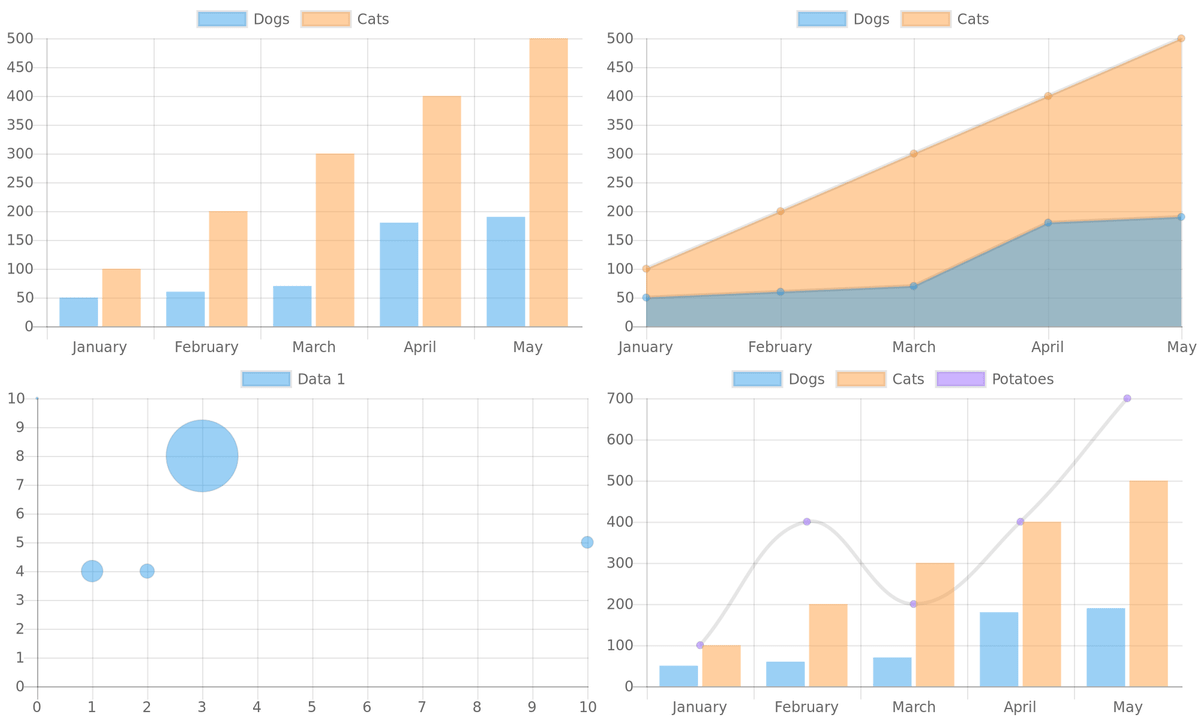
If you put this text in the 'graph information' part of 'https://quickchart.io/chart?c= (graph information)' and set it as the img tag source, it will be displayed as below.
In the above example, a bar graph was generated because type was set to 'bar', but if this type is set to 'line', a line graph will be generated.
In addition, radar chart and ... by making 'radar' ...
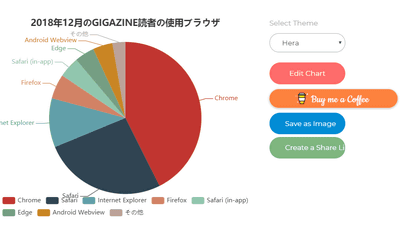
A pie chart can also be generated if it is 'pie'.
The other available graph types are:
・ Donut graph
·Scatter plot
・ Bubble chart
・ Meter
・ Sparkline
・ Mixed graph
After deciding what kind of graph to create in the 'type' part, next we will enter data in the 'data' part. Although the required elements differ depending on the type of graph, let's create a graph using a bar graph as an example. In the case of a bar graph, it is necessary to prepare “labels” as the label displayed below and “datasets” of actual numerical data, so the letters “A”, “B”, “O” and “AB” should be displayed on the labels. I set it and tried to set data named 'Group A'.
[code] {
type: 'bar',
data: {
labels: ['A', 'B', 'O', 'AB'],
datasets: [
{
label: 'Group A',
data: [5, 5, 3, 1]
}
]
}
} [/ code]
In addition to type and data, it is also possible to customize the appearance by preparing the item 'options'.
Unfortunately, you can not input Japanese, but you can easily embed the graph on the web page because you can prepare the necessary graph image just by changing the source of the img tag a little and save the trouble of generating the image at hand. It will be so. The official document makes it easy to understand what items can be set for each graph.
Related Posts:
in Web Service, Posted by log1d_ts