Good quality stories can be wrapped in a line chart

by rossyyume
Research on how the story depicted in movies and novels takes a configuration and how it is developed in a flow by analyzing the emotional arc of the character through the work and patterning it , Research on the story line common to big hit movies, etc. are announced. A movie that became one of the starting points for analyzing the "shape" of such a story is published on YouTube.
Kurt Vonnegut on the Shapes of Stories - YouTube
»A Novel Method for Detecting Plot Matthew L. Jockers
http://www.matthewjockers.net/2014/06/05/a-novel-method-for-detecting-plot/
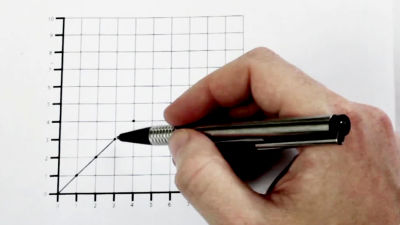
This movie was taken by a participant in a lecture by Mr. Kurt Vonnegut , an American novelist known for his books such as "Cat's Cradle" and "Slaughterhouse 5". When studying anthropology at the University of Chicago, Mr. Vonnegut focused on "the form of the story" and stated that "the basic idea is a story that can be drawn on graph paper".
In the movie, Mr. Vonnegatt first draws a vertical axis indicating better situation going upwards, bad situation going down. If it is sick or poverty the graph goes down, if it is wealthy or full of energy on the contrary the graph goes up.
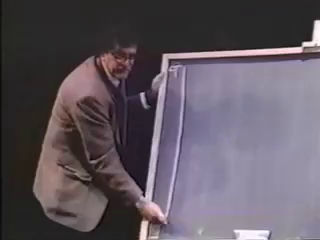
The horizontal axis shows the passage of time from the beginning to the end.
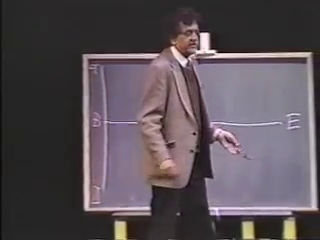
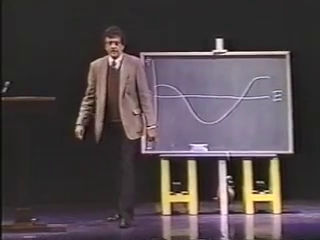
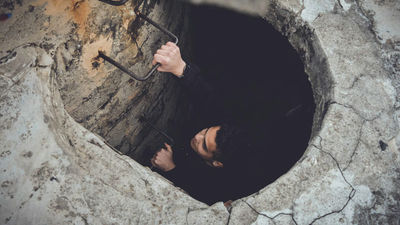
Mr. Vonnegatt touches on the "man in the hole" pattern that will later be discovered as "a story line common to huge hit movies". You can see a simple pattern that turns upwards by overcoming the problem, with the graph facing downwards in some trouble. Mr. Vonnegut also insists that "This story tends to be loved, and there is nothing to be tired of".
Professor Matthew L. Jockers who analyzes literature data at Washington State University points out the foresight of Mr. Vonnegut's research. Professor Jockers is involved in a project to apply emotion analysis tools and techniques to fictional works, and he notes that Mr. Vonnegut's movie is that he can think about the analysis result by superimposing it on the movement of the plot of the story is.
In his research, Professor Jockers analyzed his works "Portrait of a young artist" by Irish novelist James Joyce , known for "Ulysses", with a computer and graphed the movement of emotions.
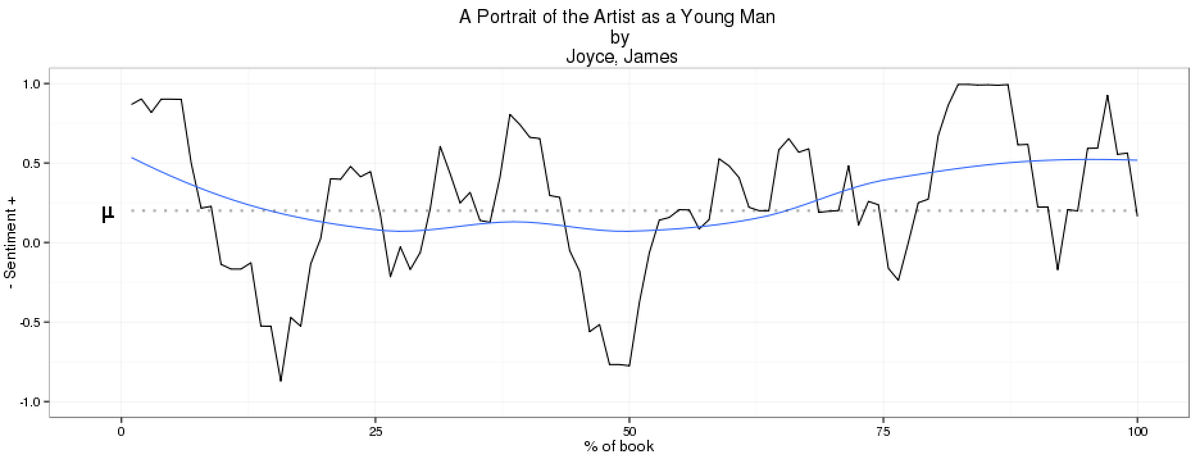
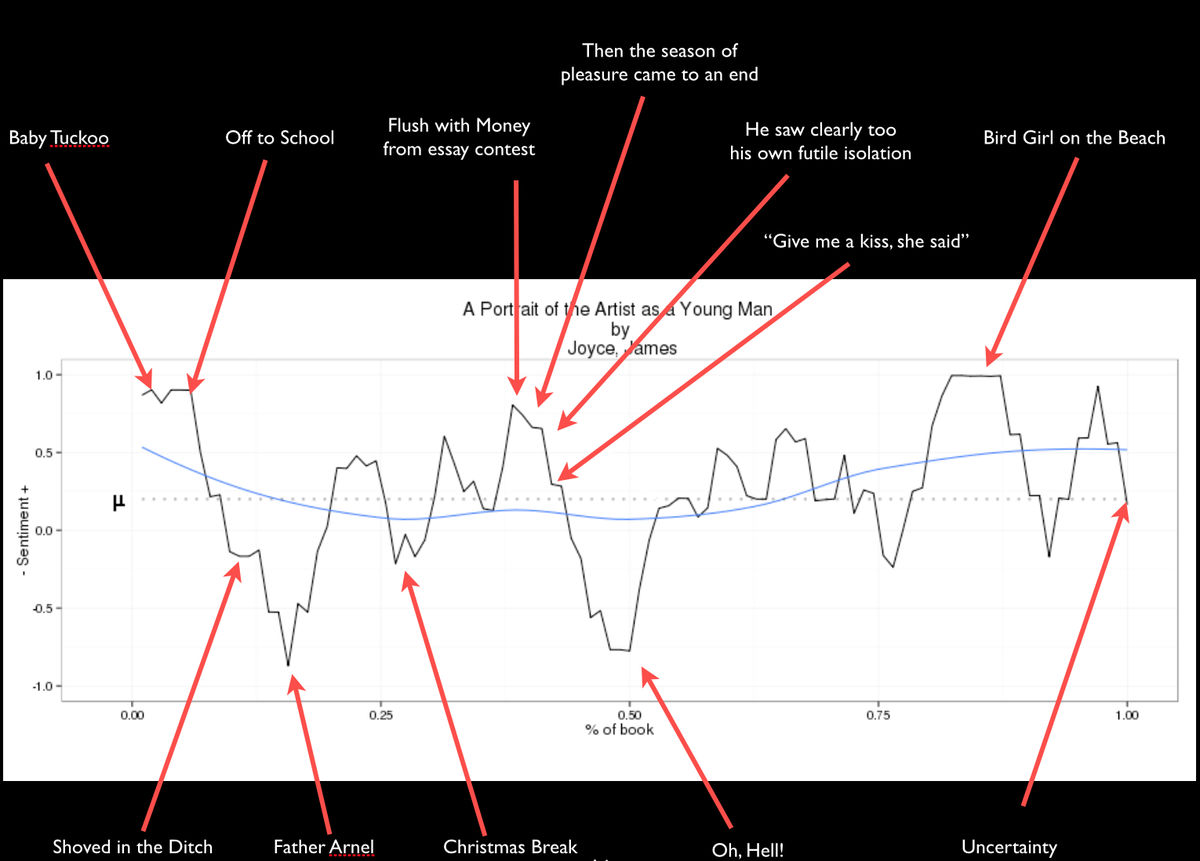
The following is an annotation to what kind of expansion was made in the part which is the point of the graph. Professor Jonkers insists that if you know the flow of the work it is an accurate graph that you can see at a glance.
Mr. Vonnegut's assertion that "a well-made story can be raised on a graph" may be thought of as "if you want to create a good story you should try to plot the plot" if you reverse it. Also, from the research of Professor Jockers, you can see that the emotional baselines are necessary for stories that can happen in graphs. When trying out this "plotting of plot", such as when the story I made is felt bored somewhere when it is deadlocked as to what kind of development it is to create by creating a story, something breakthrough You should be able to find out.
Related Posts:


in Note, Posted by log1e_dh