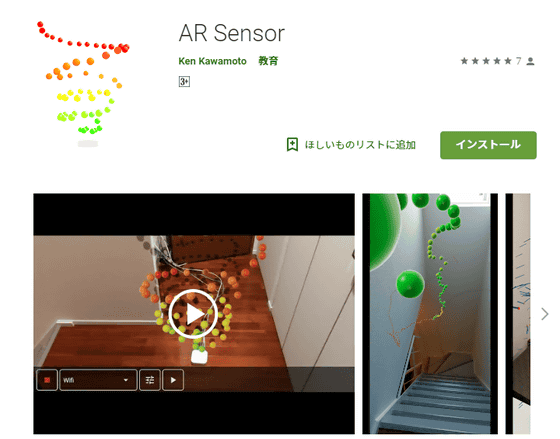
I tried using 'AR Sensor' which visualizes invisible data such as radio field intensity of the Wi-Fi and magnetic field / atmospheric pressure by AR

A tool " AR Sensor " to visualize everyday spatial data invisible to the eyes, such as radio field strength and magnetic field of Wi-Fi, LTE, Bluetooth, by projecting it on the AR was released, so I actually tried it .
AR Sensor - Apps on Google Play
https://play.google.com/store/apps/details?id=com.ken.arsensor
It was "Ken Kawamoto" who made "AR Sensor". According to the blog, the original production purpose was "to solve the homicious troubles" I want to keep the origin of the smell of the drainage mouth flowing from anywhere in about one week "," While using it I noticed that it is useful + educational when applied to various data that can be measured with smartphones such as Wifi and magnetic field, I released it as a versatile application. "
Created "AR Sensor" to visualize invisible spatial data - Laboratory of Kawamoto
https://kenkawakenkenke.hateblo.jp/entry/2019/01/05/231346
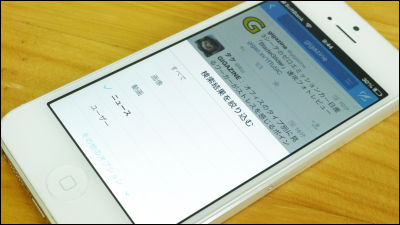
Since the application is released for Android for free, search and install "AR Sensor" on Google Play. By the way, the corresponding terminal is said to be Google Pixel 3 and Android 8.0 or higher, and it will not appear on Google Play search results on Android 7.0 device.
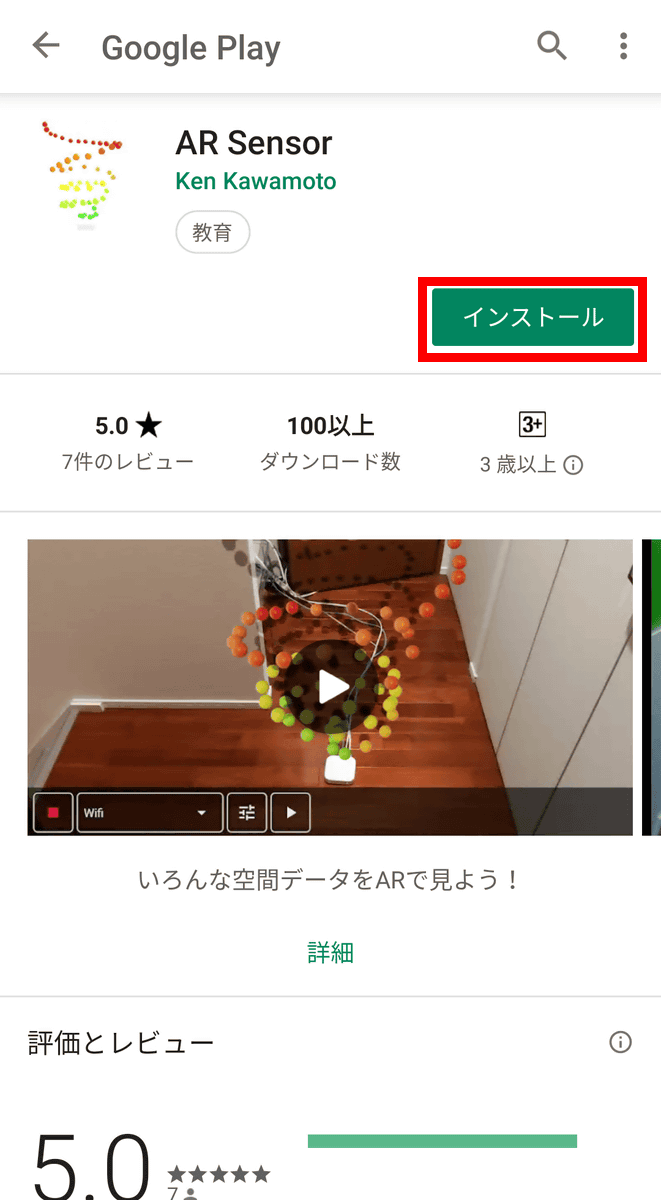
After installation, tap "Open" to start up

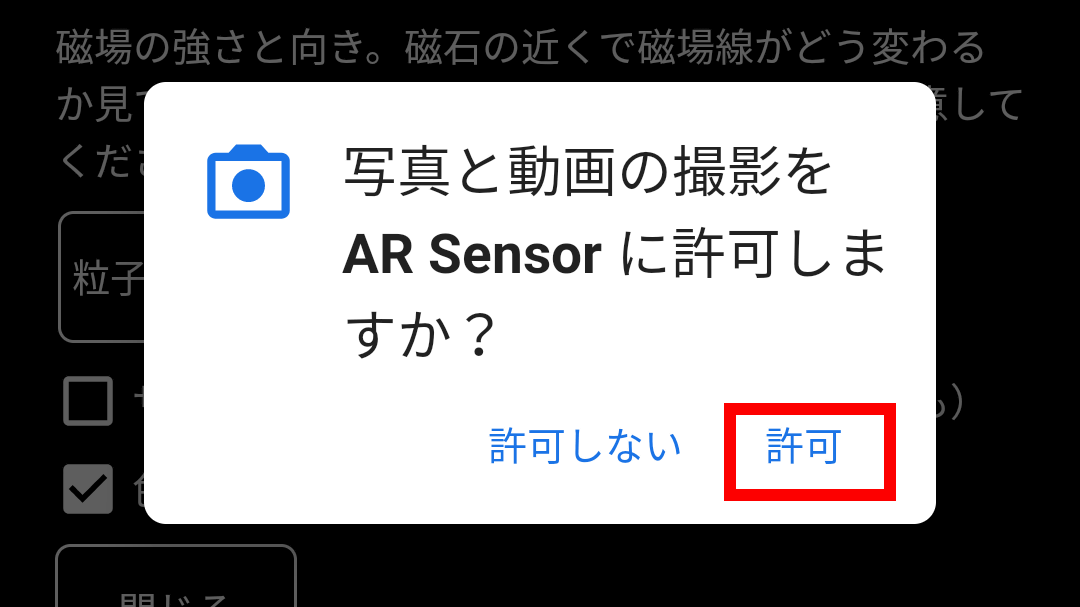
Tap "permission" so you can ask photography permission for photos and movies
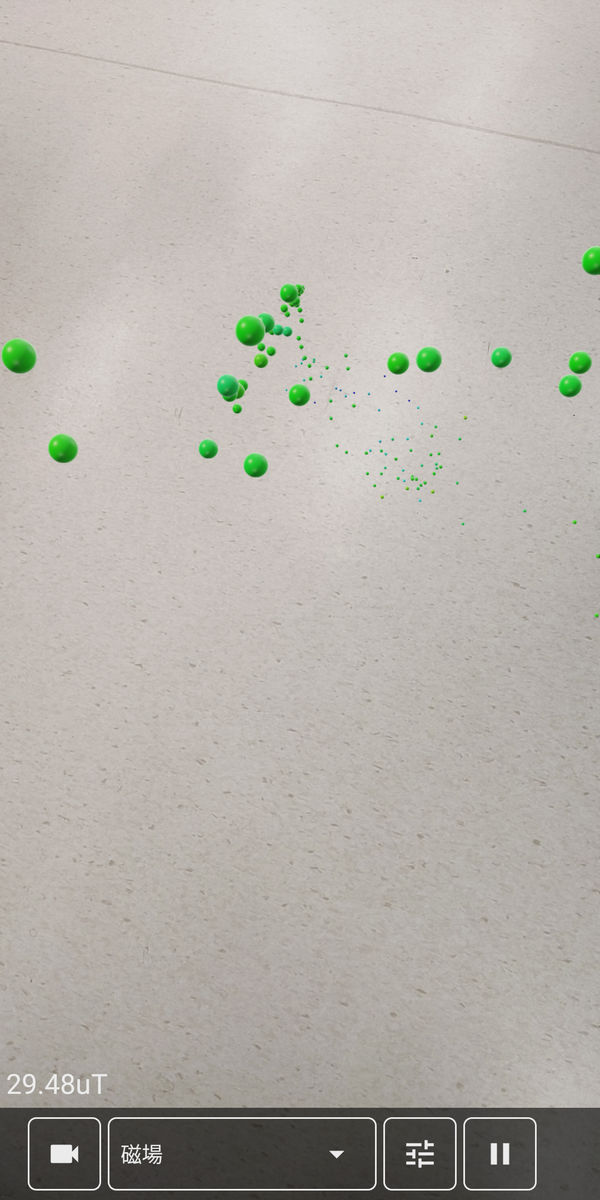
By default, "magnetic field" is selected, so tap "Close". By the way, "Dynamically update colors" which is checked by default is a function to "adjust the points so that the measured points are" good feeling "from green to red, so unnecessary people check please remove.
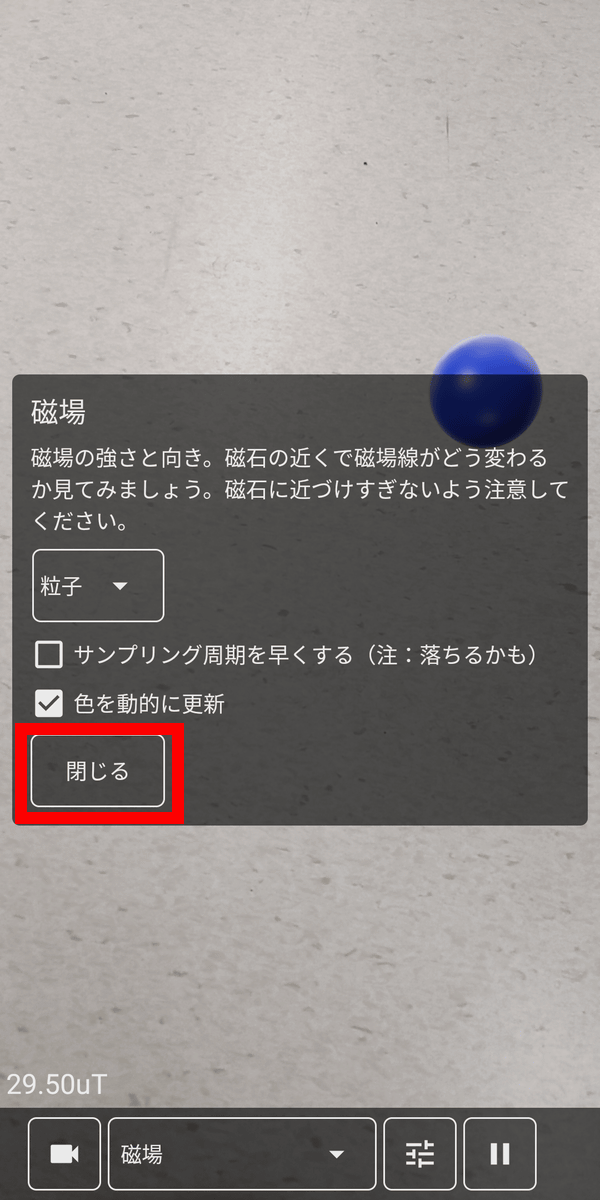
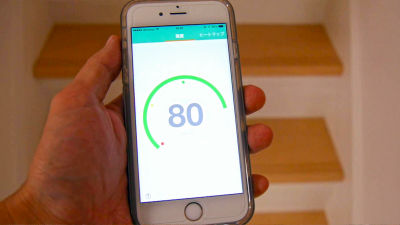
The magnetic field around the terminal is shown.
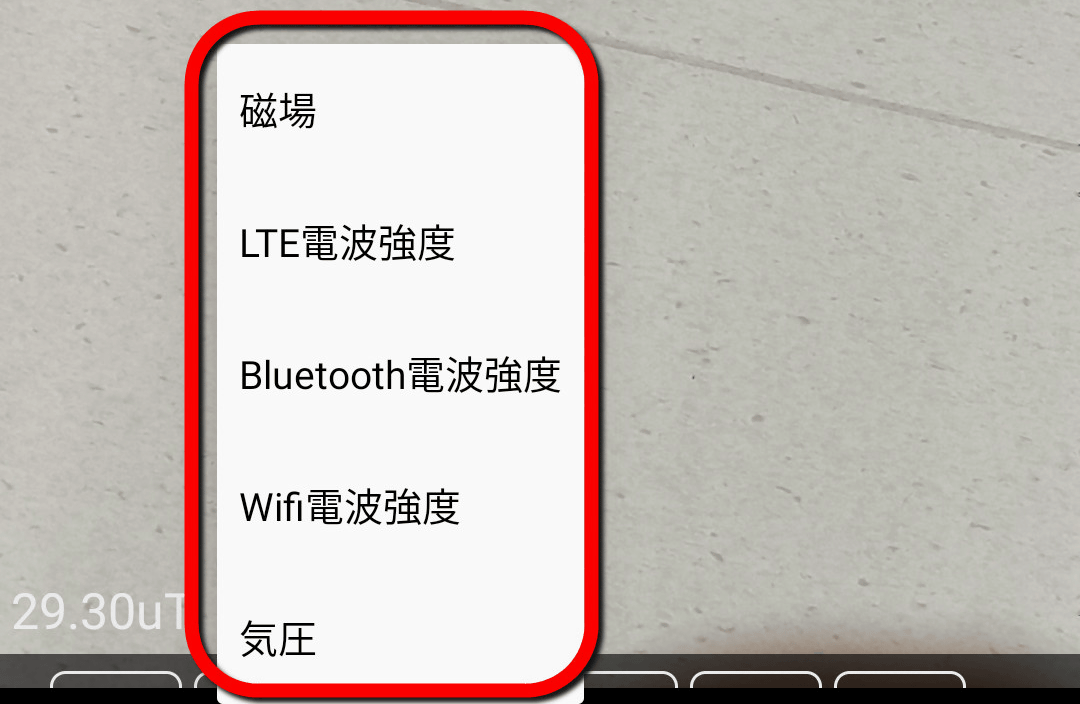
In addition to "magnetic field", "LTE radio wave intensity", "Bluetooth radio wave intensity", "Wifi radio wave intensity" "barometric pressure" can be visualized.
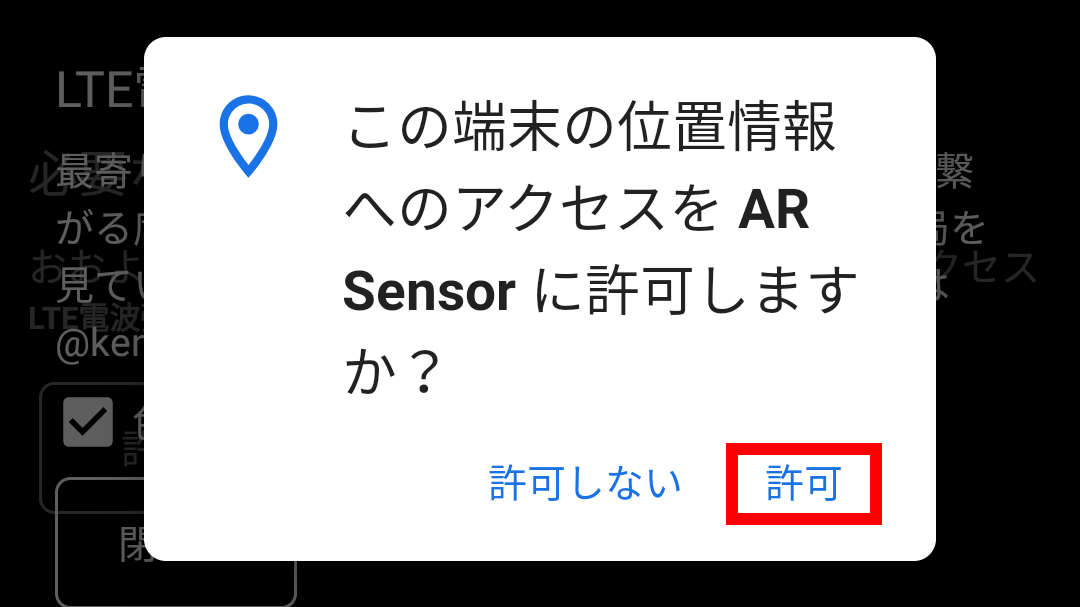
For visualization of LTE radio field intensity, access to location information is required, so tap "permission".
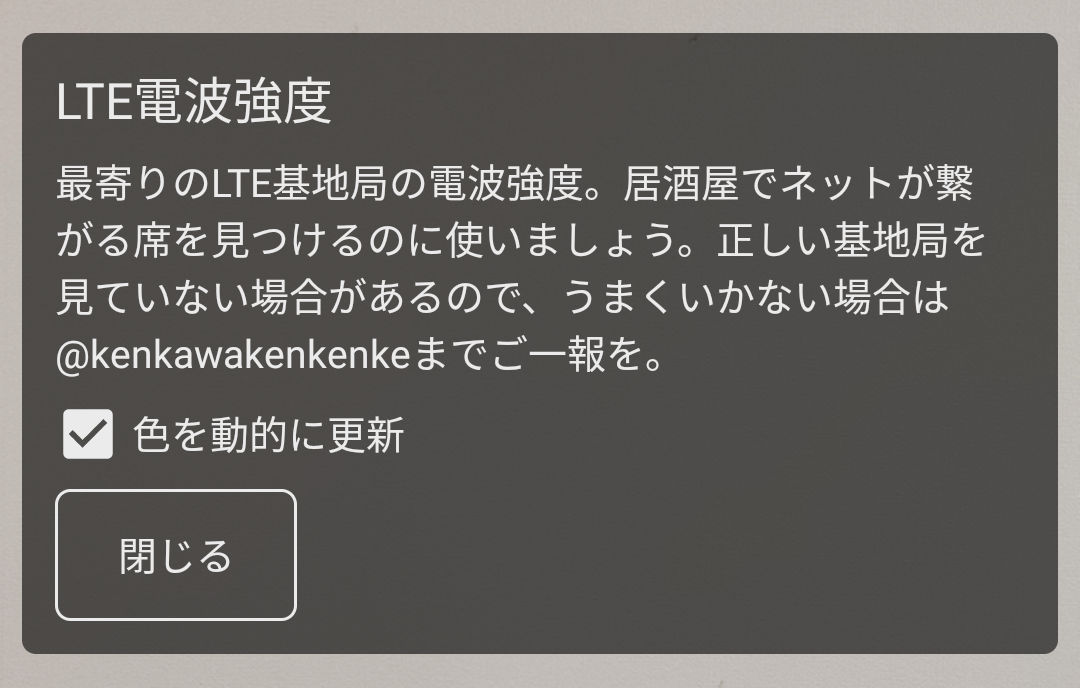
"LTE radio intensity" displays the radio field strength of the nearest LTE base station. "I will use it to find the seat where the net is connected at a pub."
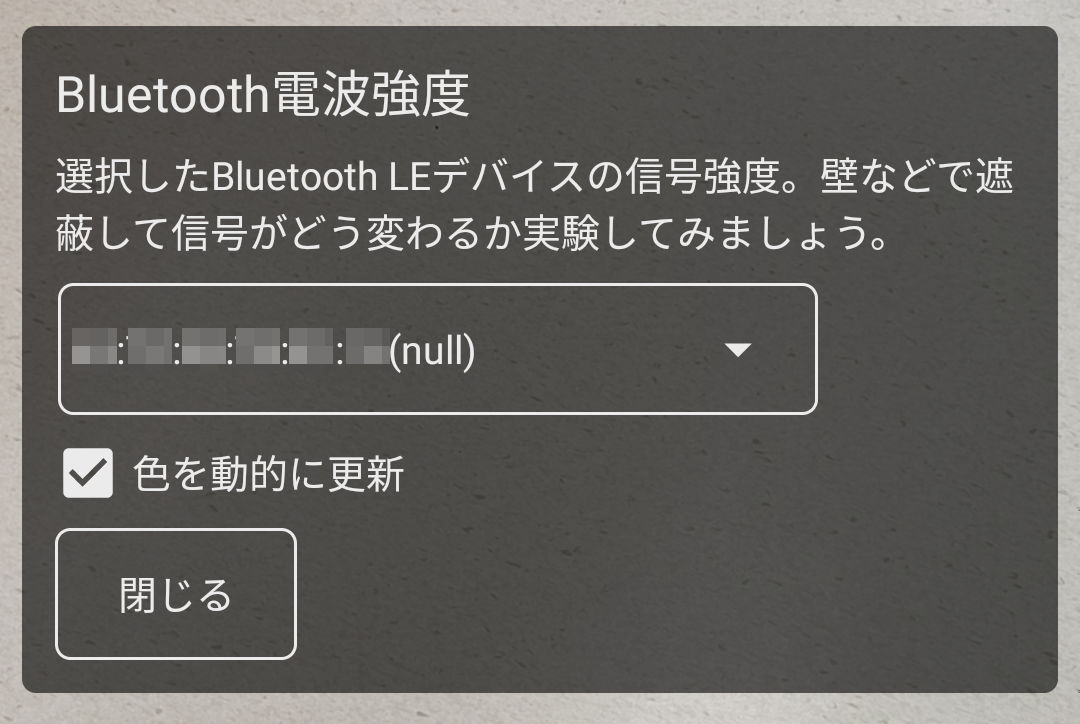
"Bluetooth radio intensity" displays the signal strength of the selected Bluetooth LE device.
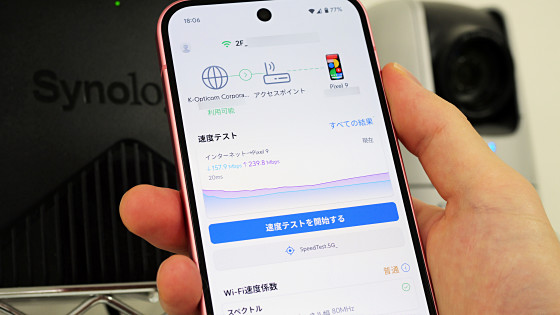
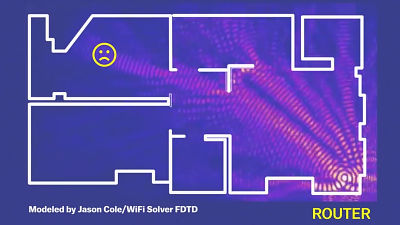
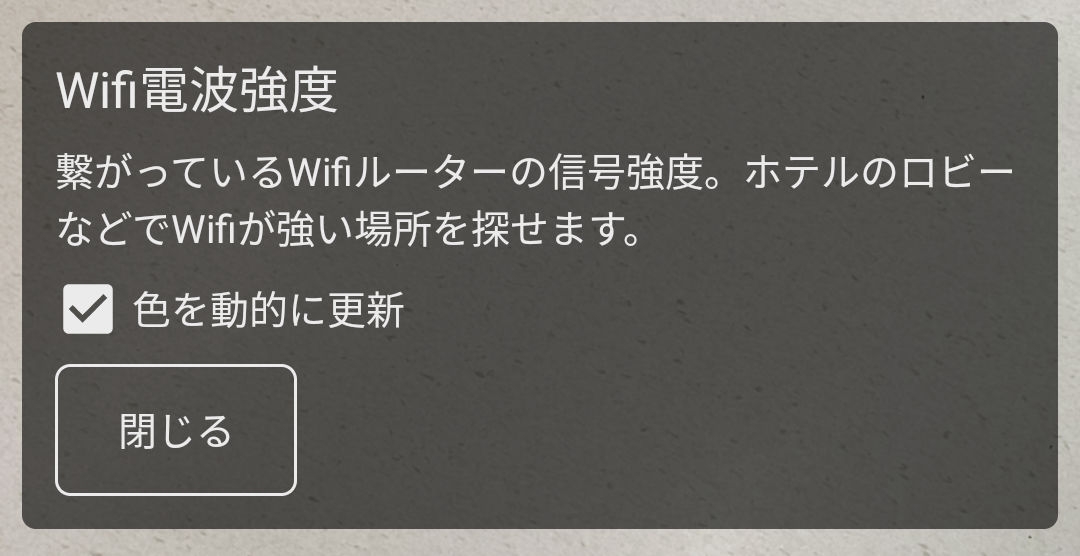
"Wifi radio intensity" displays the signal strength of the connected Wi - Fi router.
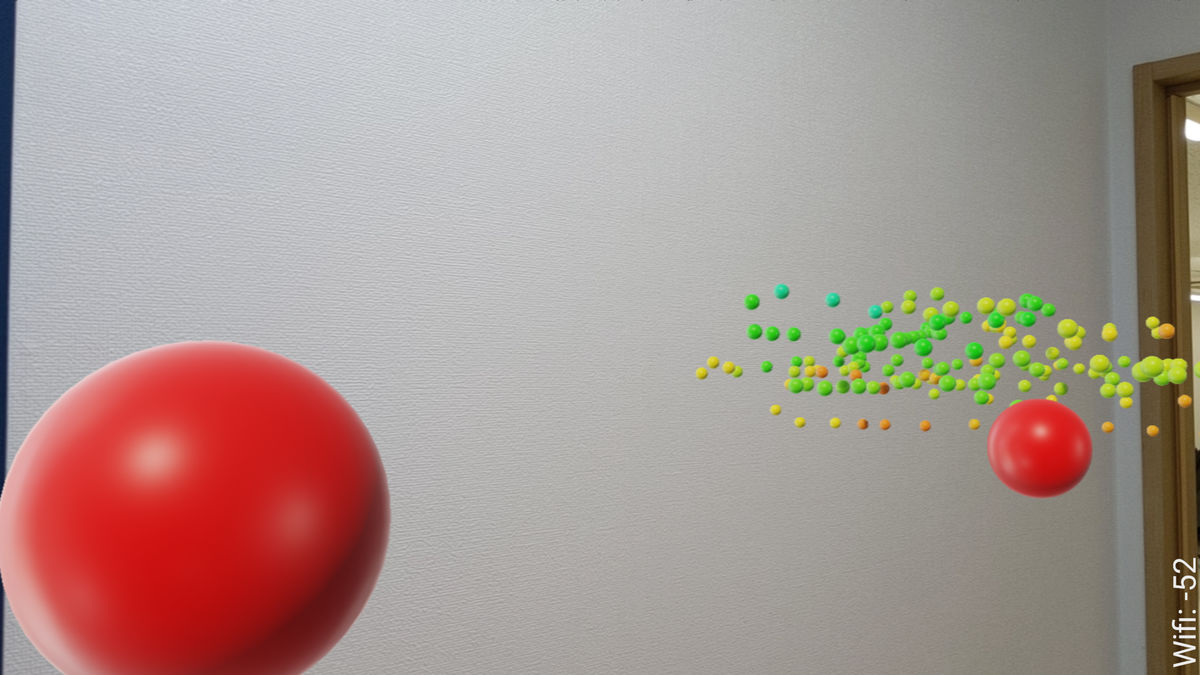
It looks like this when actually examining the radio field intensity at the terminal. Markers that show the radio field strength in color appear in front of the terminal one after another. Green indicates that the radio wave is strong and red is weak. Since this movie was taken with the recording function of AR Sensor, anyone can easily take similar movies.
I checked the indoor WiFi radio intensity with 'AR Sensor' - YouTube
Left side of the screen, the black appliances full of antennas visible on the other side of the marker are Wi - Fi routers. I wandered around near the router while walking backwards and it looked something like this.

As AR (augmented reality), the marker remains displayed even if the router is on the other side of the wall.
If you lose sight of the marker it will be automatically initialized, so please move the terminal slowly if you want to float a large amount of markers.
Related Posts: