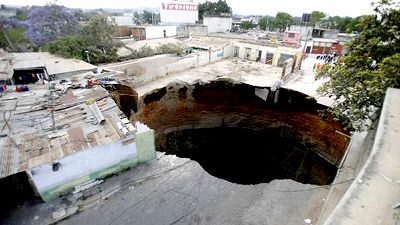
"Ground support map" where you can see information such as hardness of the ground and disaster risk at a glance free of charge
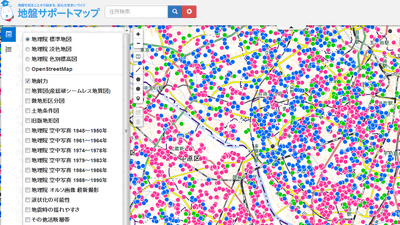
Japan Home Shield (JHS), which handles ground surveys and building inspections,Ground survey and analysis results 1 million building appreciation campaignAs visual information of the ground information of the whole country and natural disaster information etc on the map as "Ground support map"Is released free of charge.
Ground support map
http://jhs.supermap.jp/
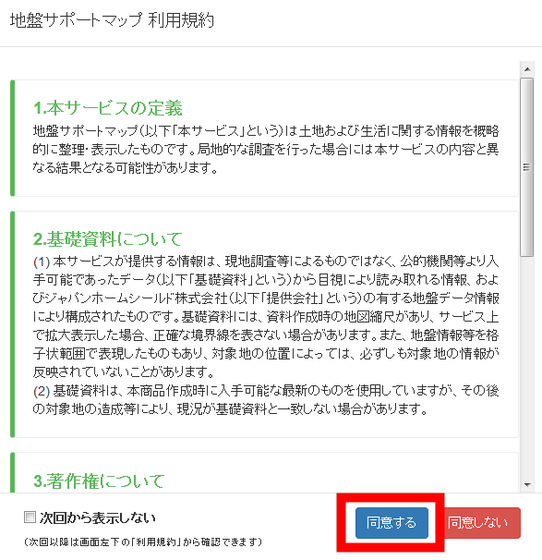
When you open the URL of the above ground support map, the terms of use will be displayed, so please check the contents and click "I agree".
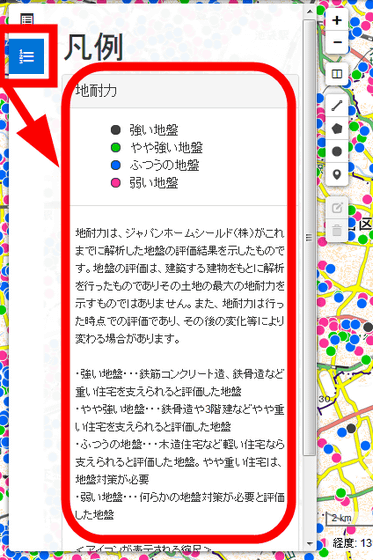
Then you can see the "ground support map" which is full of colorful circular marks on the map and narrowed down. This circle represents "ground strength" of the ground and black can support heavy housing such as reinforced concrete construction and steel frame constructionStrong ground"Green can support somewhat heavy housing such as steel frame and 3 stories"Slightly strong ground"Blue supported by light housing such as wooden housesOrdinary ground"Pink is required for some kind of soil"Weak ground"Is shown.
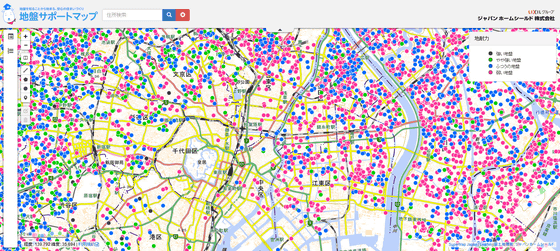
By clicking the explanation button on the upper left of the screen, you can read the detailed explanation about the ground tolerance. "The ground tolerance is one that shows the evaluation results of the ground analyzed so far by Japan Home Shield."
In addition, from the menu button on the upper left, you can select the type of map and data to display on the screen. By default, "Geographical center map" is displayed.
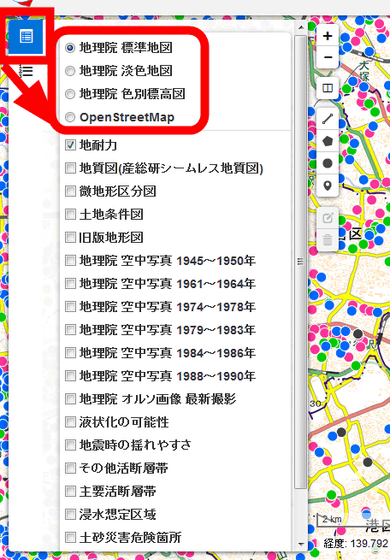
"Geographical coordinates pale color map" makes the color of roads and railroads thinner, making the mark of ground strength prominent easier.

"Geographical chart by geographical coordinates chart" displays the elevation of the land in a color-coded manner.

"OpenStreetMap" is map data of open data "OpenStreetMap"using.

In addition, you can choose from 20 types of data to display on the map, such as "ground tolerance", "geological map", "potential liquefaction", "ease of earthquake shake", and multiple selections are also possible.

When "ground tolerance" and "inundation assumed area" are displayed on the "geographical standard map", it is like this. It is understood that along the river there are many areas that are evaluated as "weak ground" and the depth of flooding is "2.0 m or more and less than 5.0 m".

When you enter an address in the search box at the top of the page, navy pins are dropped at the searched place, and you can also know the state of the land at pinpoint.

On the left side of the screen are convenient function buttons. "+" And "-" buttons can zoom in and out the map.

You can zoom out and see the whole of the Japanese archipelago, but information such as ground tolerance is not displayed.

When clicking on the note button, the map was split horizontally and the map of the same place was displayed on 2 faces.

By turning on the screen division function, you can compare the information by displaying different data on each of the left and right maps.

If you use the drawing function, draw a circle with a radius specified ......

You can draw polygons.

In addition, the ground support map can be viewed from smartphones.

Related Posts:
in Web Service, Posted by darkhorse_log
