When you try visualizing data on alcohol, such as the week with the most drunk person in a year, it becomes like this

By▓▒░ TORLEY ░ ▒ ▓
Year-end and New Year holidays with year-end party and New Year's party inevitably tend to increase the opportunity to drink alcohol. It is said that opportunities to drink alcohol will increase or decrease depending on seasons and events in the United States, not in Japan,BACtrackConducted a survey on alcohol and the results are disclosed.
BACtrack Breathalyzers
http://www.bactrack.com/pages/bactrack-consumption-report-winter-2014
The days of the year when Americans are most drunk, visualized - The Washington Post
http://www.washingtonpost.com/blogs/wonkblog/wp/2014/12/20/the-days-of-the-year-when-americans-are-most-drunk-visualized/
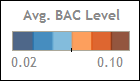
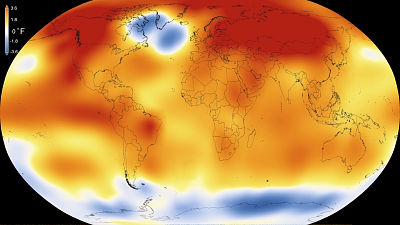
BACtrack analyzed the data of 300,000 people collected from users of BAC (breath alcohol concentration) measurement application developed by the company and examined the average BAC per day from December 2013 to December 2014 . For a color that represents the average BAC value in infographics, the average value increases as red or brown.
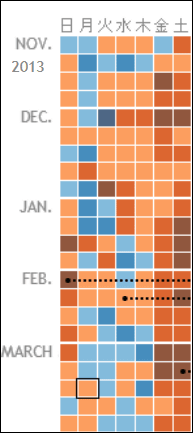
According to a survey by BACtrack, from December 2013 until March, the average BAC 0.07 or more days are more than 6 out of a week, it seems just right for the drinking season, and on the weekends it will be You can see that brown is increasing. In the second week of February there is Valentine's Day, the week when the average BAC is the highest among the year. Furthermore, during the second week of MarchSt. Patrick's DayThere are also many opportunities for Americans to drink in February and March.
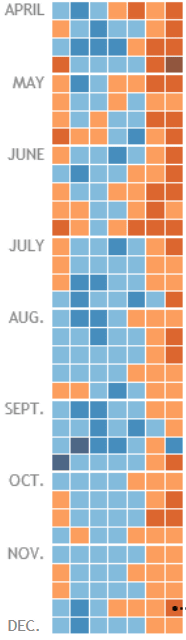
From April to November, we can see that the average BAC is kept lower than the drinking season on both weekdays and weekends.
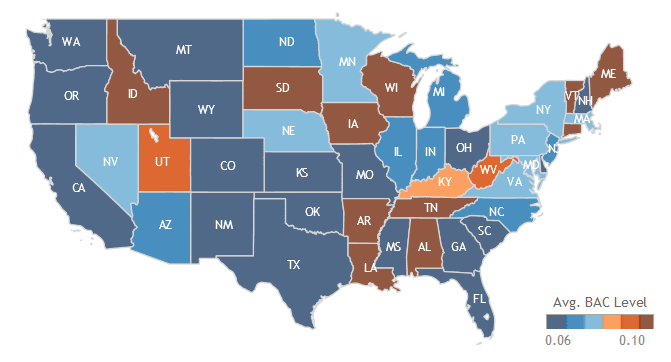
This is an infographic graphic representative of the average BAC in each province in December 2013, showing that the average BAC of the states in the central and northeastern US is high and on the west coast the state with low average BAC is conspicuous.
Here is the chart of the number of alcohol related news from 1990 to 2014. Alcohol related news began to increase since 1999 and reached its peak in 2013, although it occasionally shows a decline.

Graphical representation of the average number of alcohol news from 1990 to 2014 in each month shows that there are the most news on alcohol in July when the average temperature starts to rise. Next to July it is August, followed by December. In the drinking season where the average BAC is high, there are not many months in which news on alcohol is going far beyond December.

Related Posts:


in Note, Posted by darkhorse_log