`` Salar.ly '' that makes it possible to fully understand the salaries and occupations of people working at famous companies

By
Salary data for foreign workers who applied for an American work visa is published on the United States Department of Labor website, which used about 1.2 million applications for work visas from 2009 to 2013. “ Sarar.ly ” is a website that can solve the question “Which salary can be earned for what type of job at which company?” . You can see at a glance how much salary the people working in various famous companies around the world are getting, and you can easily find out what kind of job people worked in which region.
salar.ly | Main
http://www.salar.ly/
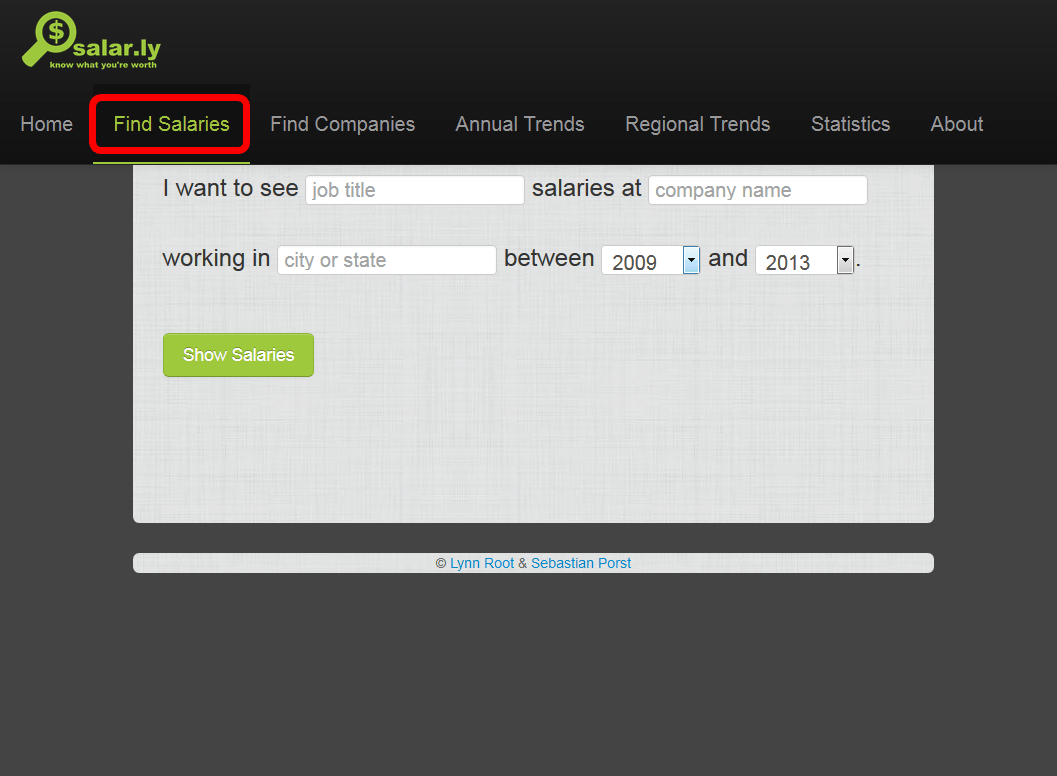
“Salar.ly” has four search pages.

One of them is “Find Salaries”, where “job title”, “company name” and “city or state” are entered, so that the specified job type / company within the period.・ You can see salary data of people who worked in place names.
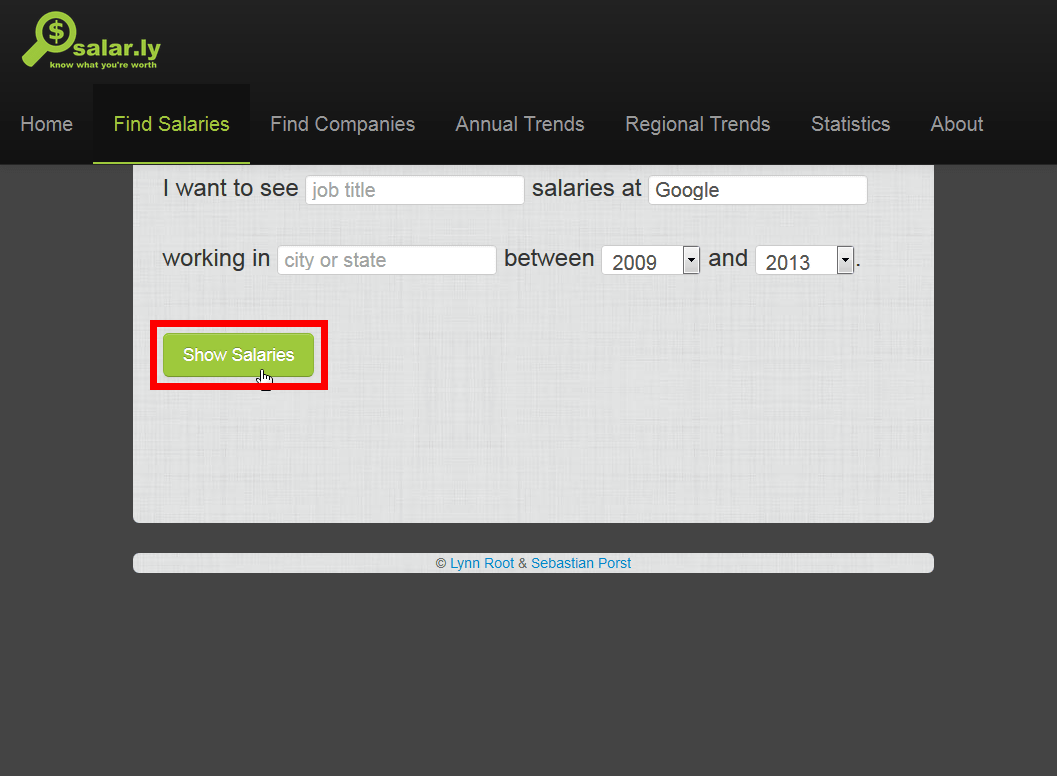
Just enter “Google” and click “Show Salaries”.
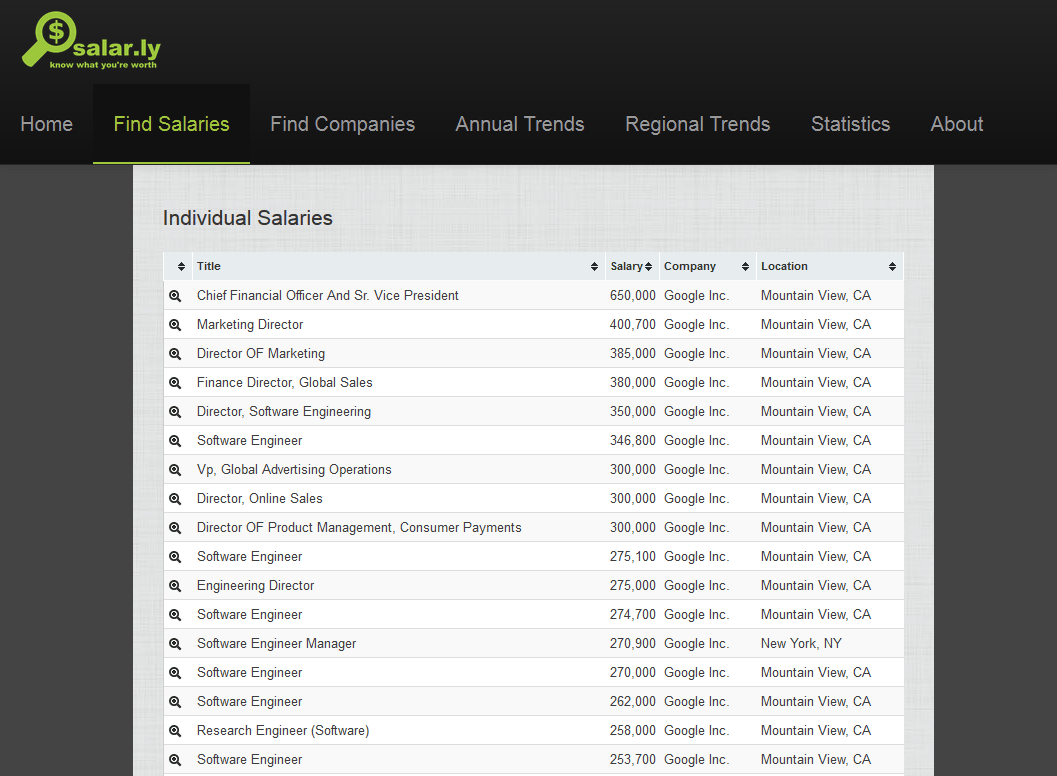
Then, salary data of foreign workers who worked at Google from 2009 to 2013 was displayed in a graph and text format.

If you place the mouse cursor on the graph like this, you can see detailed data. The most paid foreign worker who worked at Google from 2009 to 2013 was the person who served as chief financial officer and vice president, $ 650,000 per year (about 71 million yen) ) Seems to have received.
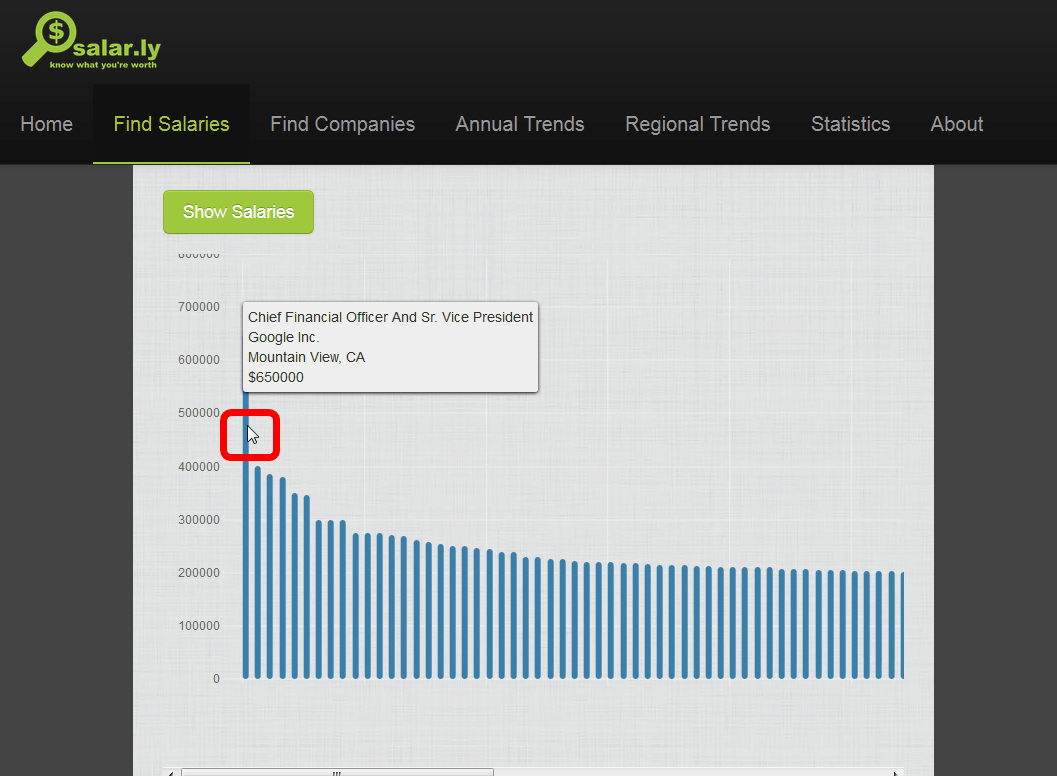
The person with the lowest salary receives $ 42,204 (about 4.6 million yen) annually, Google's average salary is $ 121,500 (about 13.25 million yen), the median is $ 116,000 (about Standard deviation is about 31,000 dollars (about 3.38 million yen).

Data is also displayed in the text base, and these can be sorted by name, salary, company name, and land name.
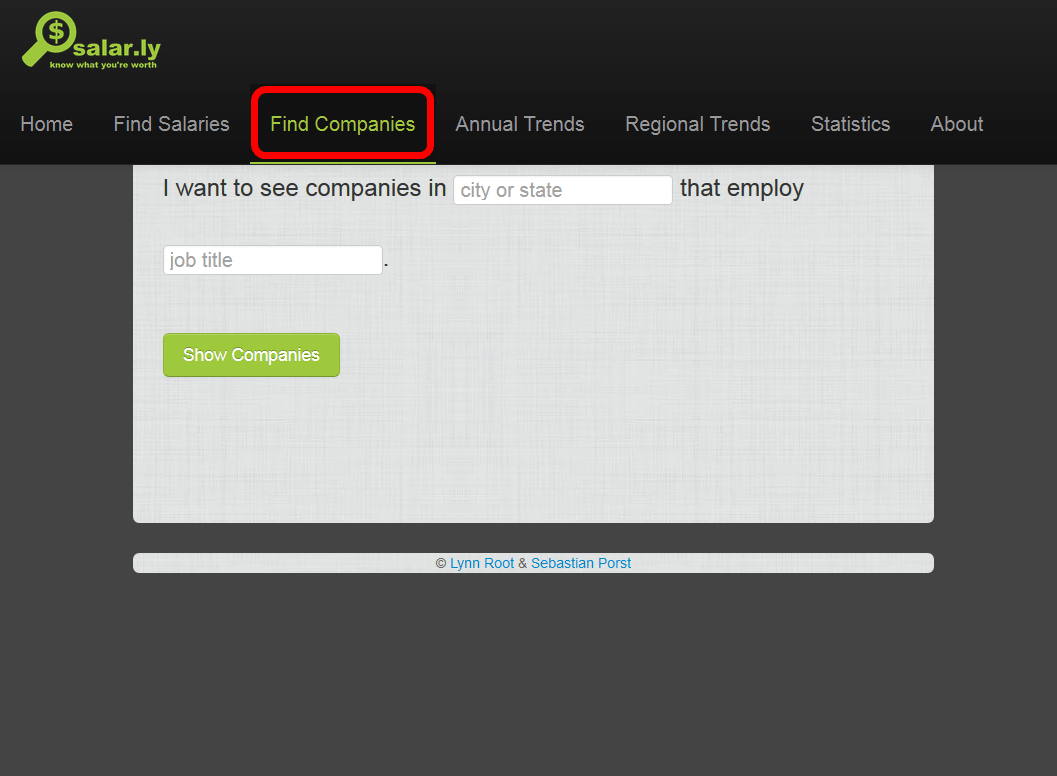
In “Find Companies”, you can view salary data of people who have met the job by entering “city or state” and “job title”.
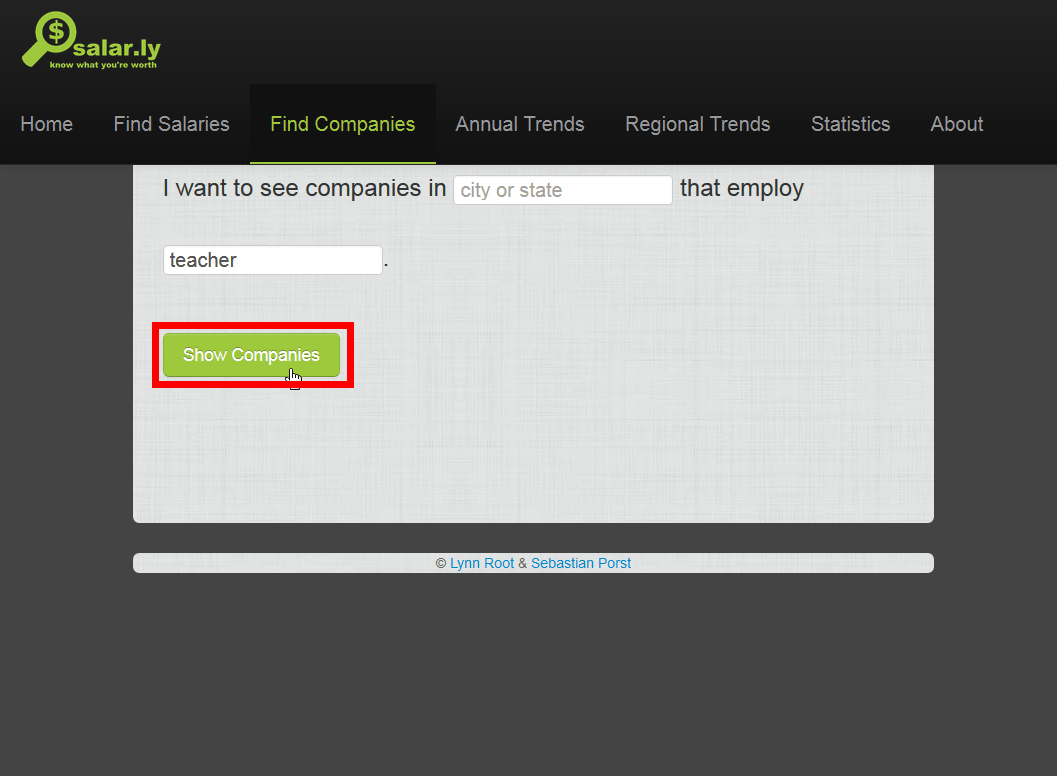
So, to see how much salary you get when you become a “teacher” in the United States.
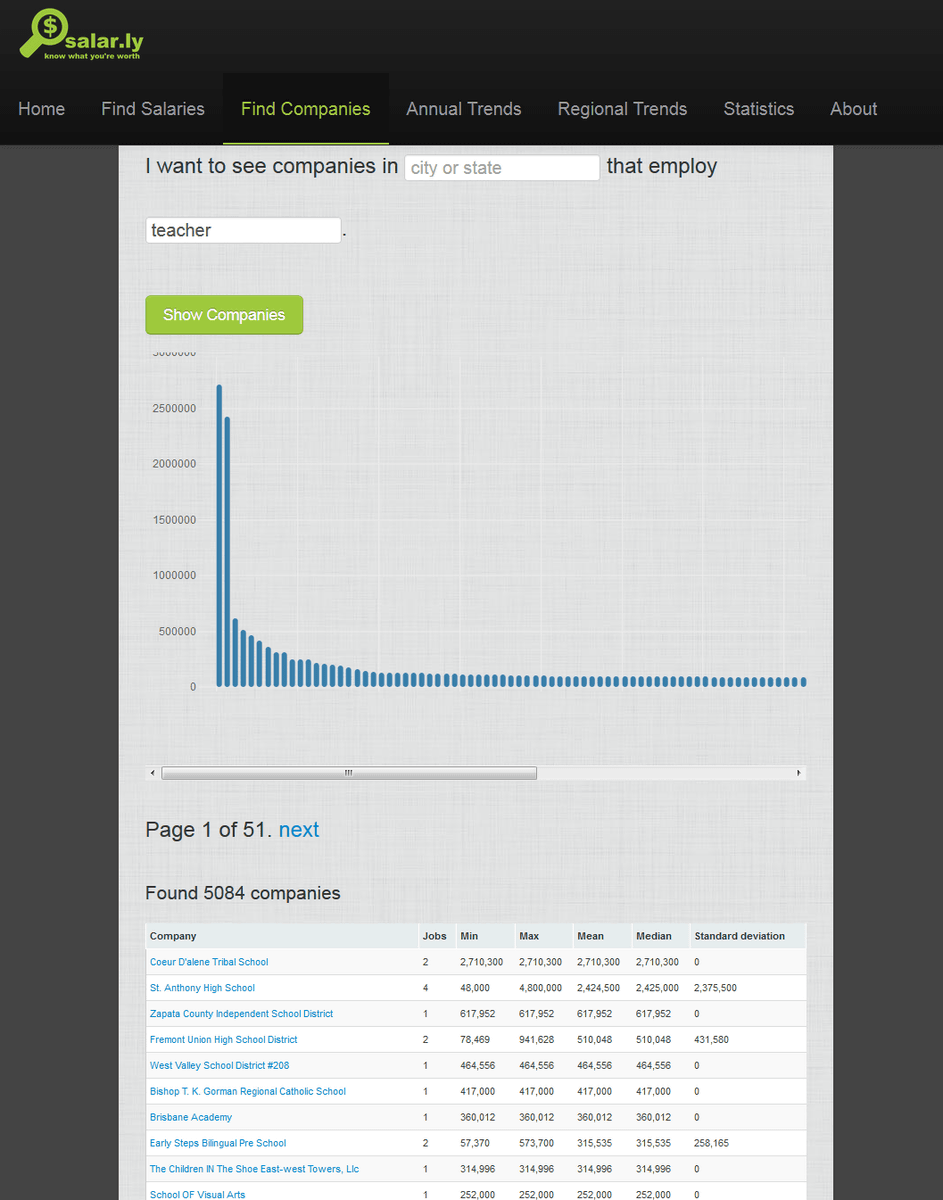
The data looks like this.
If you enter “job title”, “company name”, and “city or state” in “Annual Trends”, you can see the salary trend of the job category that meets the conditions by year.
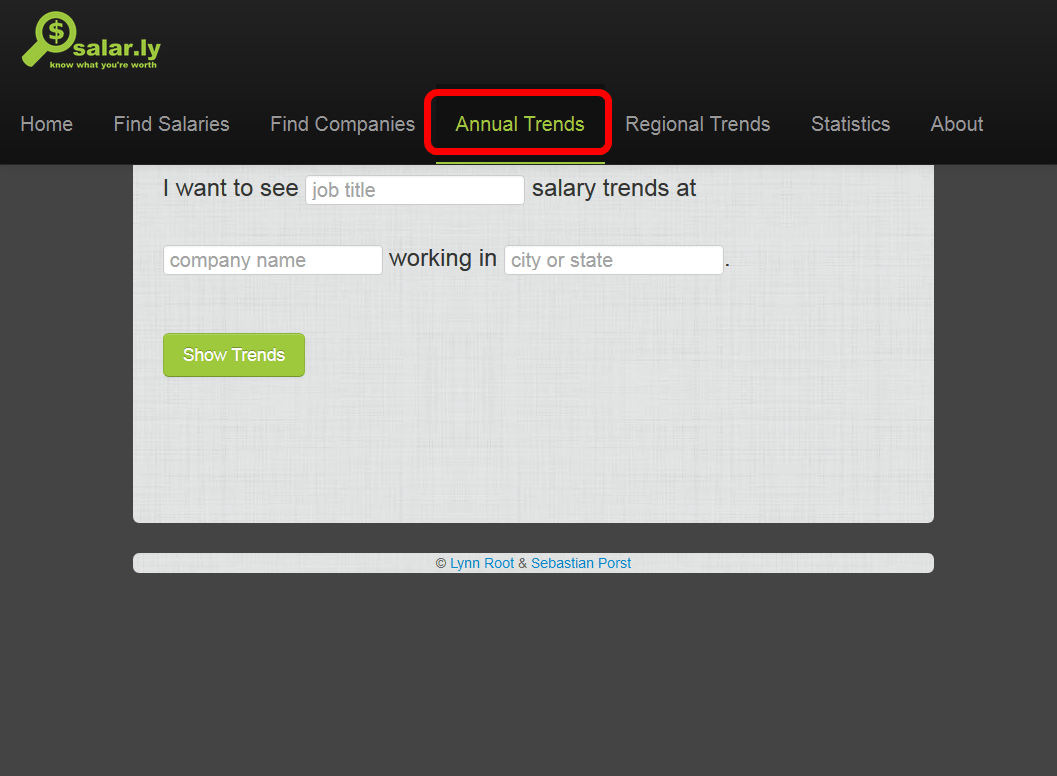
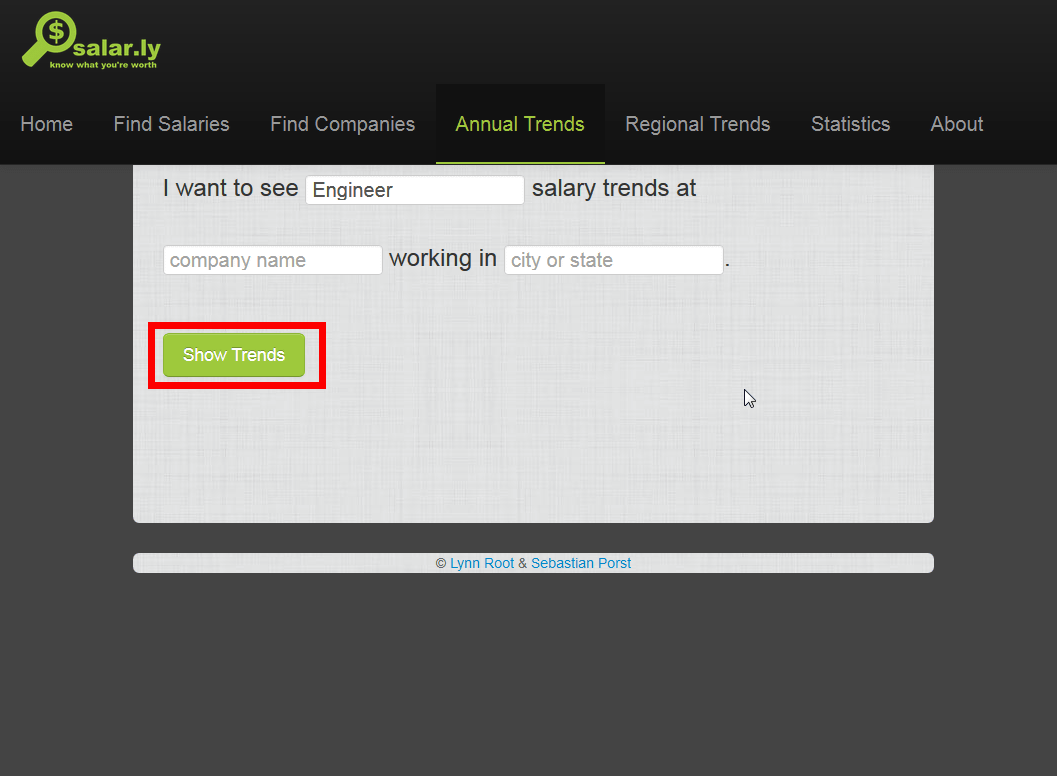
Search and search for salary trends for “engineer” positions here.
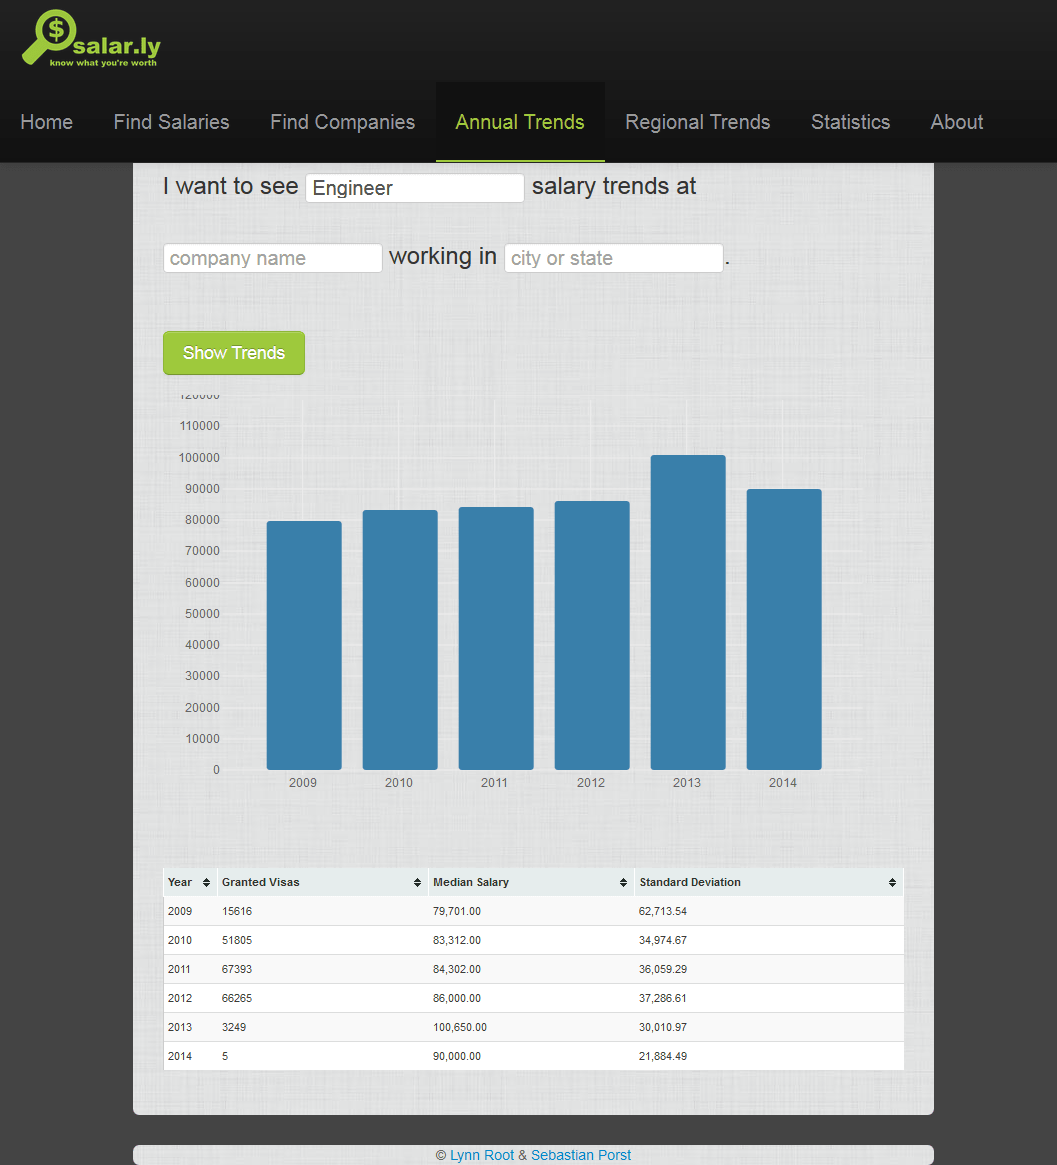
The displayed data looks something like this. If you look at the graph alone, you can't feel much change, but when you look at the text data at the bottom of the graph, the number of people who get a work visa and work as an engineer has greatly increased from 2009 to 2011 In 2012, although the number decreased slightly compared with the previous year, there was no big change and more than 60,000 foreign engineers worked in the United States, but in 2013 the number decreased to about 3000 at a stretch I understand.
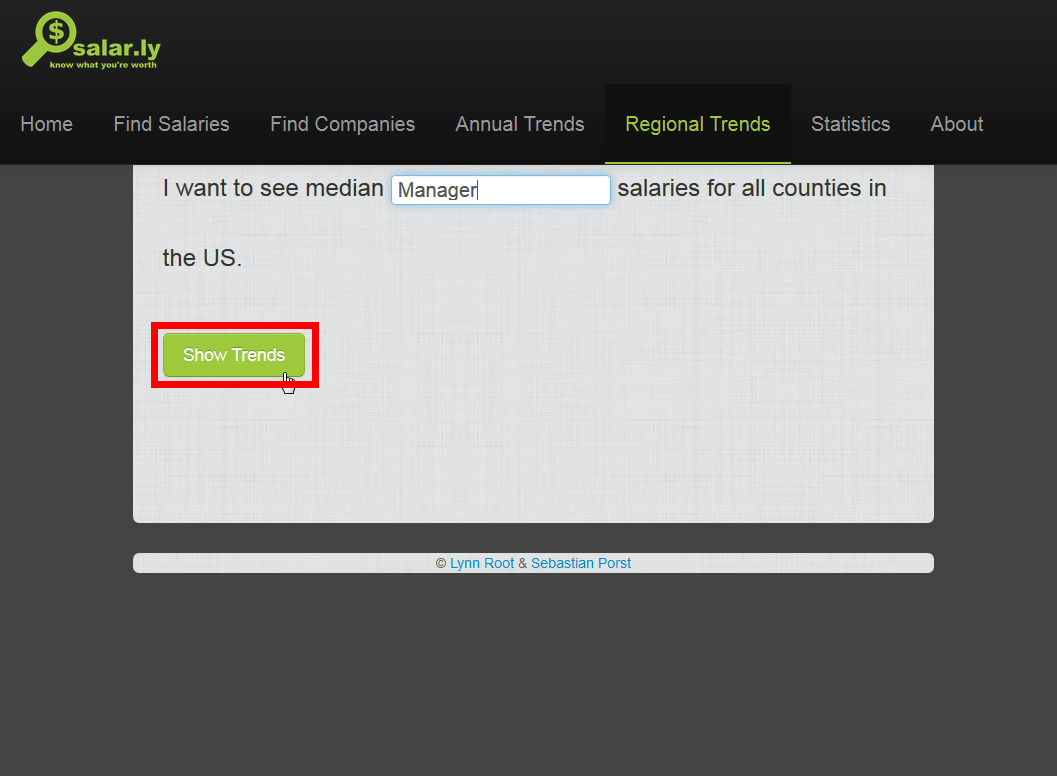
And “Regional Trends” means that you can see salary trends by region by entering “job title”.
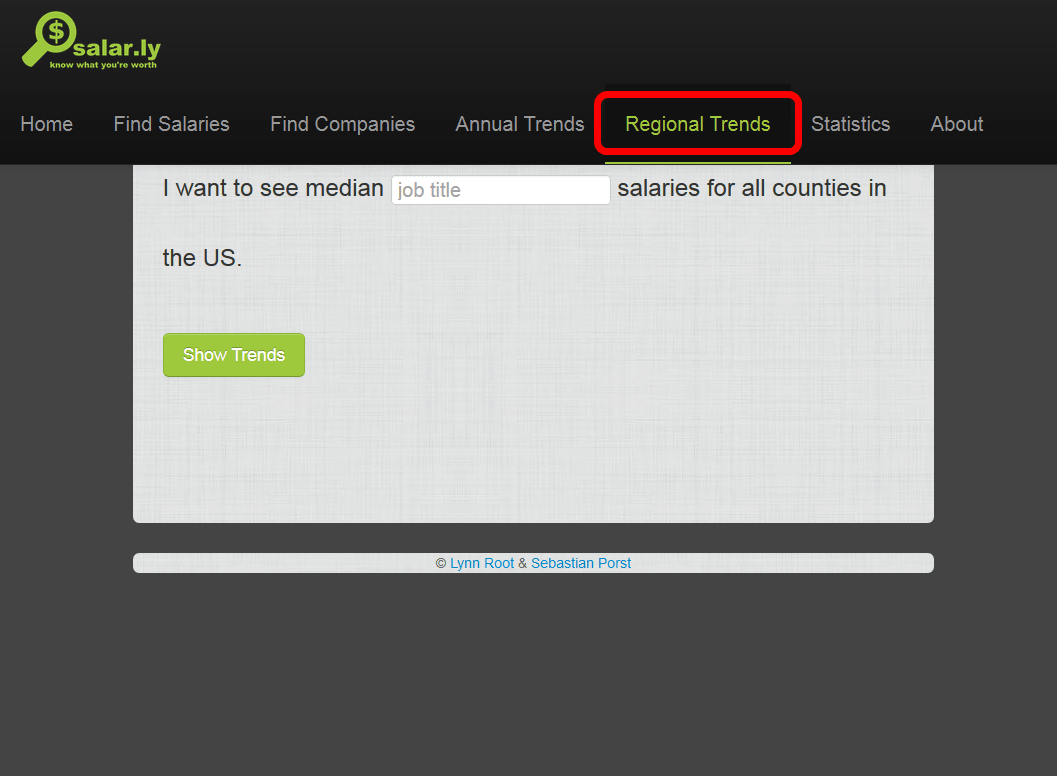
Here, enter “manager” and click “Show Trends”.
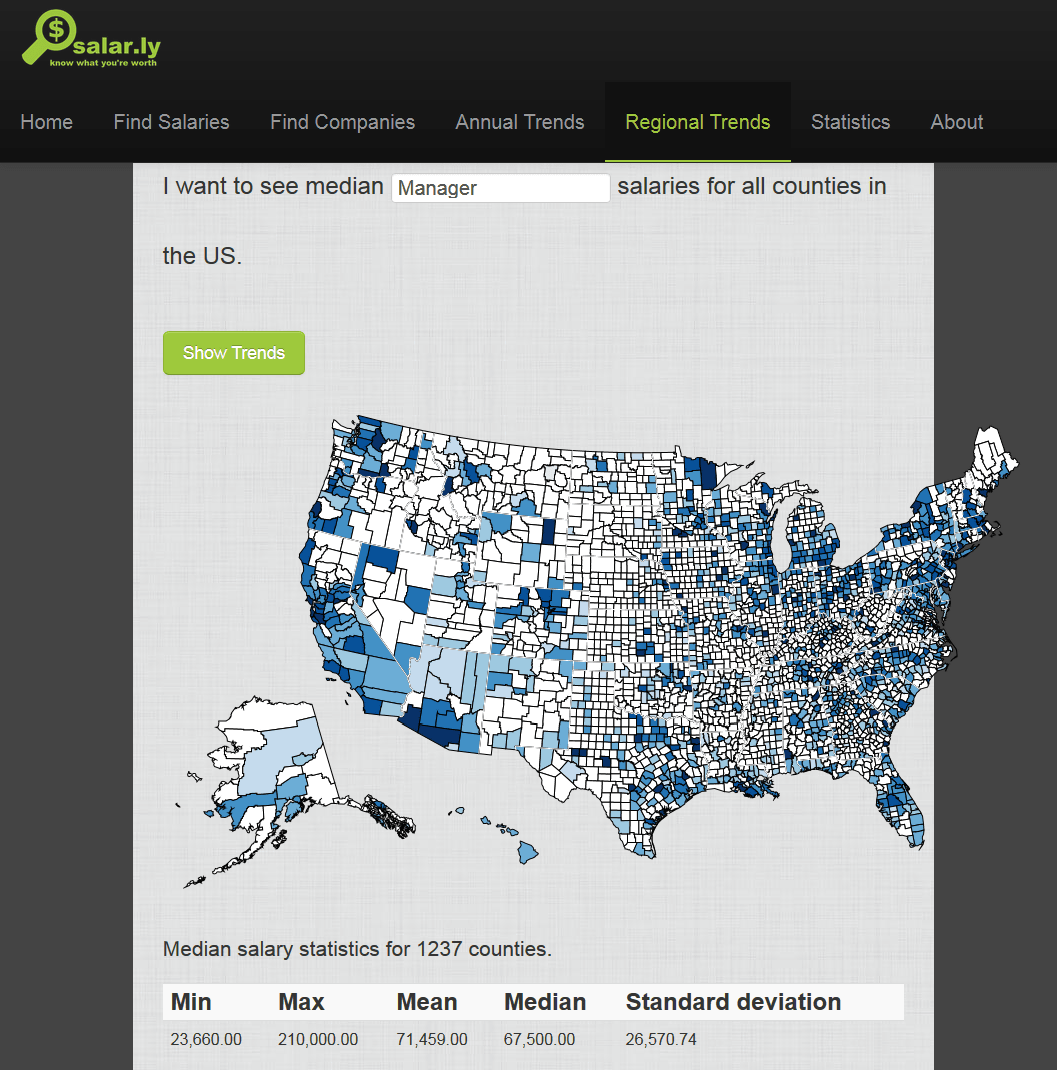
Then, a map that finely divided the whole United States like this and a table showing the manager's minimum salary, maximum salary, average salary, median, standard deviation
Below that is the number of managers and the median salary for each region. Click this 'Employees' ...
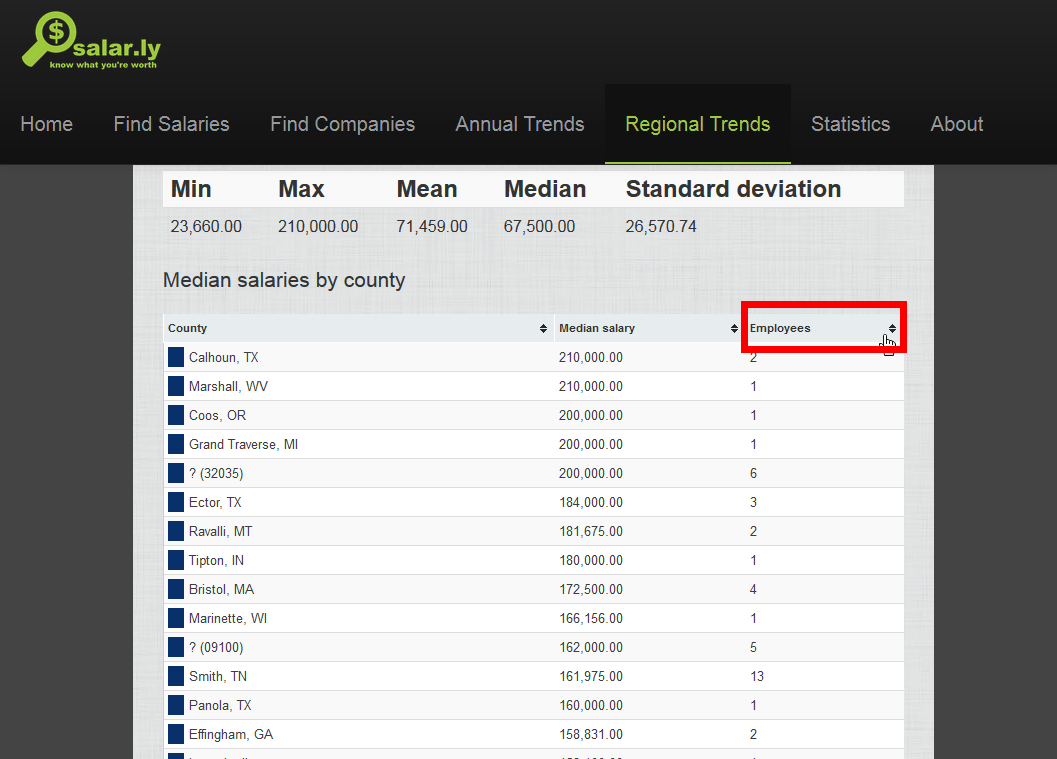
In this way, it is possible to display in order from the area with many 'foreign managers'. Since data such as “Many people in this profession in this land” can be easily obtained, it seems to be effective for finding a place where you can use your skills.

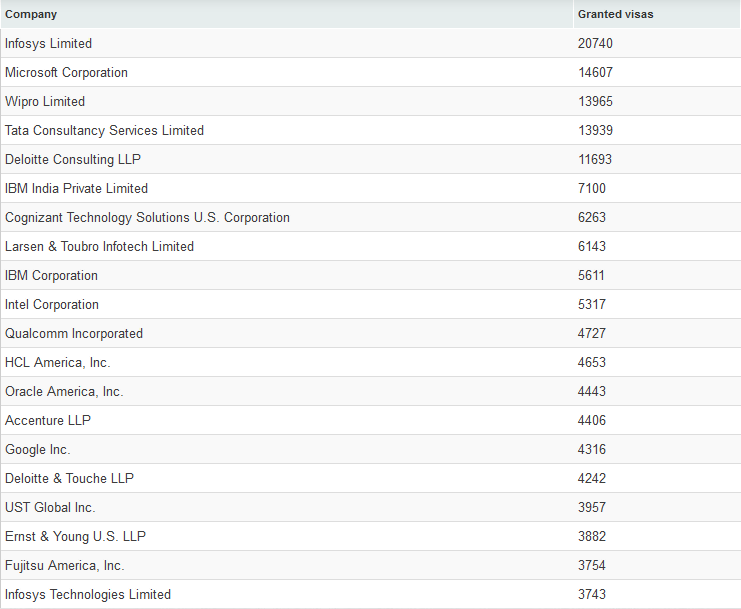
And in 'Statistics', you can see the top 20 companies that employ many foreign workers.
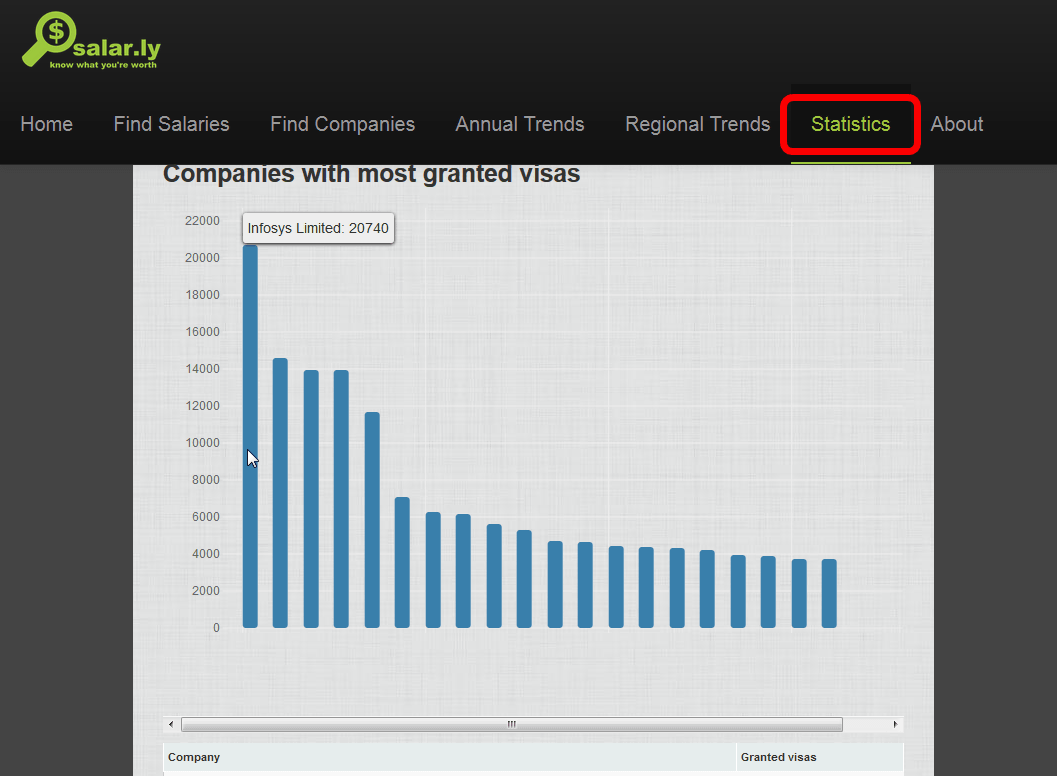
The top 20 are as follows: Microsoft ranked second, IBM ranked ninth, Intel ranked tenth, and Fujitsu America ranked 19th.
Since salary data can be easily displayed in association with companies, occupations, and land, there is no loss in checking if you have the opportunity to work in the United States.
Related Posts:


in Web Service, Posted by logu_ii