Professional ranking above the average annual income and occupational gaps

ByKatiew
Indeed, a service that gathers information from recruiting media and corporate websites and lists companies that match the desires of job seekers published a report that summarizes surveys on job occupations in the United States and gets more than average salary It became clear that the proportion of occupations is considerably less when compared with the whole.
State_of_Opportunity-Indeed_Hiring_Lab.pdf
(PDF)http://blog.indeed.com/wp-content/uploads/2016/07/State_of_Opportunity-Indeed_Hiring_Lab.pdf
The Short List of Jobs With High and Rising Pay - Real Time Economics - WSJ
http://blogs.wsj.com/economics/2016/07/26/the-short-list-of-jobs-with-high-and-rising-pay/
The ranking of occupations that exceeded the highest average annual income in the US in the past 30 years, which is the highest average annual income of 57 7700 dollars (about 680,000 yen), based on salary increase rate of 2000 to 2014 is shown in the table below . For each job type, we show salary real increase rate in yellow and average yearly salary in yellow. The top is a medical assistant with an increase rate of 42.0% and an average annual income of $ 90,270 (about 10.8 million yen). It is followed by an occupational therapist and a financial manager.

According to Indeed, who investigated 800 kinds of occupations, the average annual income is over 57,700 dollars, and the salary real increase rate is only 15% of the total value that is commensurate with the inflation rate in the past 10 years He said that he did not. As you can see from the above table, these occupations are mostly those who have a bachelor's degree, those who did not acquire a bachelor degree are the salary increase rate and annual income There seems to be a large gap on the surface. Despite the fact that special skills are not required, occupations that receive high salaries are decreasing, and these situations are exacerbating the labor situation of those in the age of 25 to 54 years old working people.
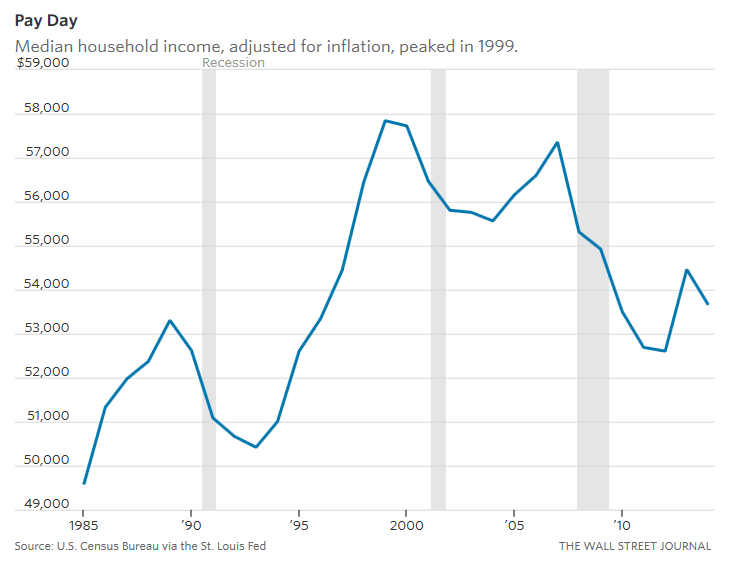
The graph below shows the trend of average annual income in the United States from 1985 to 2014. The average annual income is taken into consideration for inflation as commodity prices rise. The average annual income continues to rise from 1985, but the economy has declined since around 1989, and in 1994 it recorded the lowest average annual income. After that it continued to rise to reach the peak in the past 20 years at 57,700 dollars in 1999. After that, after two recessions, in 2015 it settled at about 53,800 dollars (about 5.7 million yen).
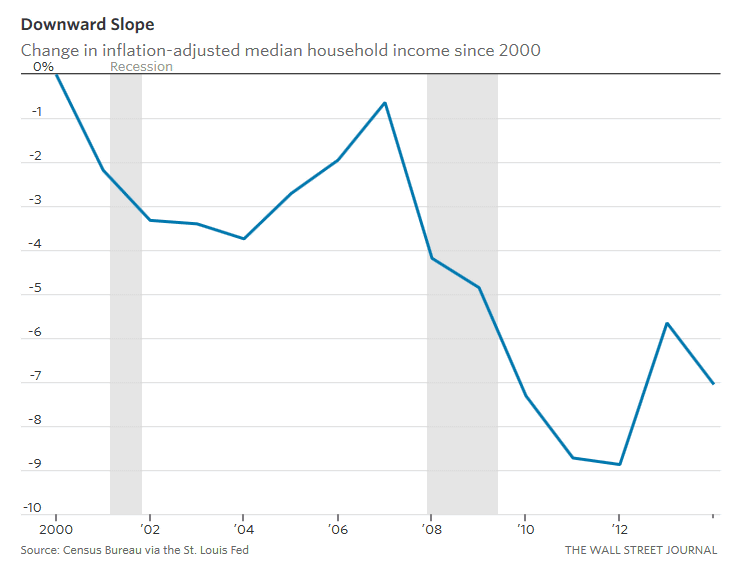
Below is a graph showing how much the average annual income has declined since 2000 when it reached its peak. We can see that 2012, which was the lowest average annual income since 2000, has decreased by about 9% since 2000.
According to Indeed, the tendency that there is a big disparity between those who get more than the average annual income and those who do not do so is expected to continue in the future.
Related Posts:


in Note, Posted by darkhorse_log