What you can see in the "Internet trend" 2014 version which analyzed all data on the net

ByAK Rockefeller
venture capital"Kleiner Perkins · Cofield · · · Buyers"Mary Meeker announced the annual 2014 version of" Internet trends "that analyzed all kinds of data related to the Internet that is open every year. The details of how the trend of the Internet changed in 2014 is understood.
2014 Internet Trends - Kleiner Perkins Caufield Byers
http://www.kpcb.com/internet-trends
According to Meeker's analysis, the growth rate of the Internet has slowed down since last year, and the growth rate has cut by 10%. On the other hand, the growth rate of smartphones is 20%, exceeding the Internet, but here also the growth rate slows down. By contrast, the mobile data traffic showed a tremendous growth rate, with a growth rate of 80%, and the core content of this was movie content. First of all, we will focus on mobile-related data that has made significant progress in the growth rate of data traffic, while slowing down the growth rate.
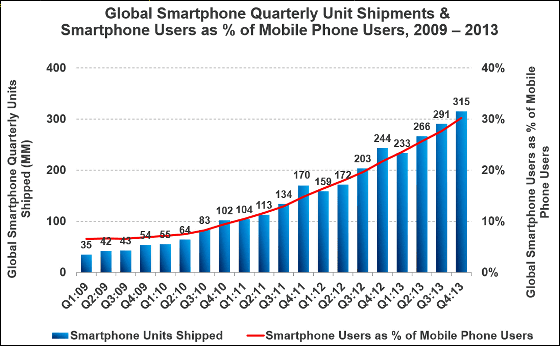
The chart below shows the number of smartphone shipments and the ratio of smartphone users among all mobile phone users, from 2009 to 2013. The orange line shows the number of shipments of smartphone and the bar graph shows the proportion occupied by smartphone users, indicating that the proportion of shipments and smartphone users has increased steadily. In the fourth quarter of 2013, about 30% of all mobile phone users were using smartphones.

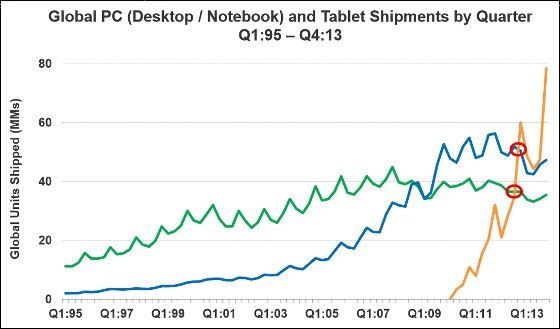
This is a graphical representation of the number of shipments of desktop PCs, notebook PCs and tablet terminals. The desktop PC is green, the notebook PC is blue, and the tablet terminal is orange. The tablet terminal that appeared in 2010 will show rapid growth, withdrawing the desktop and notebook PC in 2012, reigning at the top with overwhelming difference in 2013.

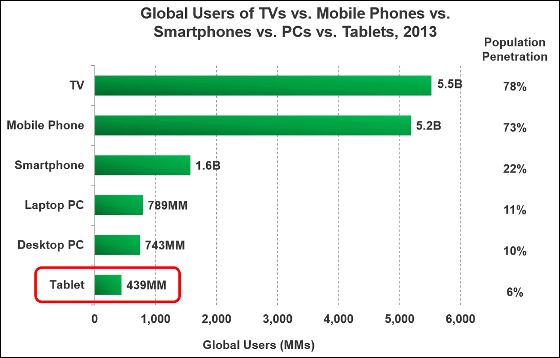
On the other hand, comparing the number of users of TV, mobile phone, smartphone, notebook PC, desktop PC, tablet terminal in the world, we can see that there are few tablet terminals that exceeded notebook PC / desktop PC by shipment quantity. The top is a television, which is closer to a mobile phone. If we add smartphones to the number of mobile phone users, we will exceed the number of TV users.

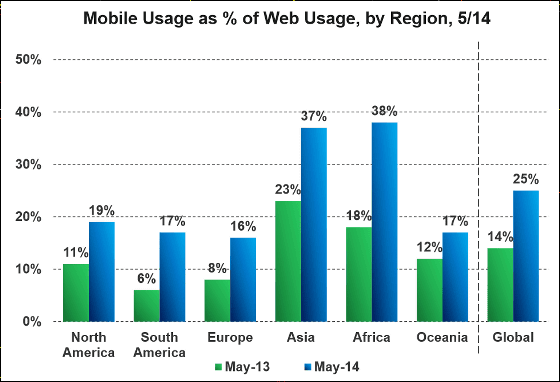
What is the usage of mobile related data where the growth rate of traffic was great, the graph below shows a graph showing the proportion of mobile terminals occupied by devices accessing the web by region. Green is data of May 2013, Blue is data of May 2014. In every region, more people are accessing the web from mobile terminals, especially Asia and Africa.

Due to the increase in users who access the web from mobile terminals, advertising on the Internet has also changed. Advertising revenue for desktop PCs is blue, advertising revenue for mobile is represented by orange bars In the graph below, gradually the percentage of advertisements for mobile is increasing.

The graph below shows the proportion of consumption time by users of paper medium, radio, TV, Internet, mobile terminal. Yellow indicates consumption time, and blue indicates percentage of time spent on advertisement browsing. Both consumption time and advertisement browsing time were overwhelmingly top, followed by TV, followed by the Internet. However, the proportion of consumption time of Internet and mobile terminals exceeds the percentage of advertisement browsing time, and if we can fill up the difference, we are likely to achieve significant growth.

In 2014, changes also came to applications that users used. In the past, applications that were full of multipurpose applications, that is, "communication with friends", "sharing photos", "sharing of contents" and so on were one mainstream, but from 2013 to 2014, "LINE "Instagram in the case of sharing pictures", the way users' applications are used shifts in the direction of "enjoying one purpose with one application".

As the graph below shows, users tend to use the messenger application when they frequently contact Facebook, friends and acquaintances when sharing messages with a lot of people.

The rise of the rise is a messenger application. For example "WhatsApp" has 400 million monthly active users, 100% growth rate, 50 billion messages sent per day. The line popular in Japan is 280 million monthly active users and 10 billion messages are sent on the day.

The graph below shows a graph of the number of photos uploaded on the 1st by 5 platforms, Flickr · Snapchat · Instagram · Facebook · WhatsApp. Until 2011, it was a landscape of Facebook, but 2012 and Snapchat and WhatsApp gradually grew, and in 2014 it surpassed Facebook.

Movie contents on mobile terminals have grown greatly. It is obvious if you look at the graph showing the share of mobile terminals in online movie content. The share of the mobile terminal in the movie playback in which blue is online and the color of the mobile terminal in the green playing time of the movie playing online represent the share of the mobile terminal, both of which gradually rose and reached around 20% in November 2013 did.

Meeker analyzes various data and investigates "What is the relationship between PCs and mobile terminals and TVs?" Although Mr. Meeker sometimes talks about "the number of TV viewers is decreasing". did. The graph below shows the number of shipments of TV, PC, smartphone, tablet terminal, smartphone, tablet terminal as a graph. The red line is the television, which has been constantly maintaining a certain number since 1999, but it has rarely risen. On the other hand, smartphones and tablet devices have risen at a stretch from around 2009.

This is a graph showing the hours of use of TV desktops, notebook PCs, smartphones, tablet terminals in each country. There are many countries in which the use time of the smartphone exceeds the television, and half of the use time of the PC exceeds the television is about half.

The graph below shows what the user is looking at on other devices while watching TV. The device you are using is a smartphone for green and a tablet terminal for blue. Check the score of net surfing · shopping · sports in order from the top · Check information of actors, works, athletes · About e-mails with friends about television programs Conversation with short mail · Read discussion about TV program by SMS · Purchase of products and services advertised on TV commercial · Post comments on live program, and so on.

Looking at the data so far, I get the impression that "TV has lost the strength like before", but there seems to be many users who watch sports events such as the Olympic Games on TV. The graph below shows the average time for each user who watched the 2012 Olympics held in 2012. Blue is overwhelming with other devices on TV. However, many users check the Olympic Games on smartphones and tablet terminals while watching TV.

According to Meeker, until now, if it had five hours of watching television, it was 4 hours actually watching the content, while watching the commercial was 1 hour, but in 2014 it was I was watching the content for 5 hours on the device, and I heard that it took time to watch advertisements. There is a possibility that major changes will be made in the advertising strategy from now on.

Finally, I picked up the market value of companies that are driving the Internet market and the ranking by total revenue. First place is Apple with market value of 529 billion dollars (approx. 54 trillion yen) · Total income is 173,9 92 million dollars (approx. 17,750 billion yen); second place is Google with market value of 377 billion dollars (approx. 38 trillion Yen) · Total income is 59.825 billion dollars (about 6.1 trillion yen), third place is Facebook and market value is 157 billion dollars (approximately 16 trillion yen) · Total income is 7,872 million dollars (about 800 billion dollars It has become yen). Yahoo! in Japan Japan has a market value of $ 25 billion (about 2.5 trillion yen) · total revenue of $ 3,641 million (about 368 billion yen), ranked 12th, Rakuten has a market value of 16 billion dollars (about 1.6 trillion yen ) · The total revenue is 17,322 million dollars (about 500 billion yen) and it is 17th place.

Related Posts:
in Note, Web Service, Posted by darkhorse_log


