"Chartspree" that makes it easy to embed graphs easily and free of charge
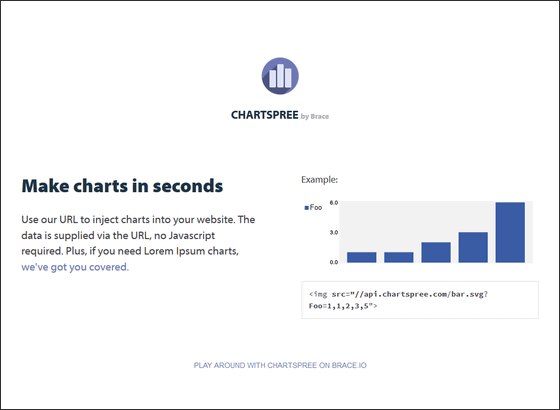
If you want to insert a graph on a web page, you need to create graphs or create images with dedicated software, but this is a very troublesome task. However"Chartspree, You can easily insert beautiful graphs simply by adding an embed code to the page source, and you can use it free of charge if you have 10,000 views per month.
Chartspree | Make charts in seconds
http://www.chartspree.com/
"ChartspreeWhen embedding the code of "OK if you paste the code for each graph on the image tag OK.
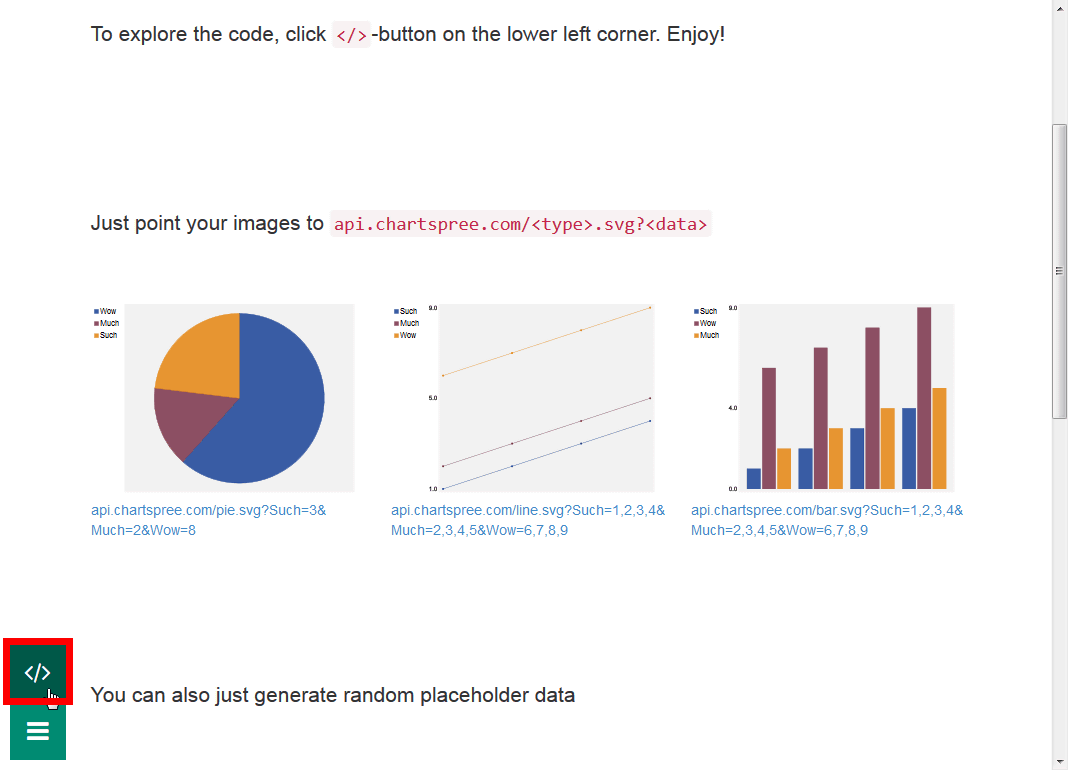
There are roughly three kinds of graphs that can be created with Chartspree, and you can freely change the character strings below "svg?" Respectively.
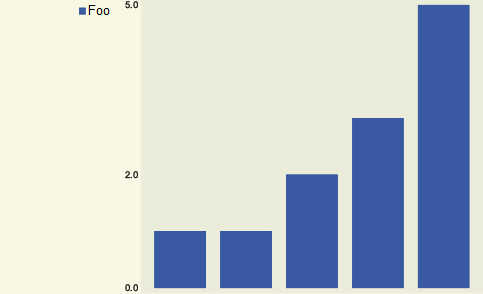
◆ Bar chart
Code: api.chartspree.com/bar.svg? Foo = 1,1,2,3,5
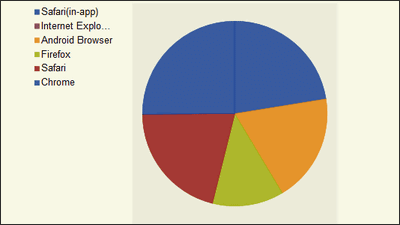
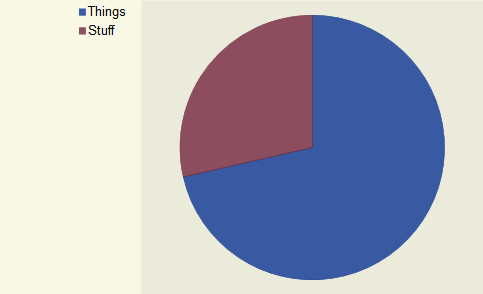
◆ Pie Chart
Code: api.chartspree.com/pie.svg? Things = 5 & amp; Stuff = 2
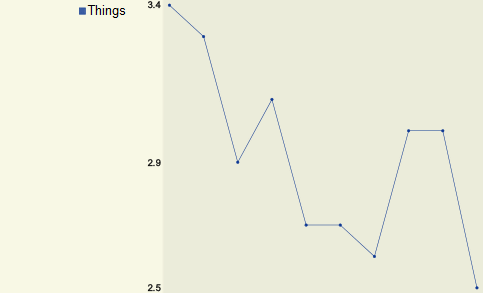
◆ Line graph
Code: api.chartspree.com/line.svg? Things = lorem_flat
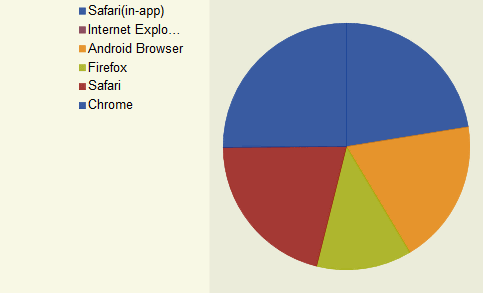
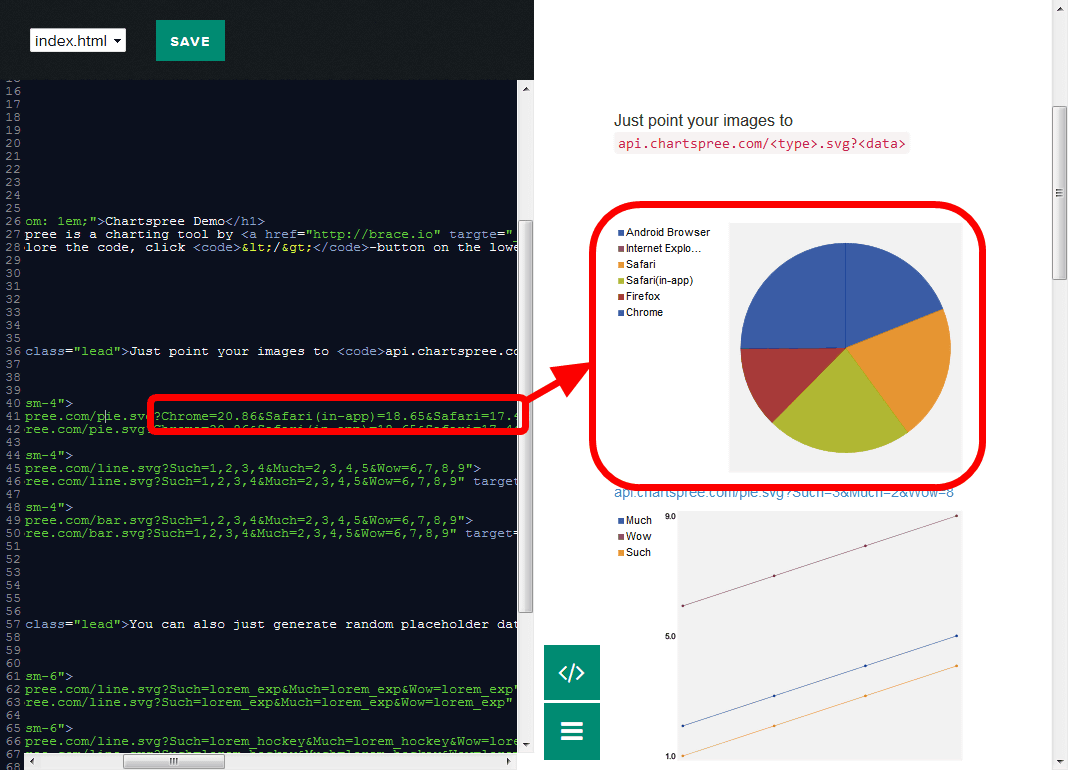
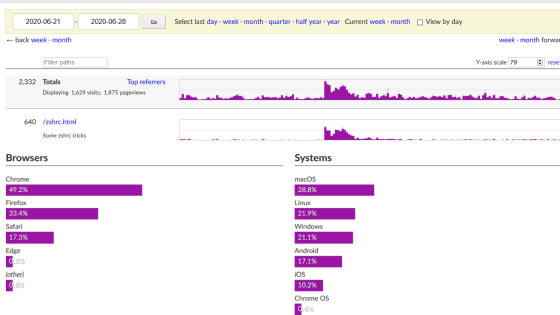
These graphs are OK if you tinker a bit according to your data. For example, in the case of a pie chart, the character strings below "svg?" Are changed from "Things = 5 & amp; Stuff = 2" to "Chrome = 20.86 & Safari (in-app) = 18.65 & Safari = 17.44 & amp; Android Browser = 15.75 & Changing to Internet Explorer: 14.80 & Firefox = 10.39 "will result in the following graph.
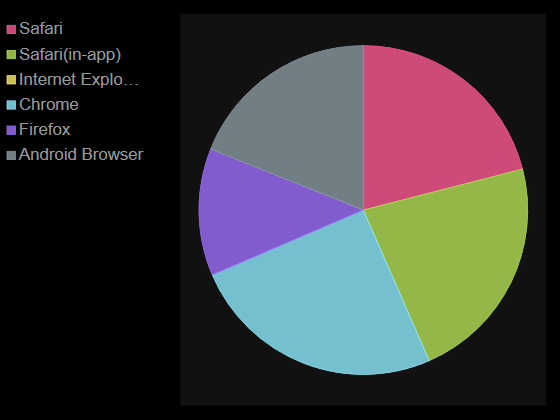
Otherwise add "& amp; _ style = dark" to the end of the code to make the background black.
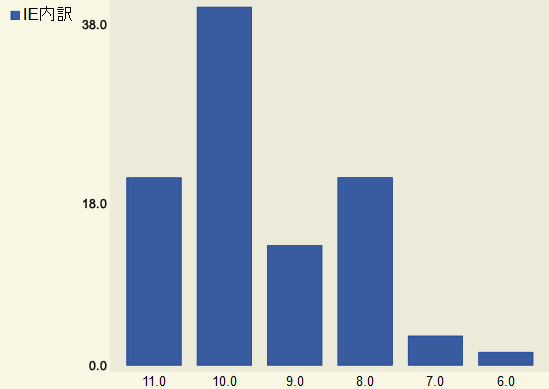
It is also possible to name each value by adding "& amp; _labels = 11.0, 10.0, 9.0, 8.0, 7.0, 6.0".
If you enter "? Stuff = lorem_exp" at the end of the code, you can create a bar graph or a line graph that rises to the right, or "? Stuff = lorem_bell"Normal curve, You can create a graph whose value does not change with "? Stuff = lorem_flat".
Also click "PLAY AROUND WITH CHART SPREE ON BRACE.IO" from the top page of Chartspree.
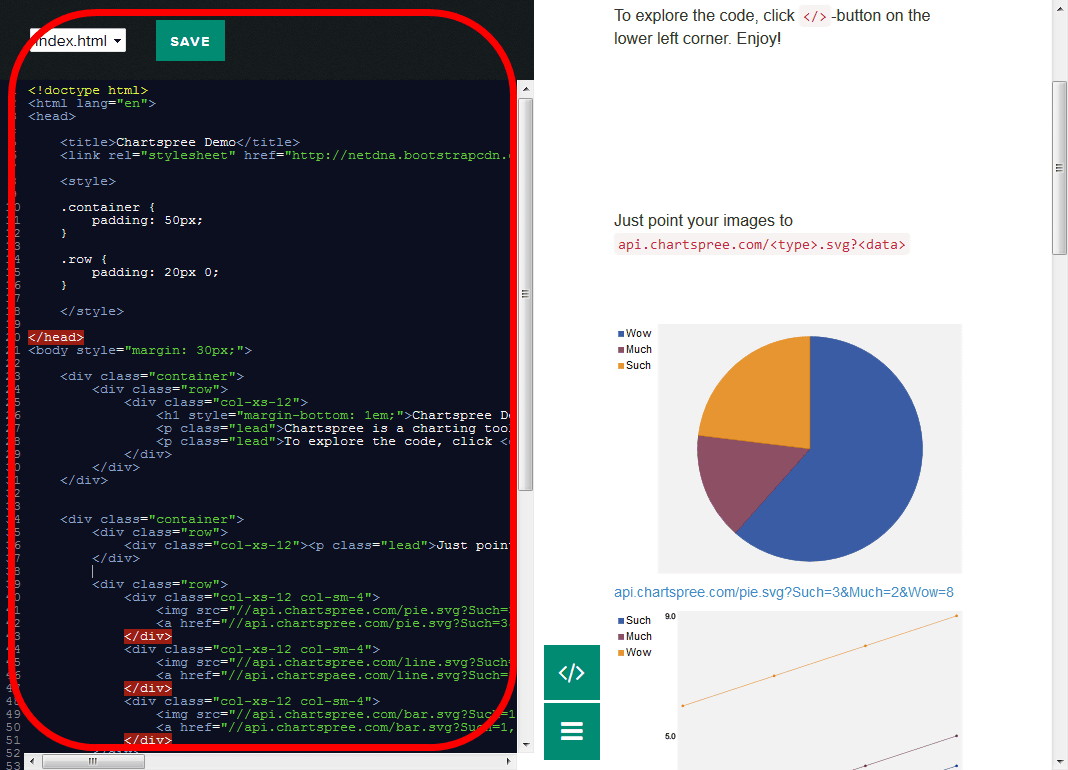
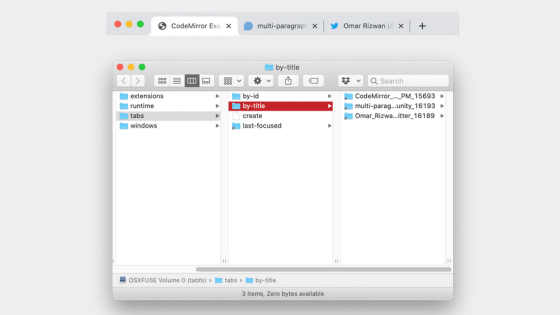
Click the icon at the bottom left of the displayed page.
The source code of the page is displayed. Changing this code will change the graph displayed on the page, so you can also create a graph while seeing what the graph looks like.
If you change the graph here, you can see the change on the spot like this.
These graphs can be used for free up to 10,000 views per month per graph.
Related Posts:


in Review, Web Service, Design, Posted by logu_ii