A report movie that you can see by briefly seeing the energy situation of a dramatically changing world in 2012 2012 edition
British energy company BP summarizes and presents 2011 data as 2012 energy statistics survey. Among them, a three-minute movie that summarizes the latest energy situation is being produced, but this is summarized concisely and graphically, and it is quite easy to understand.
BP Global - Statistical Review of World Energy 2012
http://www.bp.com/statisticalreview
The movie is kore.
Statistical Review of World Energy 2012

2011 was a year with many events related to energy

Significant confusion occurred in the energy market

The first thing that shocked the market was "Arab Spring"

As a result, crude oil price was greatly affected.

Barrel unit price rises fast

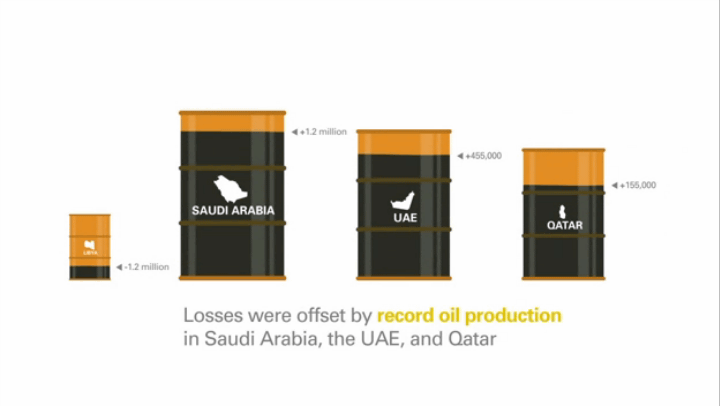
The supply of crude oil from Libya markedly decreased

The decrease was compensated for by record increase by Saudi Arabia, UAE, Qatar
In MarchEast Japan great earthquake disasterThe earthquake and tsunami hit Japan.

This effect spreads to all over the world.

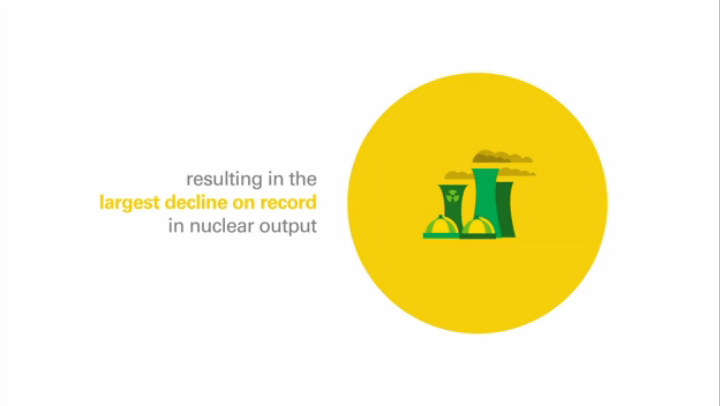
Nuclear power generation will show the largest decrease in the past.
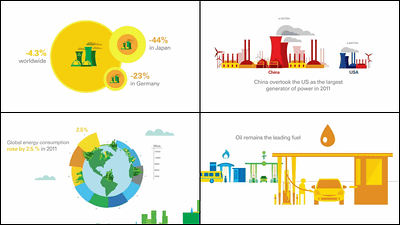
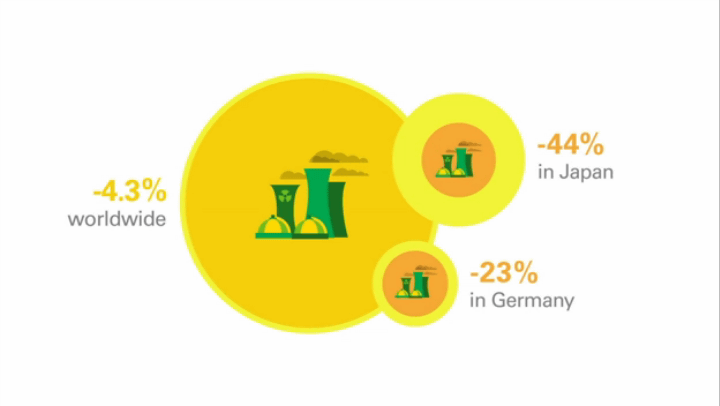
The amount of power generated by nuclear power plants decreased by 44% in Japan and 23% in Germany, and decreased by 4.3% worldwide.
Also, the long-term trend is revealed.

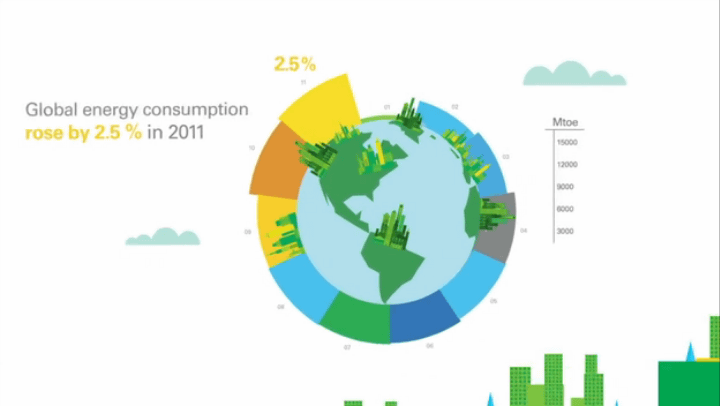
Energy consumption increased by 2.5% in one year
However, it tends to decrease in developed countries where OECD joins.
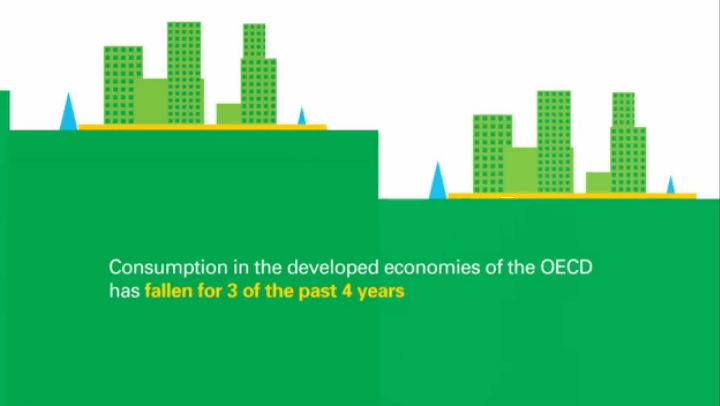
0.8% decrease in last year

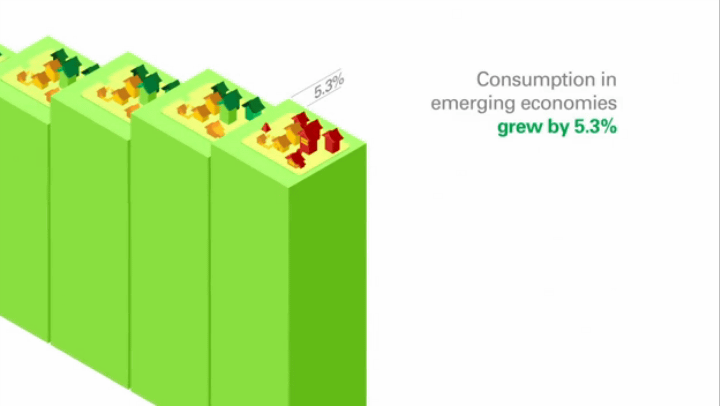
On the other hand, 5.3% increase in emerging market countries
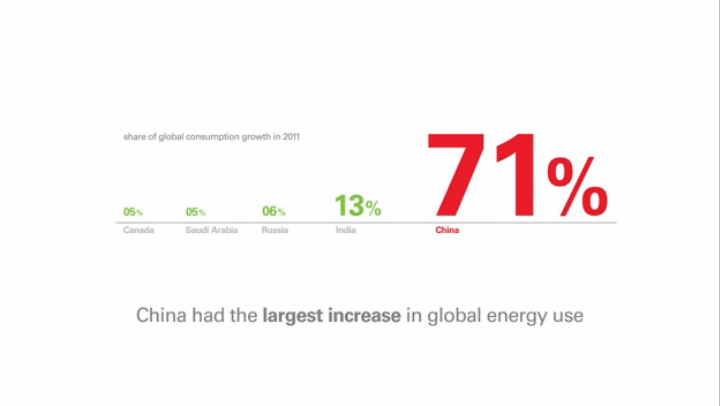
China's strong economic growth is creating this trend
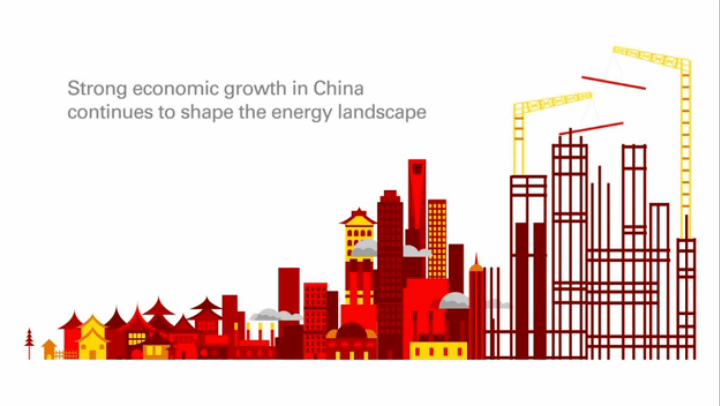
China 's energy consumption in 2011 increased by 71% compared with 2010. With India 13%, Russia 6%, Saudi Arabia and Canada 5%, the Chinese figures are outstanding.
The amount of electricity generated in the United States is 4308 TWh (in terawatt time), but in 2011 China exceeded it with 4700 TWh.

Energy mix brings about structural change

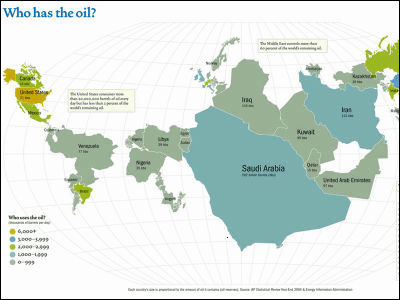
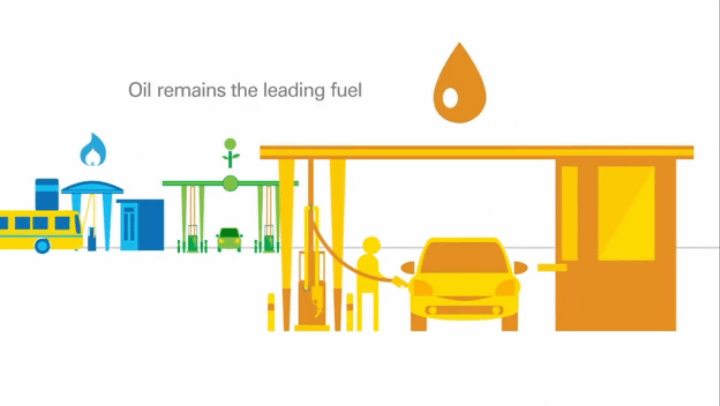
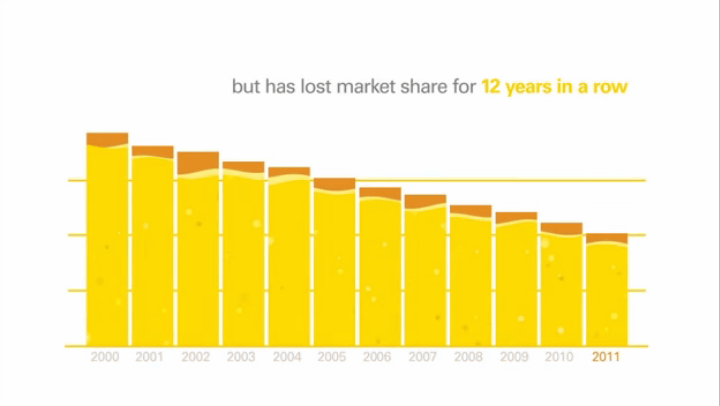
Oil is still a major fuel now.
However, the share in the energy market has declined for 12 consecutive years.
On the other hand, coal consumption has increased by 5.4%.
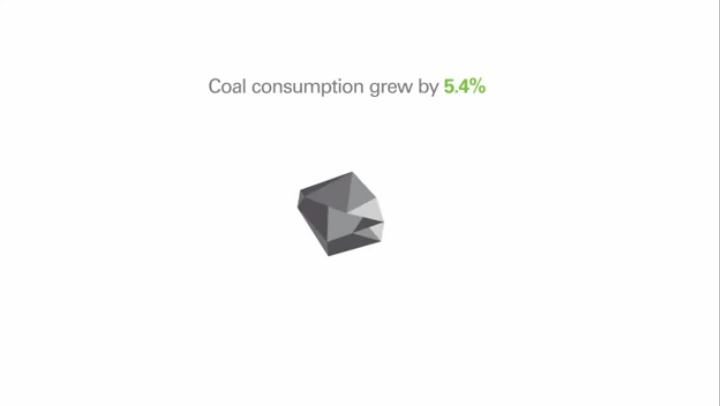
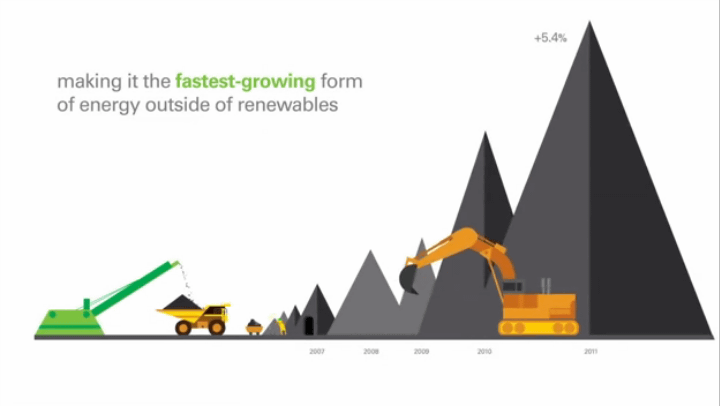
Coal accounts for 30.3% of world energy consumption.
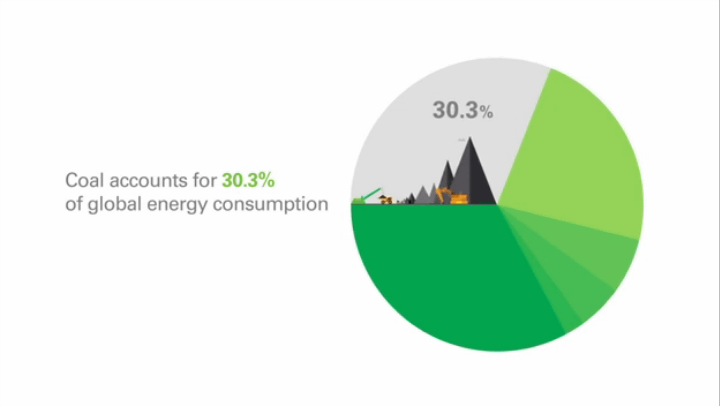
This is a large value since 1969 in the statistics.

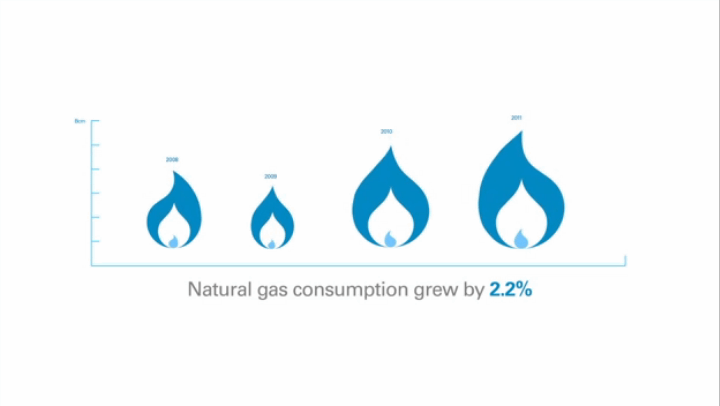
Consumption of natural gas also increased by 2.2%.
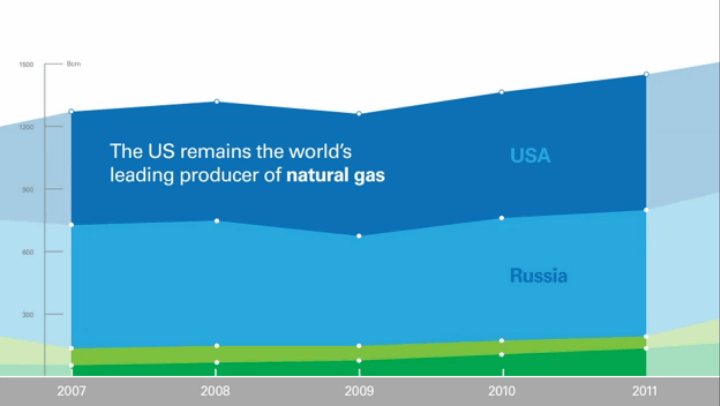
Currently, America is the largest source of natural gas.
Petroleum production in the United States was on a downward trend from 1998 to 2008, but it has been rebounding since 2009, and in 2011, it recorded high figures since 1998.
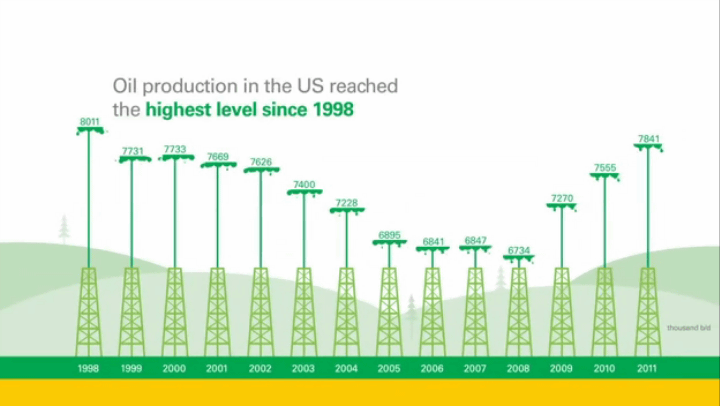
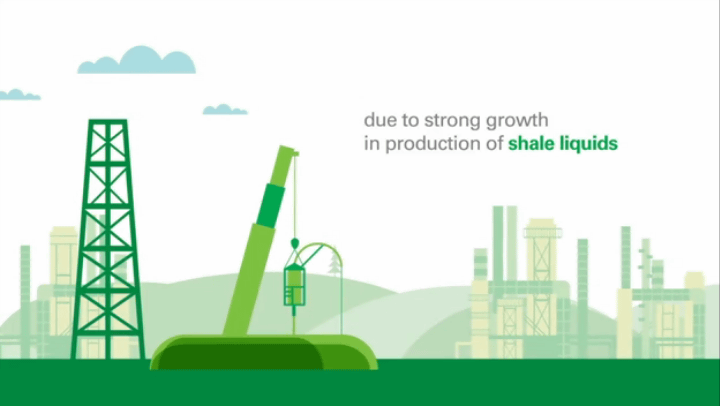
this isOil shaleThrough development progress.
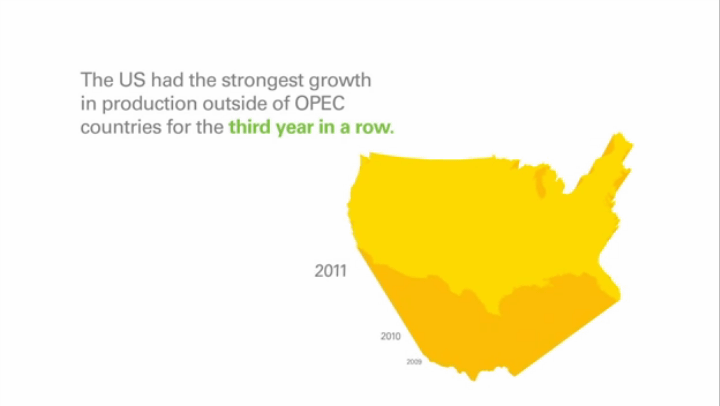
The United States showed the largest growth rate in the non-OPEC non-member country for the third consecutive year.
Results on renewable energy are ... ...
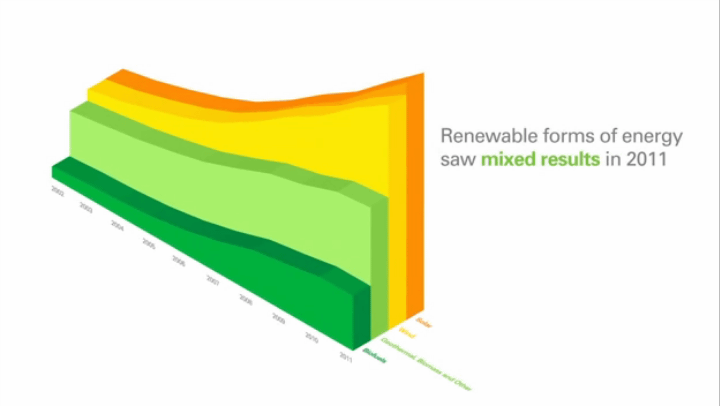
Biofuel production increased by 0.7%.

This is due to the fact that the yield of sugarcane in Brazil was insufficient (15.3% lower than last year).

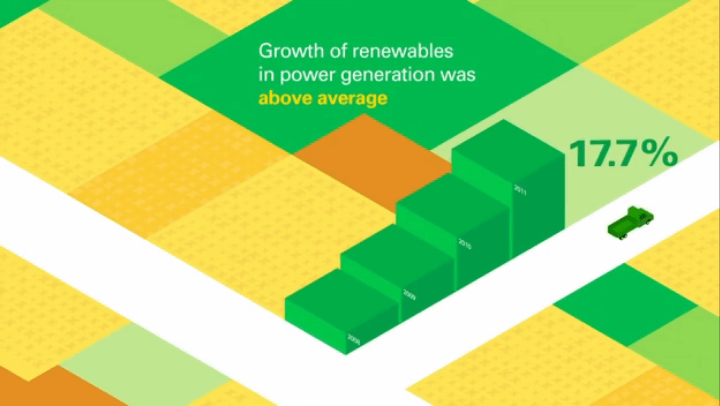
Renewable energy as a whole increased by 17.7%
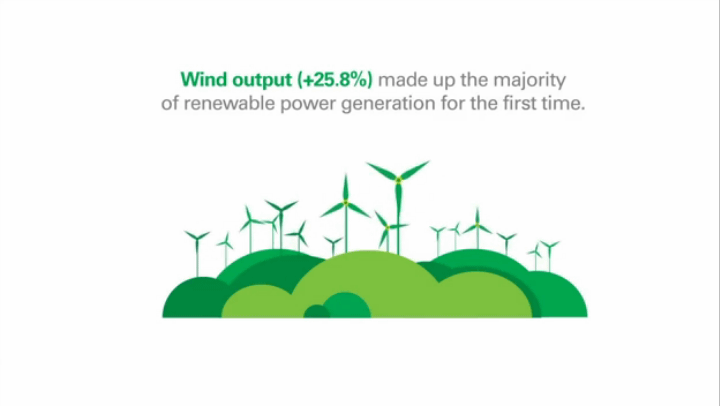
Wind power generation increased by 25.8%
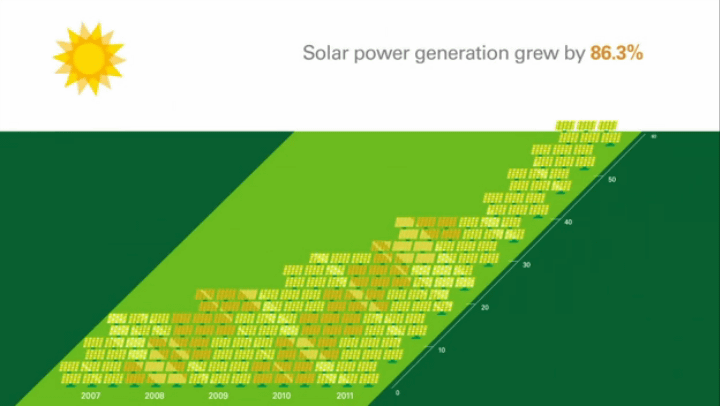
Photovoltaic power generation increased by 86.3%
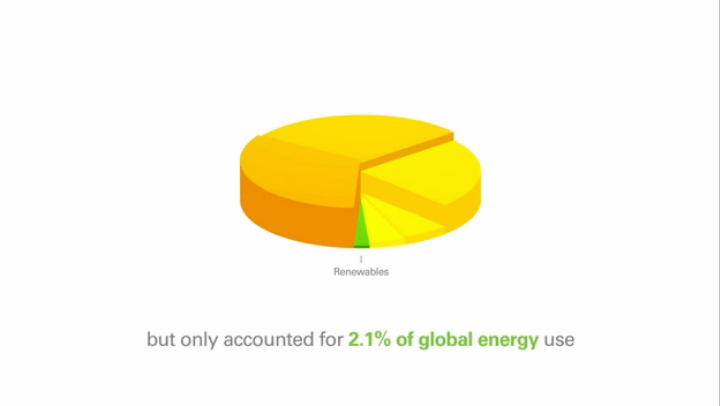
The market share of renewable energy continues to increase steadily

However, it is only 2.1% from the whole energy perspective.
CO2 emissions are continuously increasing
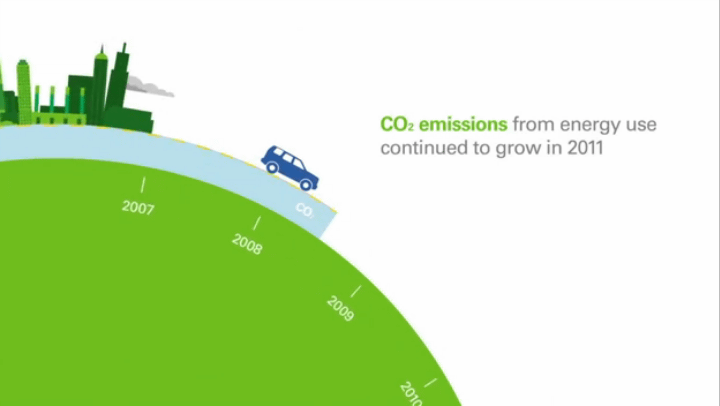
However, the rate of increase became dull compared to the 2010 increase.

Related Posts: