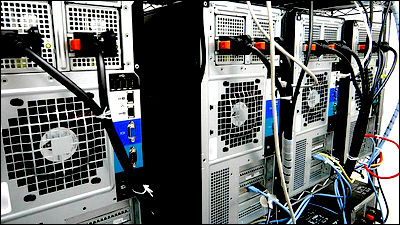
Web server used by GIGAZINE "PowerEdge T310" All kinds of failures
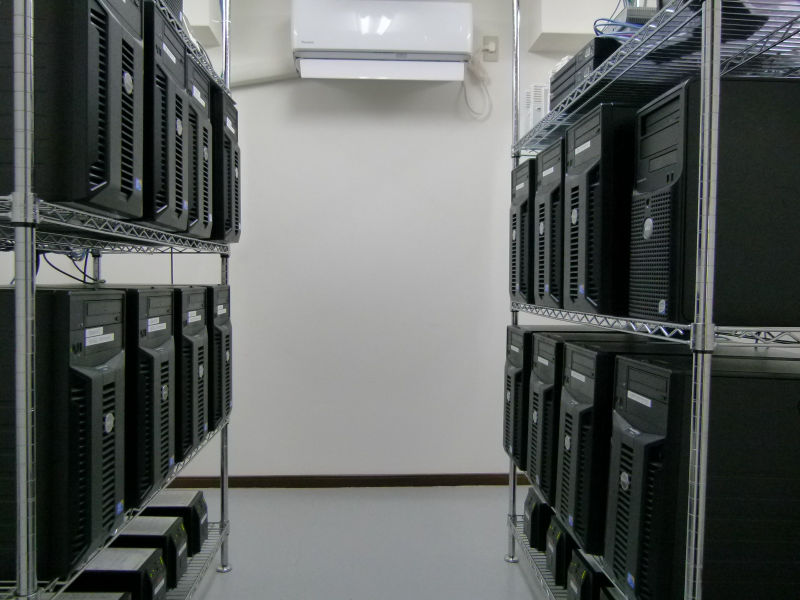
GIGAZINE's core web serverPowerEdge T310Has recently caused Kernel Panic and the server goes down. There are multiple configurations, so GIGAZINE readers browsing have no influence, but they can not leave them internally, but DELL Although it makes inquiries to maker support, etc., it was hard to identify the cause, but it was a mystery phenomenon, but the cause was finally identified and finally it recovered somehow.
If you are suffering from similar things, it may be useful for problem identification, the record of the whole struggling unexpectedly struggle is from the following.
· May 16th, 2011
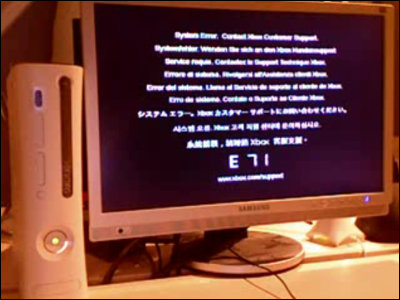
One of GIGAZINE's 3 web servers is found to be stopped. On the screen "Kernel Panic" letters appeared, it was in an inoperable state, so we forcibly restart.
The character of "Kernel Panic" displayed on the console
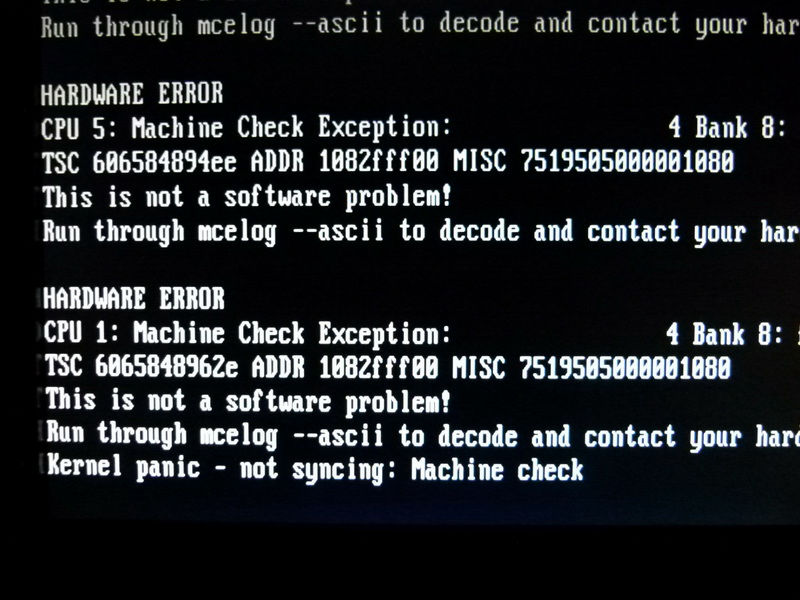
After rebooting, when checking the / var / log / messages log, "Machine check events logged" was displayed, so check meclog. Looking at the contents of meclog, it says "HARDWARE ERROR" as follows, a message stating that it is a hardware-aware error, and as it is confirmed that CPU error has occurred, contact DELL Technical Support To do that.
MCE 0
HARDWARE ERROR. This is * NOT * a software problem!
Please contact your hardware vendor
CPU 1 BANK 8 TSC 25 fa 59 bc 557218 [at 2926 Mhz 42 days 6: 48: 3 uptime (unreliable)]
MISC 8e 02082000000186 ADDR 1082 baf 00
MCG status:
MCi status:
Error overflow
MCi_MISC register valid
MCi_ADDR register valid
MCA: MEMORY CONTROLLER RD_CHANNELunspecified_ERR
Transaction: Memory read error
STATUS cc0001800001009f MCGSTATUS 0
MCE 1
HARDWARE ERROR. This is * NOT * a software problem!
Please contact your hardware vendor
CPU 3 BANK 8 TSC 25 fa 59 bc 557 420 [at 2926 Mhz 42 days 6: 48: 3 uptime (unreliable)]
MISC 8e 02082000000186 ADDR 1082 baf 00
MCG status:
MCi status:
Error overflow
MCi_MISC register valid
MCi_ADDR register valid
MCA: MEMORY CONTROLLER RD_CHANNELunspecified_ERR
Transaction: Memory read error
STATUS cc0001800001009f MCGSTATUS 0
Hardware maintenance Since we are in 3 years, we decided to call DELL Technical Support as soon as possible.
Support.Jp.Dell.Com - Technical support (telephone support)
The official name is "corporate-related maintenance service" three-year next business day compatible on-site maintenance service ". With the feeling that you can make various combinations,
· 24 hours 365 days phone support 1
· 3 years DirectLine (software phone support) 1
· 2 - 3rd Year Next business day compatible Onsite maintenance service (business trip repair) 1
· 2 - 3 year parts warranty 1
· 3 years next business day onsite onsite maintenance service (6 business days 9-17 o'clock)
It is in the form that it is entering into maintenance service as one turn.
Explanatory PDF file
http://jpapp1.jp.dell.com/jp/downloads/pdf/catalog/ep_ss_hardware.pdf
An announcement flows when you call DELL Technical Support, "Please enter express service code and press # at the end". According to the guidance, entering express service code, mistake something, the same guidance continues to flow many times ... .... After entering the Express Service Code about three times, the next announcement finally flows and enters the maintenance service form according to the guidance, but this also leads to guidance over and over again. When I was repeating the same input about 3 times, it became silent state, so I left it for a while.
-5 minutes lapse -
Silence continues
-10 minutes has passed -
Further silence continues
-15 minutes has passed -
... ... Turn off the phone and hang up. It seems that the telephone inside the editorial department can not operate normally according to the guidance, so I tried hard from the mobile phone and it was connected to the operator all at once. It seems that there are times when you can not operate normally with a phone model.
Explaining the situation because it was connected safely to DELL technical support,BMCSince it is said that we want you to check the log, we will ask you to guide confirmation items while keeping the phone connected. After reading the BMC log and informing the operator of DELL, it means that an error is not detected. If there are 3 servers with the same configuration as the present situation, tell them that the current phenomenon is occurring with only this one and check whether there are any other parts to check, the log at "Diagnostics Diagnostic Tool" Answer that I want you to take and analyze.
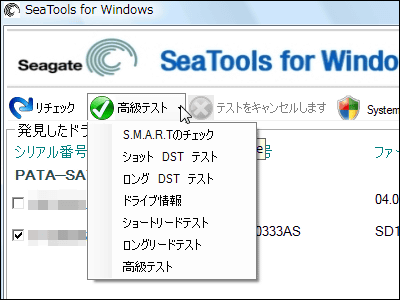
That's why you downloaded Diagnostics Diagnostic Tool's download destination and procedure by e-mail and download it. Diagnostics Diagnostic tool creation program on such a screen.
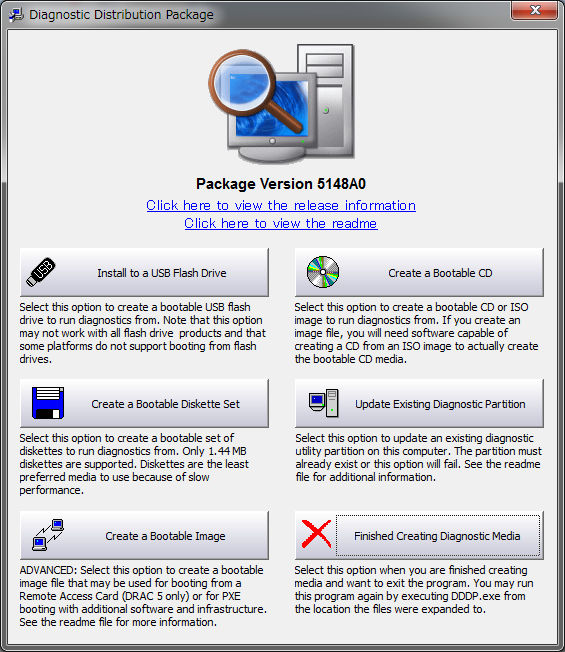
Diagnostic tool There are four ways to create boot media.
1. floppy disk
2. Boot with CD-R etc.
3. Boot in USB memory
Four.PXEboot
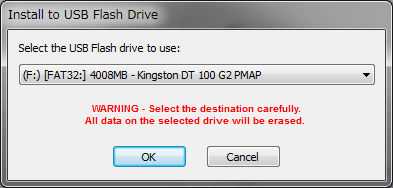
Since blank CD-R is not at hand, there is no floppy drive built in this server, there is no PXE server, so "3. Boot in USB memory" is chosen this time. Connect 4GB USB memory and run diagnostic tool creation program.
Here you can see if the USB memory is well recognized. 4GB USB memory recognition
The moment you press the OK button, you will see an error screen.
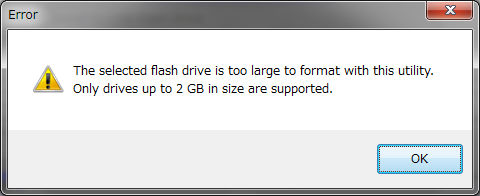
It seems that it only supports up to 2GB of USB memory, so I can not help it, so I searched inside the editing department and discovered a 256 MB USB memory.
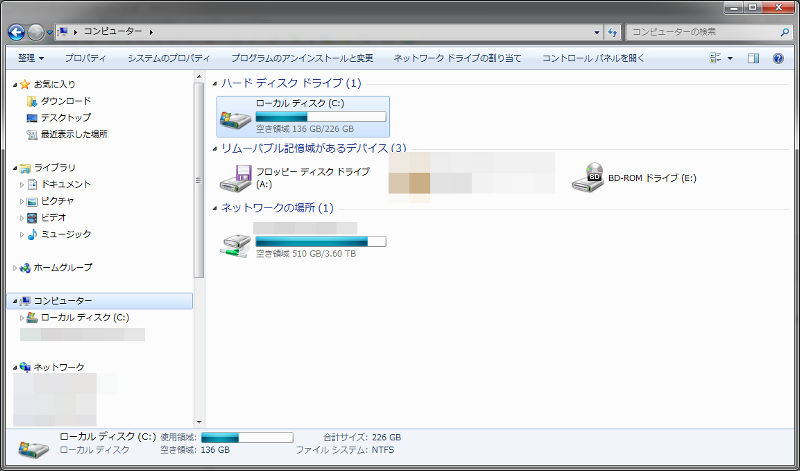
Make sure that you can connect and recognize it.
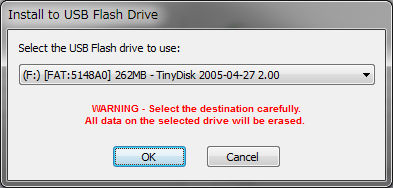
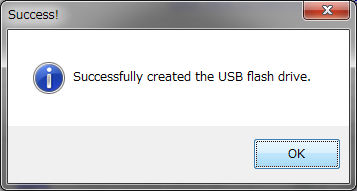
When you press the OK button, this time installation starts
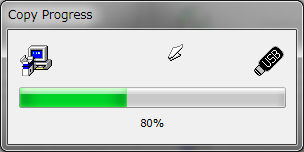
Created in about 10 seconds
This time, if you connect to the server and start up from the USB memory, you should be able to collect the diagnostic tool log, so it is done immediately. However, somehow it does not start ... .... A state in which the boot area is not properly set or does not activate at all. A state in which it can not be started yet even if it is formatted and recreated with the boot partition created. Because time has come to time, we will prepare a blank CD-R and plan to resume work the next day.
· May 17th, 2011
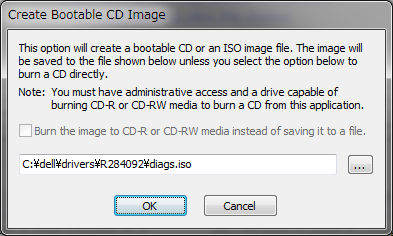
Next day, prepare a blank CD-R and create a diagnostic tool.
You can select ISO file creation method, blank CD-R writing method, directly write CD-R directly
Start it up next time! Put the CD-R in with the wish called, start the server. Set CD boot and start up normally.
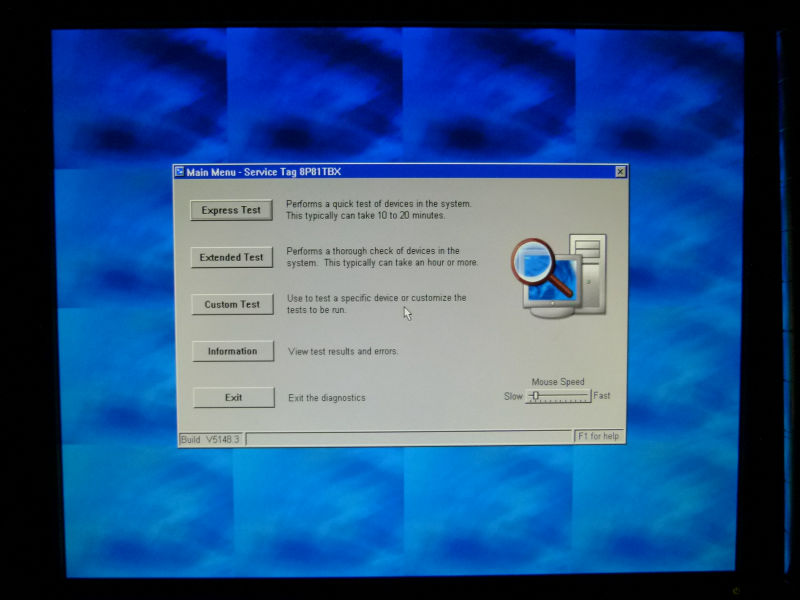
The menu when starting the diagnostic tool's CD looks something like this
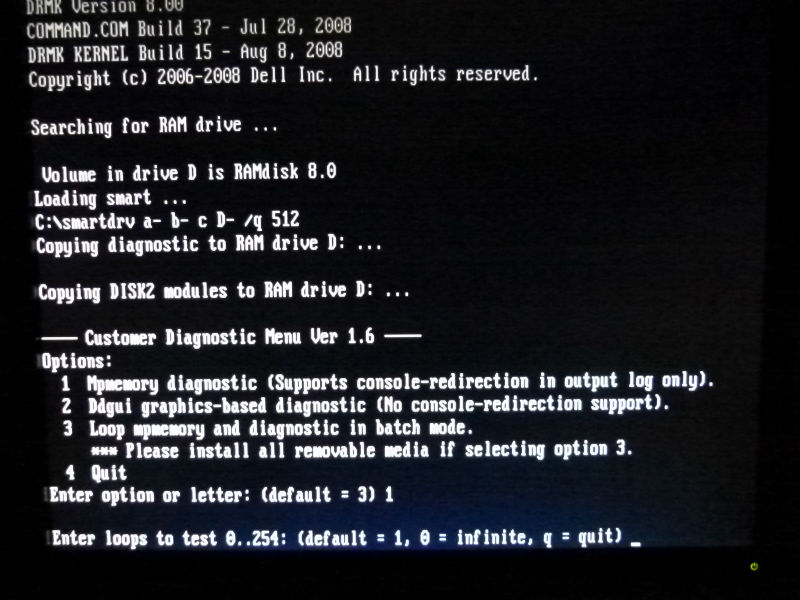
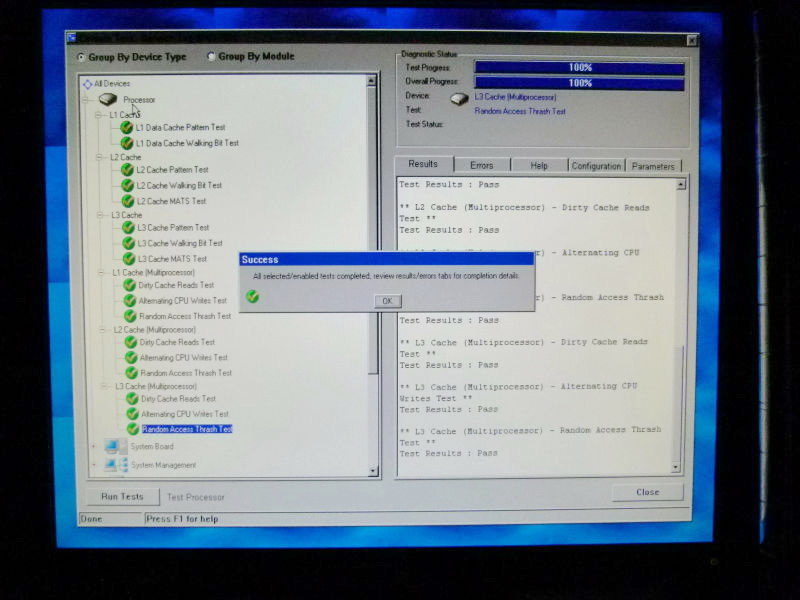
Execute the check tool according to the check procedure. This is the CPU check execution screen.
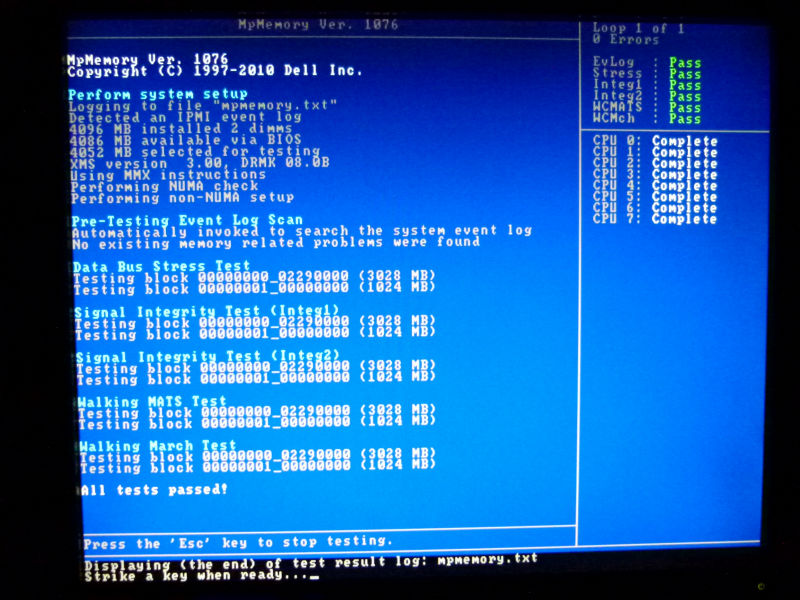
As described in the procedure, check the CPU, but finish without error. I wanted to retrieve the log and send it, but this time I can not recognize any media for saving the log. Rather than being a CD boot, it seems that you can not save anything with a USB memory etc at all, so shoot the screen without fail and send the image by e-mail. To have it analyzed. After that, even after more than an hour, I have not heard from you, I will wait for a while, but I have no contact. When I call technical support again and check the situation, since there is no error, I answered that it is impossible to replace hardware in the current state. Also, it is worth noting that the installed OS is CentOS 5, that it is not supported by DELL's server, and that BIOS version is not up-to-date and should be updated to latest one. Furthermore, it is told that I want you to check whether there is an error on the memory side, ask the memory test procedure and carry out the check tool again.
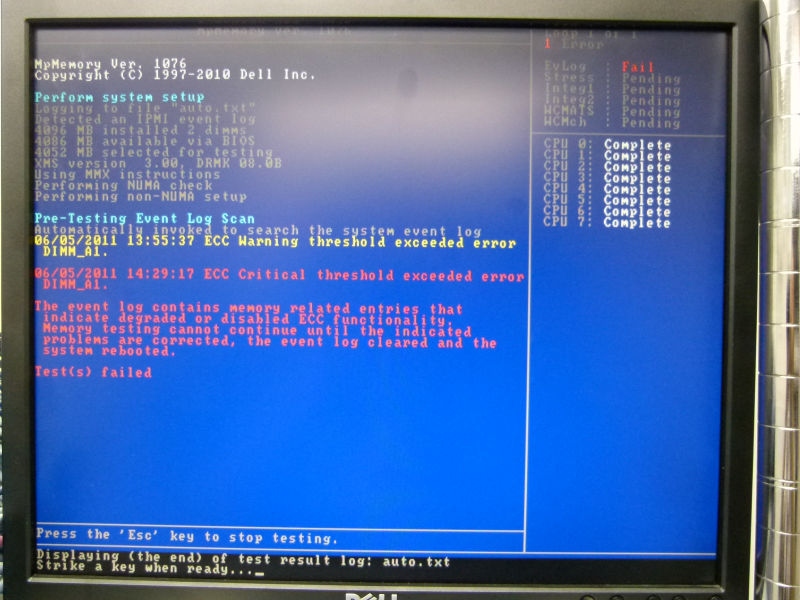
Because the same diagnostic tool can check each hardware, we tried to check the memory and try shooting again and shoot the on-screen display, but logs are displayed for a lot of logs appearing on the screen Abandoned because it was in a state that there were few parts. I checked to see if it could be saved with USB memory, but when I started diagnostic tool with USB memory connected, I fell into the situation that I did not recognize the USB memory, and I was searching for other means, but a USB connected floppy drive Discovered! It is! It is!
USB floppy drive excavated in the editorial department (Made by Logitec)
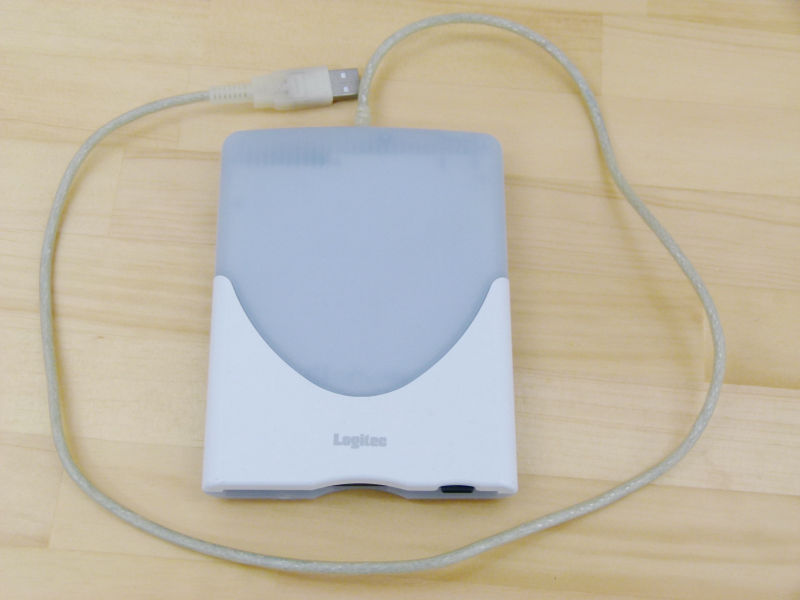
Windows 7 64 Bit also recognizes properly so it looks like it is not broken
However, this time, I can not find the floppy disk of the bottom. Further discovery, finding a floppy disk finally finally, finally creating a diagnostic tool with a floppy version. Since reading speed pulls the feet, it is no use state that startup is slow slowly. Diagnostic tool finally started after about 5 minutes.
The diagnostic tool screen looks something like this
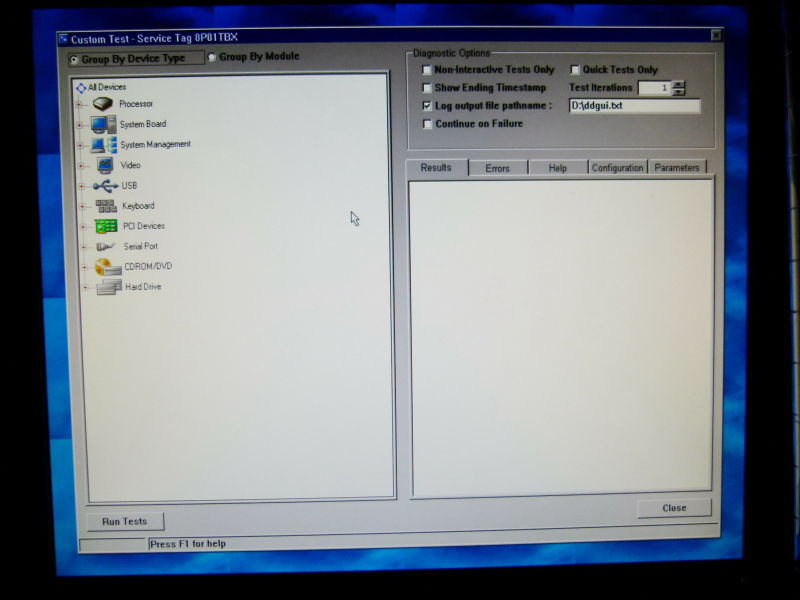
Custom Test screen
Screens running Custom Test
I execute the procedure and check the contents of the log at first, but there is nothing like an error in particular. As a precaution, attach the log directly to the e-mail and send it.
Also, although I was warned from the beginning this time, because I am installing OS is CentOS 5, it is not supported by DELL server and I want BIOS to update to the latest version because BIOS version is not up to date There was also attention to it, so we decided to start considering coping with that.
· 30th May 2011
Server down occurred again, since the server was down due to the same phenomenon as before, there is no error even if each server performs a check again after rebooting for the time being.
· 13th June 2011
The third server down occurred. Since it is hard to think that only the same server drops three times in this state, we do not use the diagnostic tool of DELL but perform error checking from another viewpoint.
● Part 1. Use stress to apply a load for 2 to 3 hours in each of the state combined with CPU, memory, I / O etc. individually.
I used "stress" on the site below.
Stress project page
http://weather.ou.edu/~apw/projects/stress/
For download and installation procedures, usage etc., see below.
Pclinuxtips @ Wiki - Linux Stress Test
http://www46.atwiki.jp/pclinuxtips/pages/41.html
As a result, it becomes heavy frequently, but it does not go to server down.
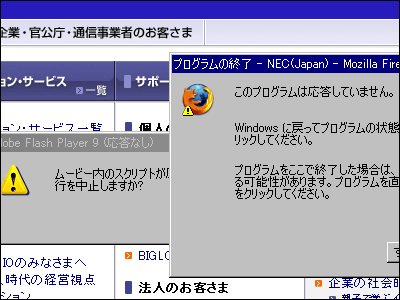
● Part 2. Although it does not fall just by starting normally, since it will be lost if you run it as a web server, use the ab command to bring up multiple apache processes
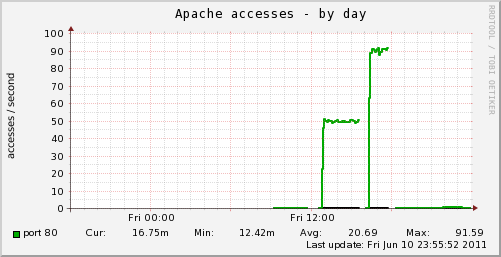
As a result, if load is applied for about one and a half hours, the server is down and it is understood that the same error occurs.
Because the munin's Apache Access graph also falls frequently, it becomes this state
If you try the state of "part 2" several times and logs of memory (vmstat), CPU (mpstat), I / O (iostat), and process list (ps) are taken at regular intervals, CPU (mpstat) To feel uncomfortable with the log of.
Immediately after startup mpstat
16:28:03 CPU% user% nice% sys% iowait% irq% soft% steal% idle intr / s
16: 28: 03 second all 3.66 0.00 1.91 0.56 0.06 0.39 0.00 93.43 2874.36
16: 28: 03: 0 3.61 0.00 1.99 0.94 0.00 0.11 0.00 93.3 55 100 3.77
16: 28: 03: 1 3.56 0.00 2.09 0.48 0.10 0.11 0.00 93.66 11.73
16 hours 28 minutes 03 seconds 2 3.54 0.00 1.84 0.57 0.01 0.11 0.00 93.93 2.40
16: 28: 03: 3 3.79 0.00 2.0 3 0.42 0.33 2.35 0.00 91.08 185 2. 12.
16: 28: 03: 4 3.50 0.00 1.85 0.56 0.00 0.09 0.00 93.99 0.00
16: 28: 03: 5 3.50 0.00 1.88 0.48 0.00 0.11 0.00 94.04 0.79
16: 28: 03: 6 3.53 0.00 1.84 0.50 0.00 0.12 0.00 94.0 1. 1.21
16: 28: 03: 7 4.22 0.00 1.75 0.52 0.01 0.09 0.00 93.41 2.34
Mpstat just before server down in load condition
17:49:03 CPU% user% nice% sys% iowait% irq% soft% steal% idle intr / s
17: 49: 03 second all 12.28 0.01 5.99 2.13 0.13 1.02 0.00 78.45 6690.92
17 hours 49 minutes 03 seconds 0 11.88 0.00 6.15 1.76 0.00 0.36 0.00 79.84 1001.06
17: 49: 03: 1 12.00 0.00 6.07 1.63 0.08 0.31 0.00 79.9 1 11.88
17 hours 49 minutes 03 seconds 2 11.95 0.08 6.00 5.38 0.05 0.35 0.00 76.19 10.55
17 hours 49 minutes 03 seconds 3 12.51 0.00 6.13 1.41 0.89 5.78 0.00 73.29 5664.78
17: 49: 03: 4 11.92 0.00 5.94 1.67 0.00 0.35 0.00 80 0.11 0.00
17 hours 49 minutes 03 seconds 5 11.98 0.00 6.01 1.64 0.00 0.33 0.00 80.03 0.93
17 hours 49 minutes 03 seconds 6 11.99 0.01 5.98 1.81 0.00 0.31 0.00 79.90 1.12
17: 49: 03: 7 13.99 0.01 5.60 1.77 0.00 0.33 0.00 78: 30 0.59
Interrupt processing frequently occurred to the CPU number "3" of the CPU interrupt request (Interrupt ReQuest, abbreviated as IRQ, the part indicated as "irq" in the above), indicating a numerical value of "0.89" .
In the item "intr / s (average number of processing interrupts per second)" that the abnormality is better understood than the IRQ, even at the time when the server was started, even at the usual high value of "1852.12", before the server was down To a higher state "5664.78". In other words, since the processing interrupt request is continuously abnormally large for one CPU, it is found that it is in the state that it does not play the role as a multiprocessor.
reference:Mpstat command - CPU usage check
http://www.syboos.jp/linux/doc/mpstat.html
In the case of other Web servers, it is true that there are CPUs with a high intr value, in that case, in this case, because it is averaged to be divided into 2 to 3 CPUs, this server only has a specific CPU It is like feeling higher. For a homogeneous server that is operating normally, it looks like the following.
16:43:04 CPU% user% nice% sys% iowait% irq% soft% steal% idle intr / s
16: 43: 04 second all 8.05 0.00 0.74 0.29 0.08 0.96 0.00 89.88 1974.86
16: 43: 04: 0 4.05 0.00 0.39 0.13 0.00 0.04 0.00 95.38 367.24
16: 43: 04: 1 4.04 0.00 0.62 0.25 0.03 0.08 0.00 94.99 4.24
16: 43: 04 second 2 4.64 0.00 0.62 0.21 0.06 0.08 0.00 94.39 6.96
16: 43: 04: 3 4.60 0.00 0.60 0.60.01 0.09 0.00 94.0 1 3.13
16 hours 43 minutes 04 seconds 4 4.52 0.00 0.51 0.13 0.00 0.07 0.00 94.77 0.00
16: 43: 04: 5 11.88 0.00 0.96 0.27 0.16 2.28 0.00 84.44 249.55
16: 43: 04: 6 15.95 0.00 1.15 0.38 0.18 2.67 0.00 79.67 430.04
16: 43: 04: 7 14.74 0.00 1.08 0.29 0.15 2.35 0.00 81.38 295.00
The same phenomenon did not occur even if checking other servers, etc. It was an event occurring only with this server, so if you try to run DELL's diagnostic tool again, you will notice that an error occurs during startup of the diagnostic tool in the first place It was.
Diagnostic tool startup error
I will call DELL Technical Support again here, but an announcement flows, "I can not connect because of a technical problem, please wait a while ....". I thought, "Technical problem ...?"? However, after I left the phone for about 30 minutes, I got connected quickly, so I explained the circumstances and current situation. Because I was told that you want me to send error information, I send you by e-mail and call back, DELL sends a tool for information gathering due to memory error rather than CPU error, so information I want you to collect and email again.
Unlike the previous diagnostic tool, this time it is a method to collect logs directly from BMC, so it is only necessary to set up the server side and execute the program on the client PC, so the procedure like the last time It seems to be finished first.
Unzip the sent ZIP file, put the exe file directly under C drive, execute the command from the command prompt as it is.
IPMIExecution screen of log collection tool
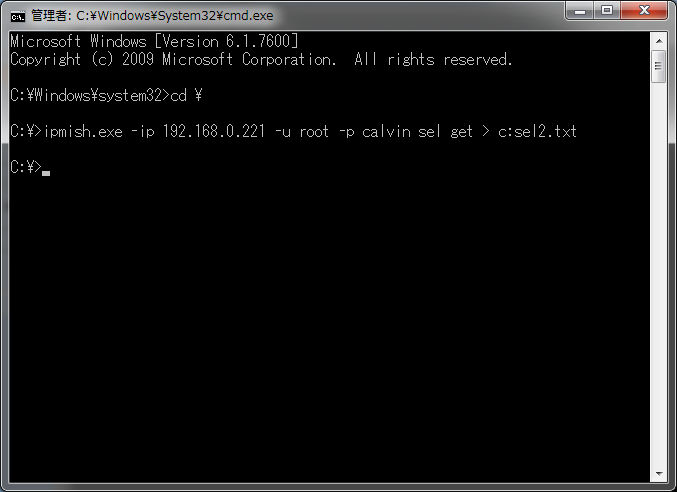
Just to be sure, if you check the contents, you can see that the following error has occurred.
Severity: critical
Date and Time: Mon Jun 13 04: 02: 16 2011
Description: ECC Uncorr Err: memory sensor, uncorrectable ECC (Memory Board J DIMM 1) was asserted
Send the information as it is and contact the technical support again. After having confirmed the contents, "Since the memory does not recognize one, it is in a state like now, because I will arrange memory exchange ... ..." finally arranging the hardware exchange Take off, memory and workers come.
At this time the following notes will be handed down.
1. Shutting down the server is necessary for memory exchange, so I want you to back it up
2. Since the alert on the front panel does not disappear even if memory exchange is performed, the worker performs work of releasing the alert at the time of memory exchange
3. Because of the OS that is not supported, there is a possibility that it will not work properly even if this memory exchange work / alert release is done, in that case I would like you to consider replacing the OS
Regarding notes, make only the content confirmation and make it in preparation for the exchange work of the next day.
· 14th June 2011
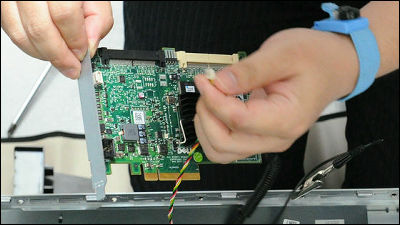
Memory exchanging work day, memory arrived from DELL after 9:00 am, afterwards we just await the DELL workers who are arranging. A worker arrived around 9:50, he was a worker wearing a suit, so she was surprised a little but she told the server room to check the current situation with the worker.
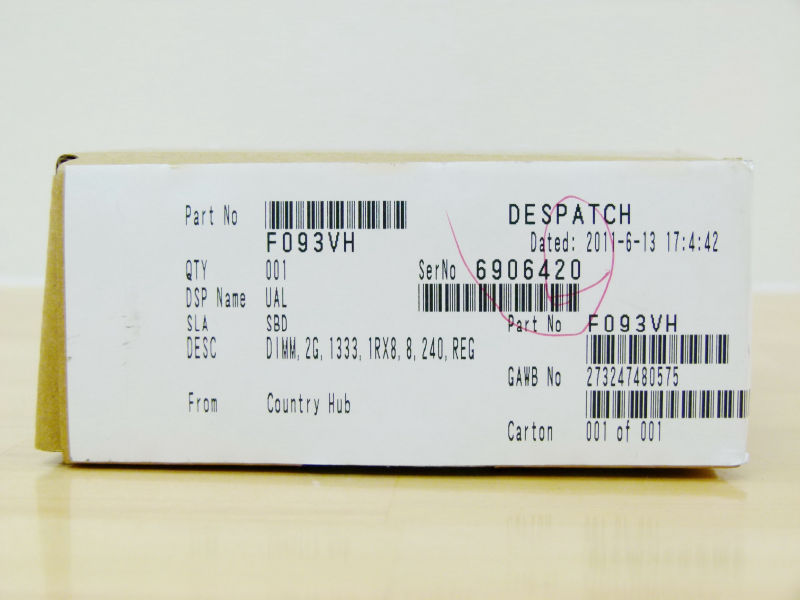
The replacement memory that was sent (as it is packed for worker delivery)
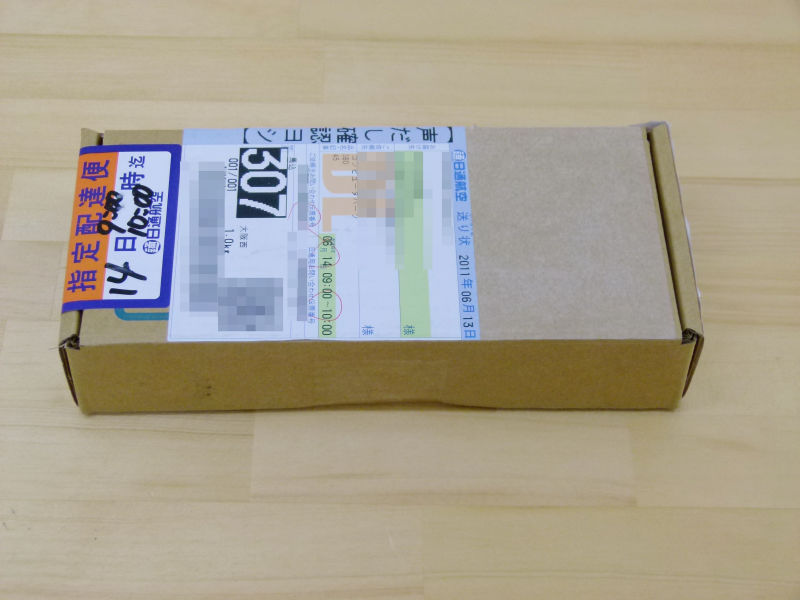
In addition, it was on about 13 o'clock on the same day that DELL 's support "Arranging for replacement due to memory problems" was made around 11 o'clock on June 13, and parts were arranged As you can see from the seal on the right side of the photo below, it is DESPATCH (shipped in large urgency) at 17: 04, so you can see that it was arranged after the trouble point was firmly fixed.
After 15 minutes, memory replacement work is completed. It was truly inconvenient.
After that, in order to confirm the operation, the worker started the server, checking the BMC log, there is no error, so the replacement work is finished without problems.
After that, I checked the operation of this side and confirmed that there is no error etc. at server startup, that there is no error on mcelog previously issued, and that Gigazine can browse internally and it is all done. And now, the web server of GIGAZINE is in a healthy state of operation.
Lessons Learned: Floppy disks may still be available.
Related Posts: