You can see the truth when you visualize and illustrate various data of the whole world
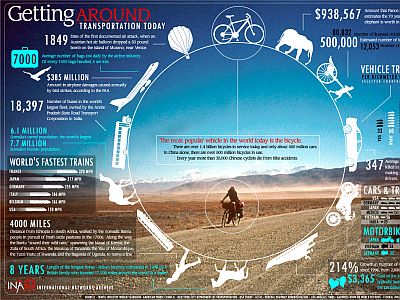
When visualizing the vehicle used worldwide and drawing it, the most used vehicles are about 1.4 billion bicycles, while the cars are 400 million vehicles worldwide. Moreover, in terms of using the bicycle, the number one place is 500 million in China. It is said that there are more numbers of bicycles used only in China rather than adding cars from all over the world ....
Of course, there are many accidents, many accidents, bicycle riding more than 35,000 people every year seems to have died in China in a bicycle accident. Visualization makes me realize a lot of things.
Other figures visualized about tobacco, water, weapons, movies, the US government, fast food chain are also released by Mr. Jonathan Harris who made this figure. None of this is quite interesting as well.
Browsing is from the following.
The Work of Jonathan Harris
http://www.number27.org/work/maps/
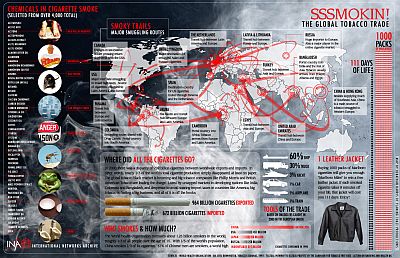
Visualize the distribution route of cigarettes. The consumption of cigarettes is overwhelmingly overstated by China.
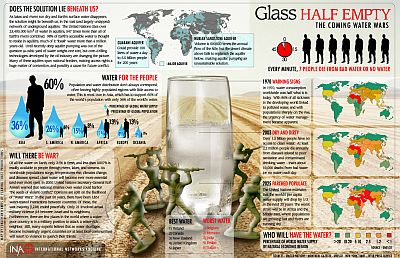
War on water. Japan is among the best five countries blessed.
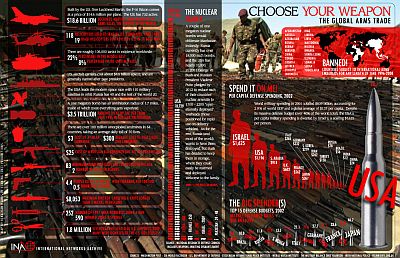
Visualize weapons. Nuclear weapons ownership is outstanding in Russia, military expenses are super-class level in the United States, but Iku and Israel are inherent in military expenses per citizen.
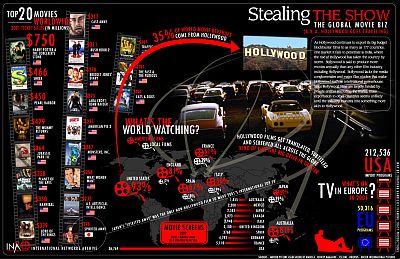
Visualize the flow of the film industry. Among the video industry, I understand the power of Hollywood in America well.
Visualize the contents of the US government. Approximately 1% of all the people in the US work in a government agency somewhere, the proportion of seeing their workers by population. Red letters are among those involved in weapons related.

Last is about fast food chain. McDonald's too strong. I understand that Starbucks is also quite amazing.

Related Posts:
in Note, Posted by darkhorse
