ZABBIX comprehensive monitoring software such as free server and network version Japanese version
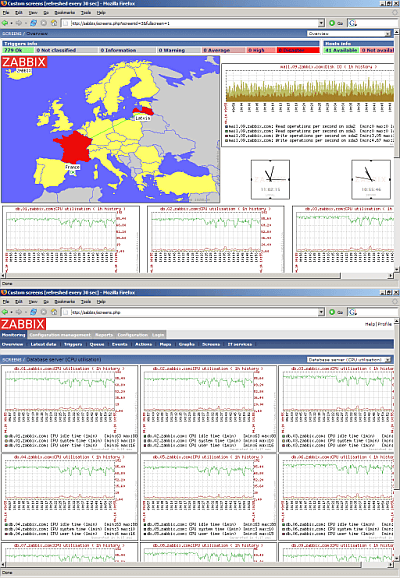
It is developed with open source, and it is made possible to do all setting and management from the browser. Graph creation function is also installed as standard. Information collection of each node, abnormality detection, failure / recovery notice, detailed alert notification function available. Supports SNMPv1, v2, v3, and works on Unix, Linux, BSD, Windows, MacOS X, NetWare etc You can monitor CPU, memory, disk, network, process status etc, and can also monitor applications such as Apache, Tomcat, Oracle. It is quite powerful.
Details are as follows.
ZABBIX-JP - Un-Official Support Page
http://www.zabbix.jp/
What is ZABBIX-JP - ZABBIX
http://www.zabbix.jp/modules/main0/index.php?id=1
ZABBIX - JP - Features
http://www.zabbix.jp/modules/main0/index.php?id=3
ZABBIX - JP - System requirements
http://www.zabbix.jp/modules/main0/index.php?id=4
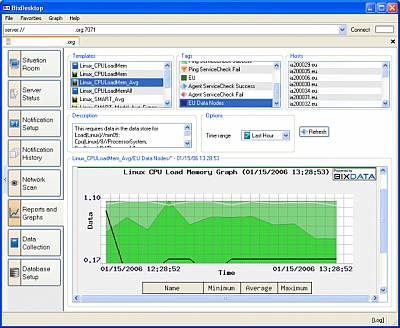
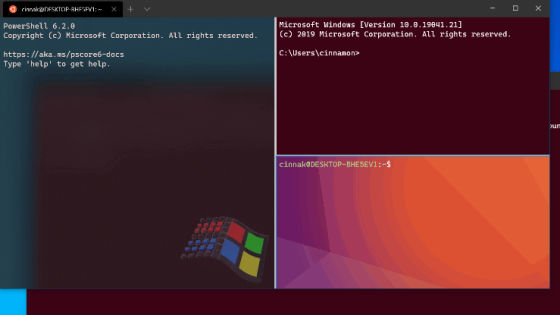
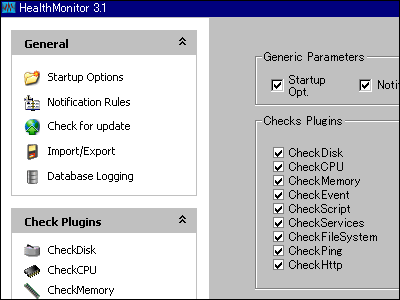
Various screenshots
http://www.zabbix.com/screenshots.php
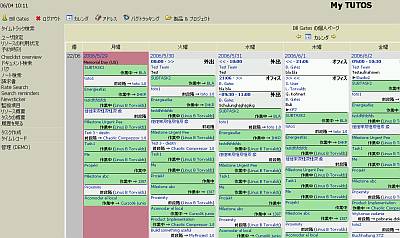
It seems quite powerful. Most importantly, most basic setting is not complicated text file operation, it is highly appreciated that it can be done by operating from the browser. It is a nice feeling because the graph will also show it.
Related Posts:


in Software, Posted by darkhorse_log