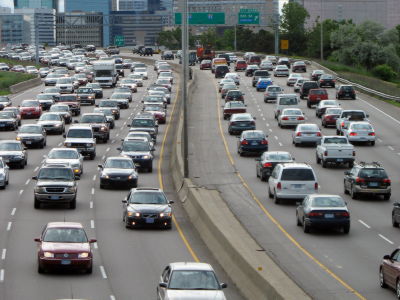
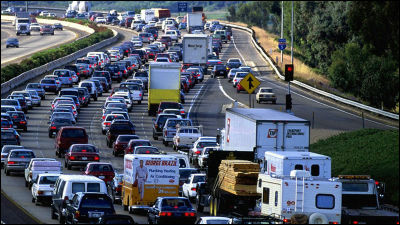
Aggressive driving in an EV can potentially drain the battery by approximately 2.5 times.
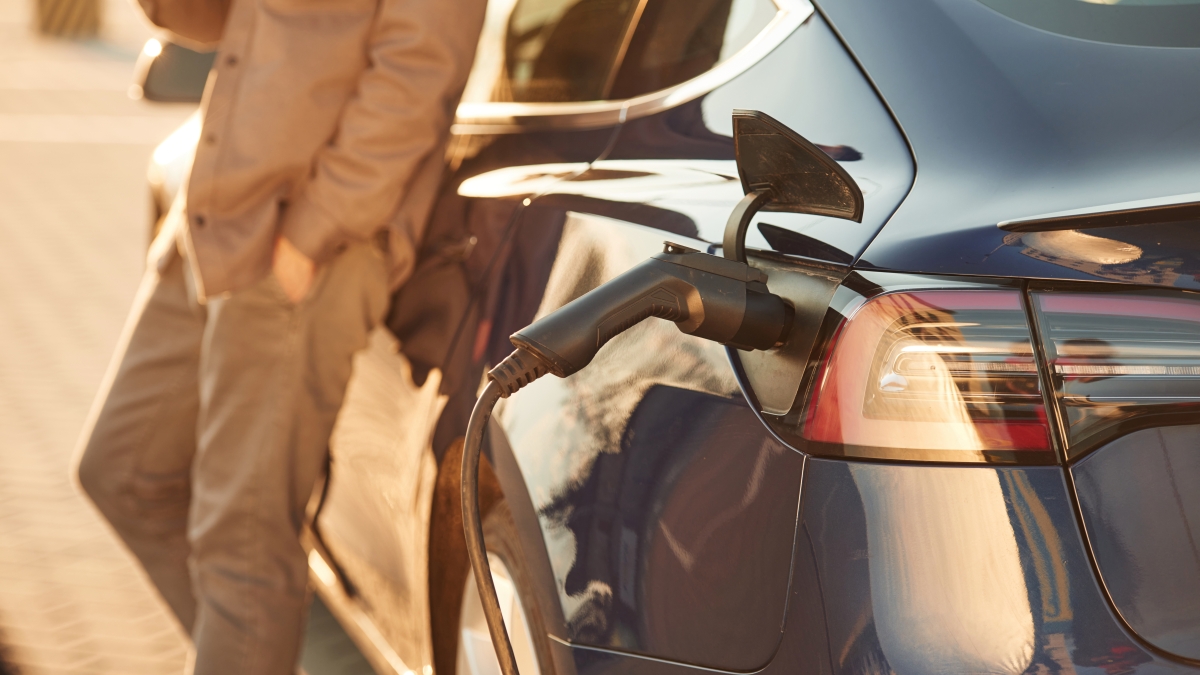
The lithium-ion batteries in electric vehicles (EVs) lose energy as they are repeatedly charged and discharged, resulting in a shorter driving range and affecting their resale value. A research team at Shanghai Electrical Engineering College in China analyzed real-world driving data from 15 EVs and found that the most aggressive driving style could result in a predicted battery capacity decrease of approximately 2.5 times after 1,000 charge-discharge cycles compared to eco-driving.
Physics-aligned causal inference of driving styles on electric vehicles battery aging | Scientific Reports
There's One Type of Driving to Avoid if You Want Your EV Battery to Last 2.5x Longer : ScienceAlert
https://www.sciencealert.com/driving-your-ev-like-a-jerk-could-wear-out-the-battery-2-5-times-faster
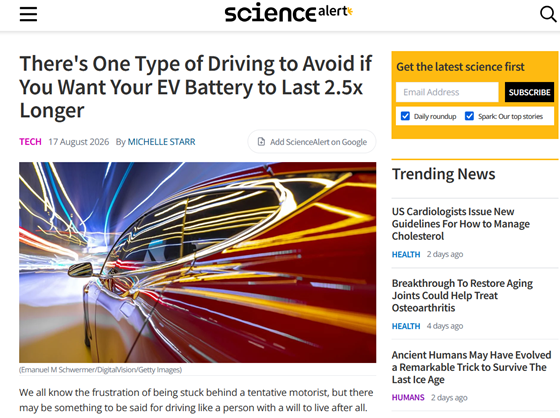
The data analyzed was collected over the course of 2022 from 15 identical electric vehicles (EVs) operating in Guangzhou, China. The data included driving in urban areas with traffic congestion, on suburban main roads, and on highways, with vehicle speed, battery current, charge status, voltage, and temperature recorded at 10-second intervals. The research team excluded data from periods of idling and when the vehicles were stationary, and then analyzed the remaining data in 60-second intervals.
The research team used machine learning to divide driving data into five groups with similar characteristics, assigning them levels 1 through 5 in order of increasing battery load. The classification used not only speed and acceleration, but also the magnitude of the current flowing from the battery. Level 1 was designated as 'eco-driving,' and Level 5 as 'the most reckless driving.' Levels 2 through 4 were not given specific names, but they represent an intermediate group where acceleration becomes more aggressive and the current flowing from the battery increases as the level rises.
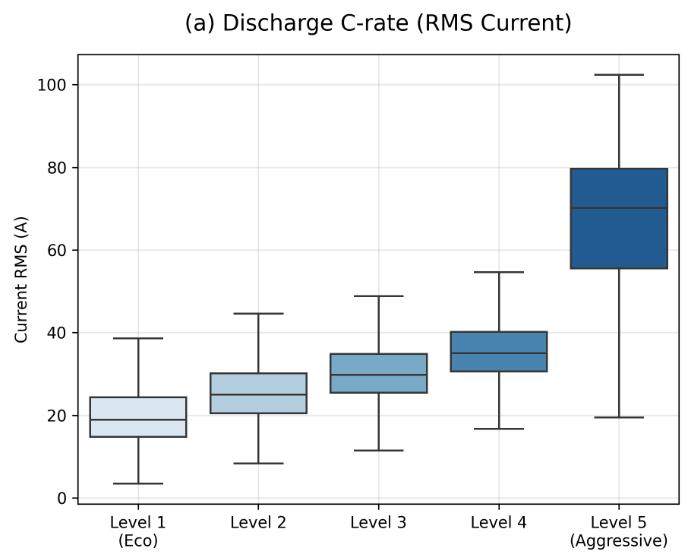
The research team compared the magnitude of the current flowing from the battery at each level and found that it increased gradually from levels 1 to 4, and then jumped sharply at level 5. The graph below compares how much current flowed from the battery during driving for each of the five driving styles, with the horizontal axis representing the level and the vertical axis representing the effective value of the discharge current. The boxes and the lines extending above and below indicate that even at the same level, the values vary depending on the driving section.
On the other hand, the average speed increases from levels 1 to 4, but drops to a level close to that of level 1 at level 5. The graph below compares the average driving speed for the same five driving styles, with the horizontal axis representing the level and the vertical axis representing the average speed for each driving section.
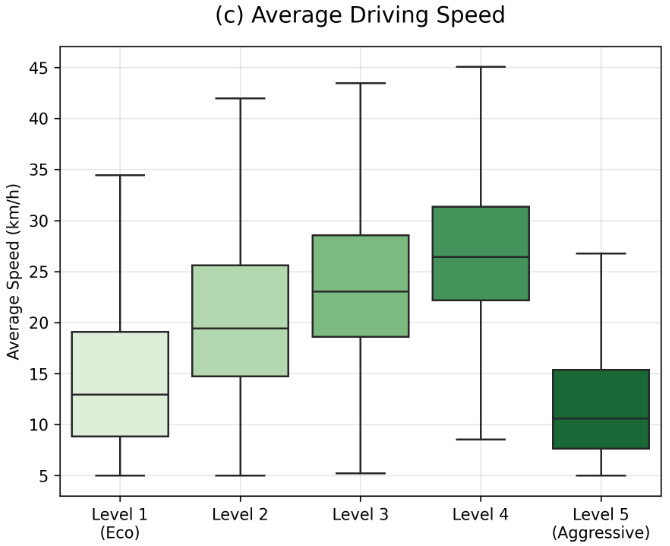
Numerically, the average speed at Level 5 was almost the same as Level 1, at approximately 15.5 km/h, while the amount of current flowing from the battery was about 3.2 times greater. The research team explained that Level 5 driving 'includes situations such as repeatedly starting at low speeds in traffic jams or driving uphill with heavy loads.' Even at slow speeds, repeatedly using high power from the motor puts a heavy load on the battery. However, since the road gradient and vehicle load were not recorded, it is not necessarily the case that all Level 5 loads are due to reckless driving by the driver.
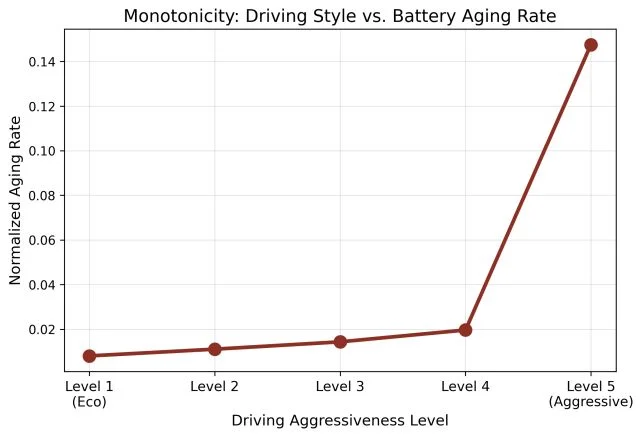
The research team inputted the battery load observed at each level into a degradation prediction model and predicted the capacity degradation rate after 1000 charge-discharge cycles. They found that levels 1-4 saw a gradual increase from 21.15% to 26.66%, while level 5 reached 53.22%. It was predicted that the most aggressive driving would result in a loss of approximately 2.5 times the battery capacity of eco-driving. The graph below compares the load on the battery during a 60-second drive, with the horizontal axis representing five driving styles and the vertical axis representing an index of load converted from 0 to 1. It can be seen that levels 1-4 show a gradual increase, while level 5 shows a large jump.
The analysis was limited to 15 vehicles of the same model that drove in Guangzhou, and data such as battery status, load, road gradient, and charging history at the start of the analysis were not recorded. Therefore, the research team stated that 'it has not been definitively proven that reckless driving is the cause of battery degradation, and should be interpreted as an estimated correlation that removes as much influence as possible from conditions other than driving.'
Related Posts: