'PGSimCity' shows how the PostgreSQL database actually works internally in a SimCity-like 3D environment.
PGSimCity · How PostgreSQL Works, in 3D
https://nikolays.github.io/PGSimCity/
GitHub - NikolayS/PGSimCity at pgsimcity-hud · GitHub
https://github.com/NikolayS/PGSimCity?ref=pgsimcity-hud
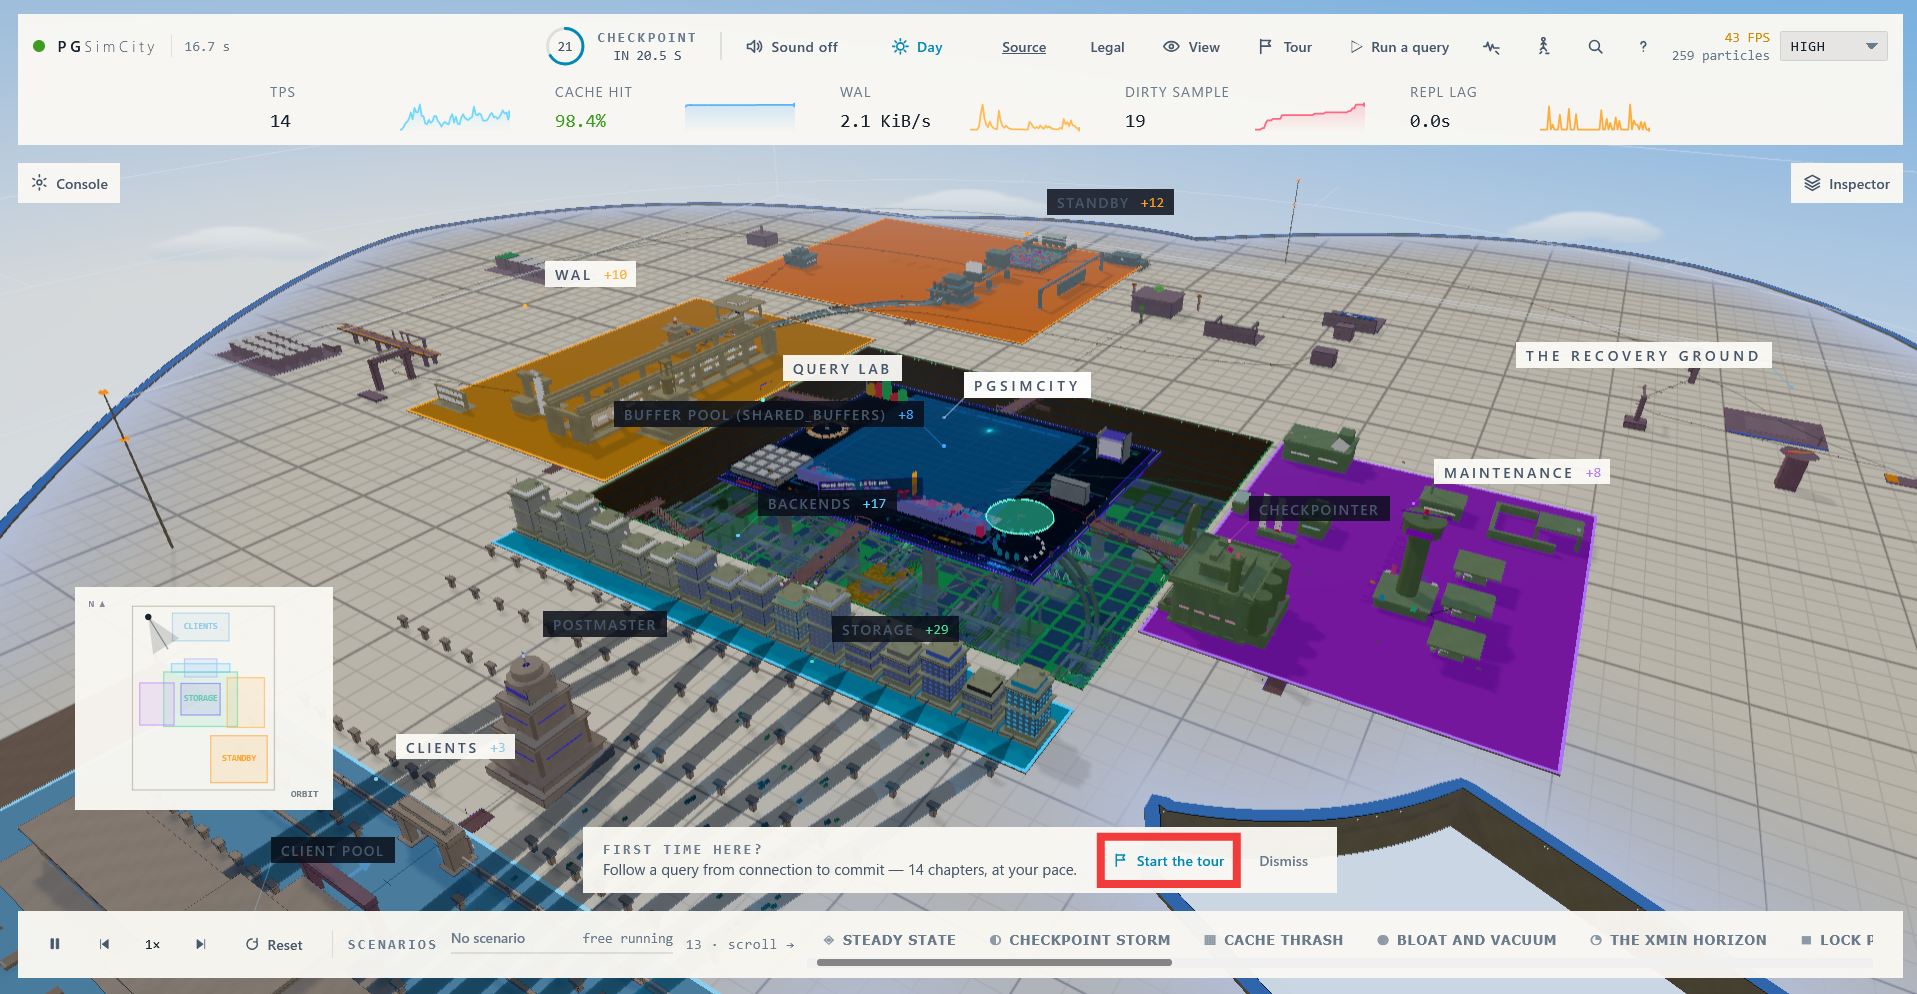
This is what it looks like when you access PGSimCity . To get a feel for the process, let's take a look at the guided tour. Click 'Start the tour'.
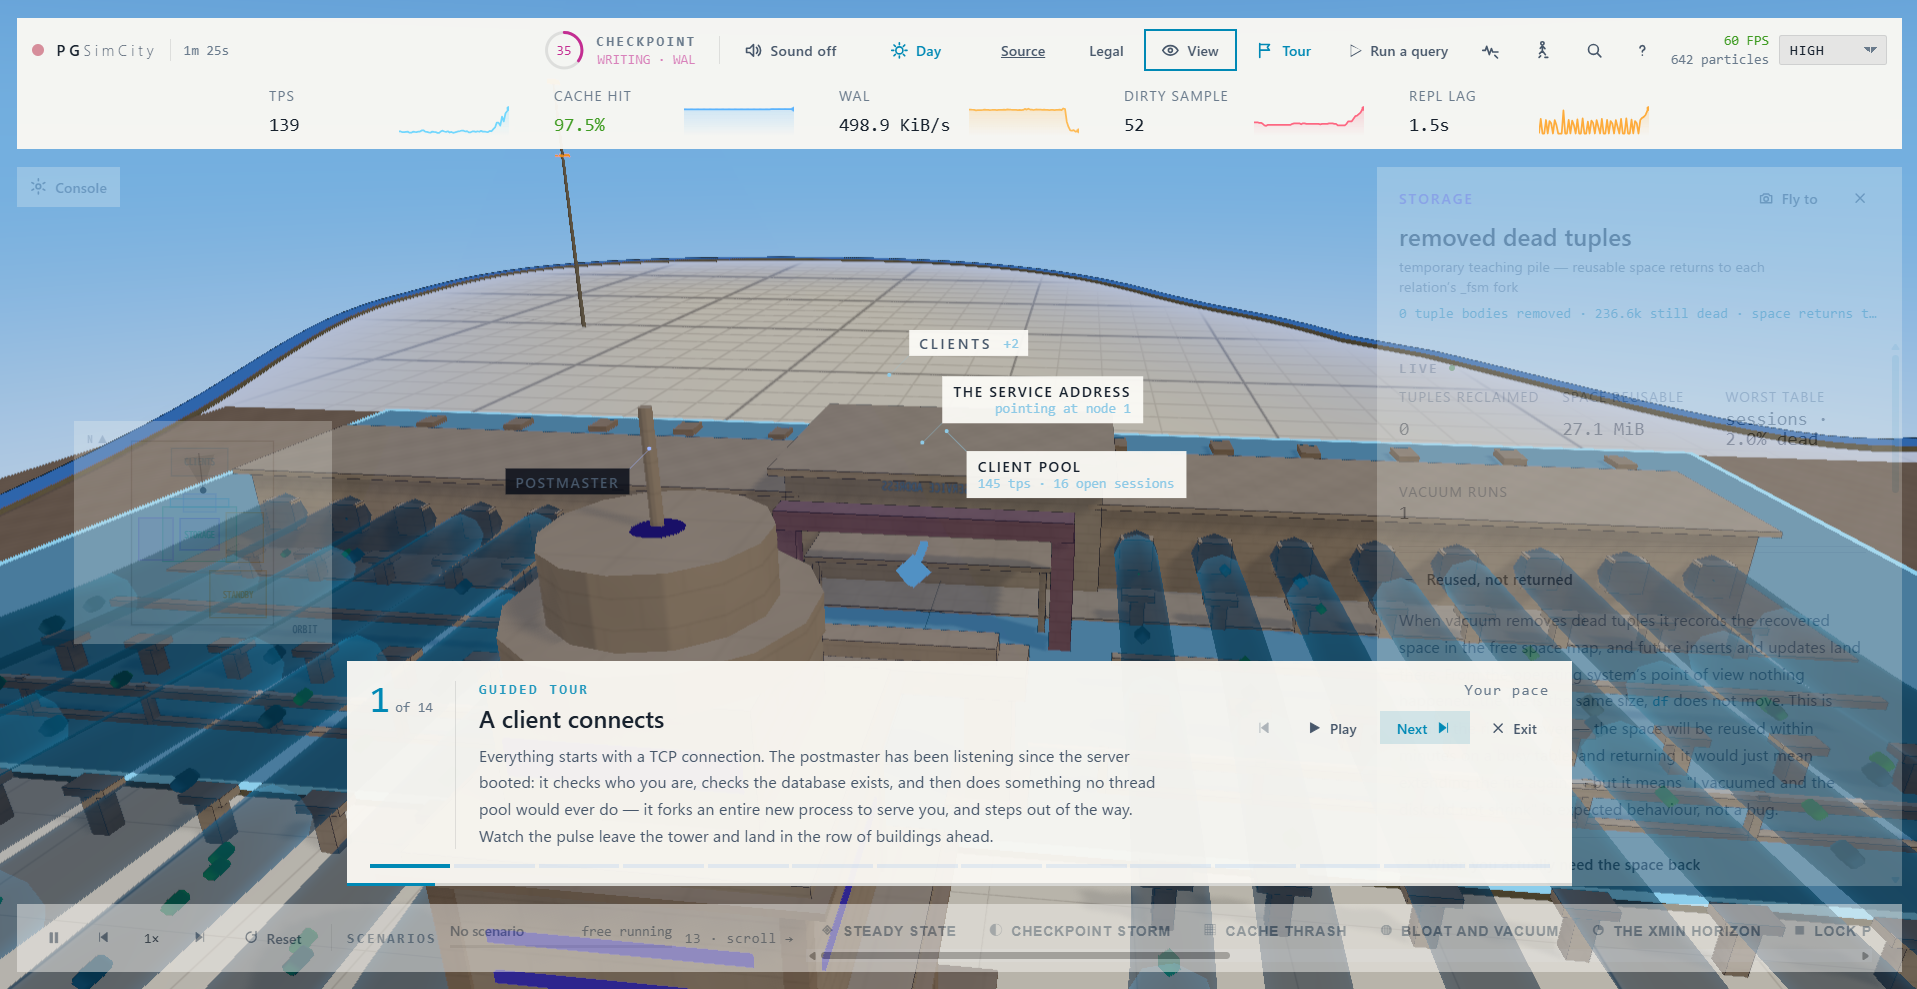
The guided tour begins by showing where the connection to PostgreSQL starts. 'The service address' in the center of the screen is the entry point for the connection, illustrating how the TCP connection from the client reaches the Postmaster, and from there it is passed on to the backend that handles the actual processing. The Inspector on the right displays 'removed dead tuples,' illustrating the flow of client connections extending from the bottom left, with the Postmaster acting as the server-side reception point.
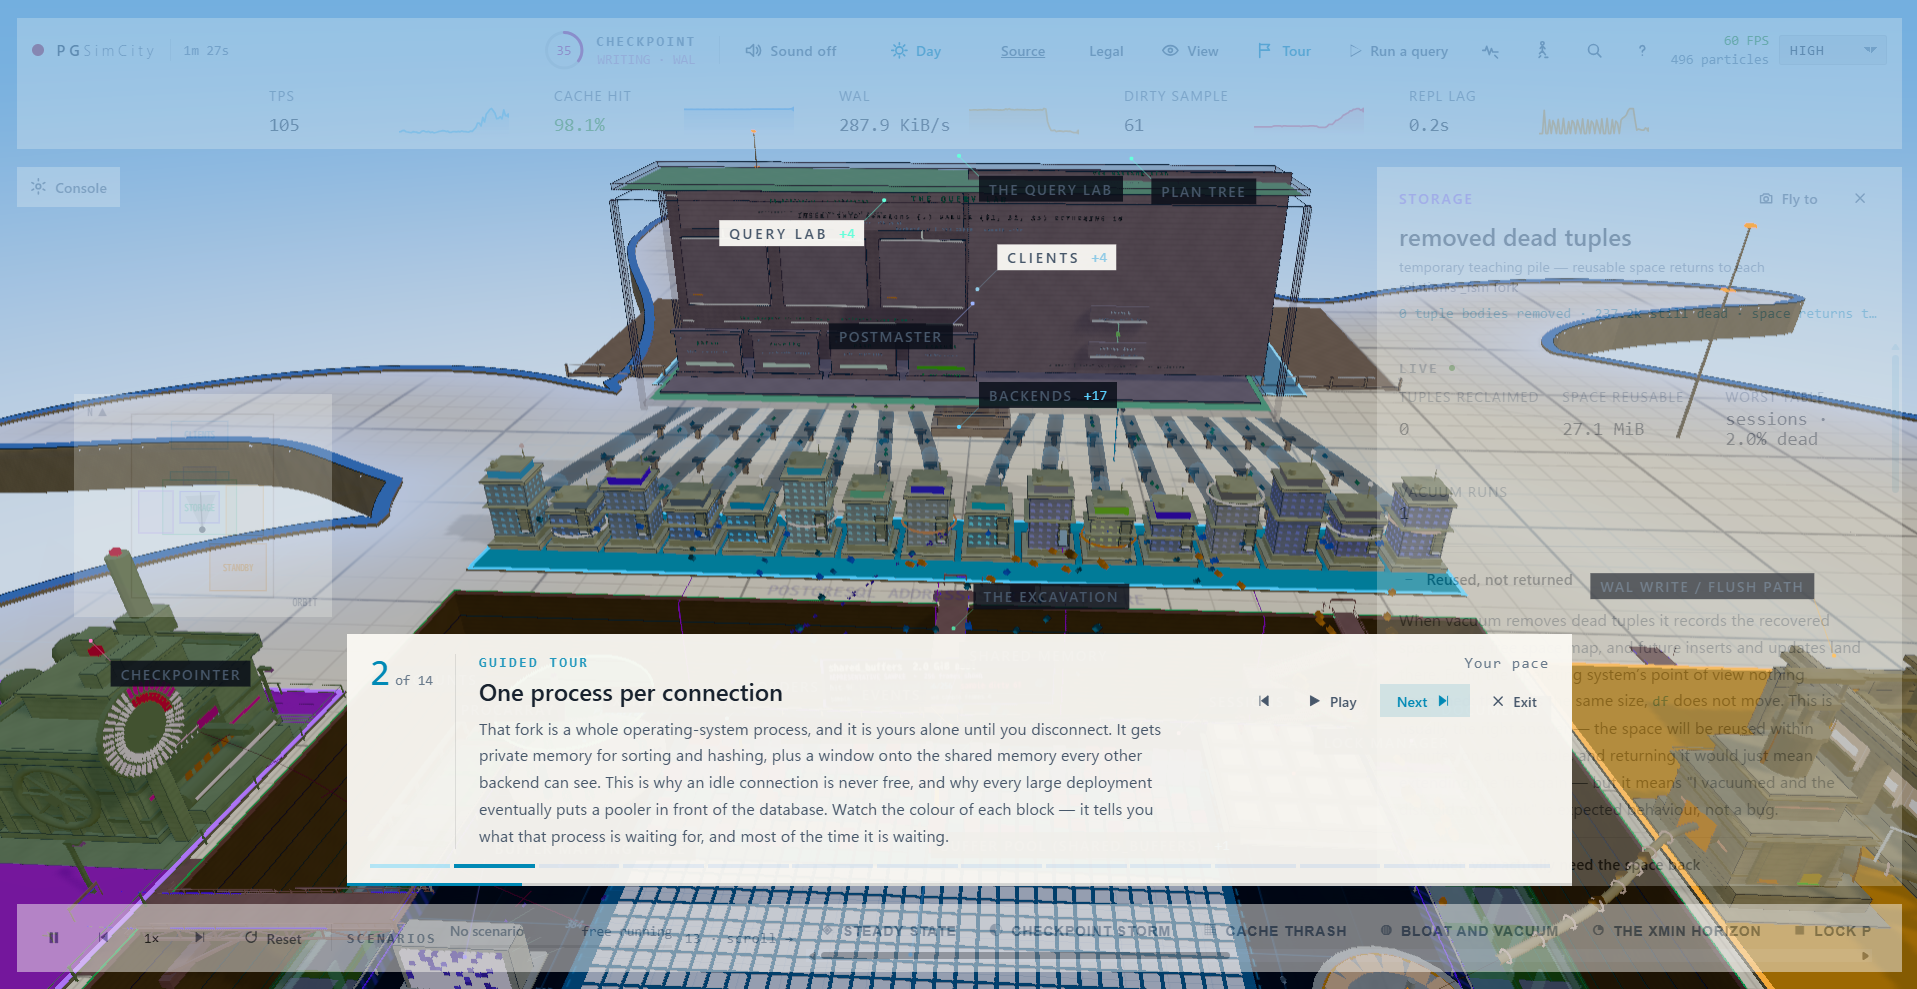
This is how PostgreSQL assigns a backend process for each connection. The buildings lined up in the foreground of the screen represent each backend, and the number of dedicated processes increases as the number of connections increases. In PostgreSQL, even waiting connections incur memory and process management costs, so connection pooling is important.
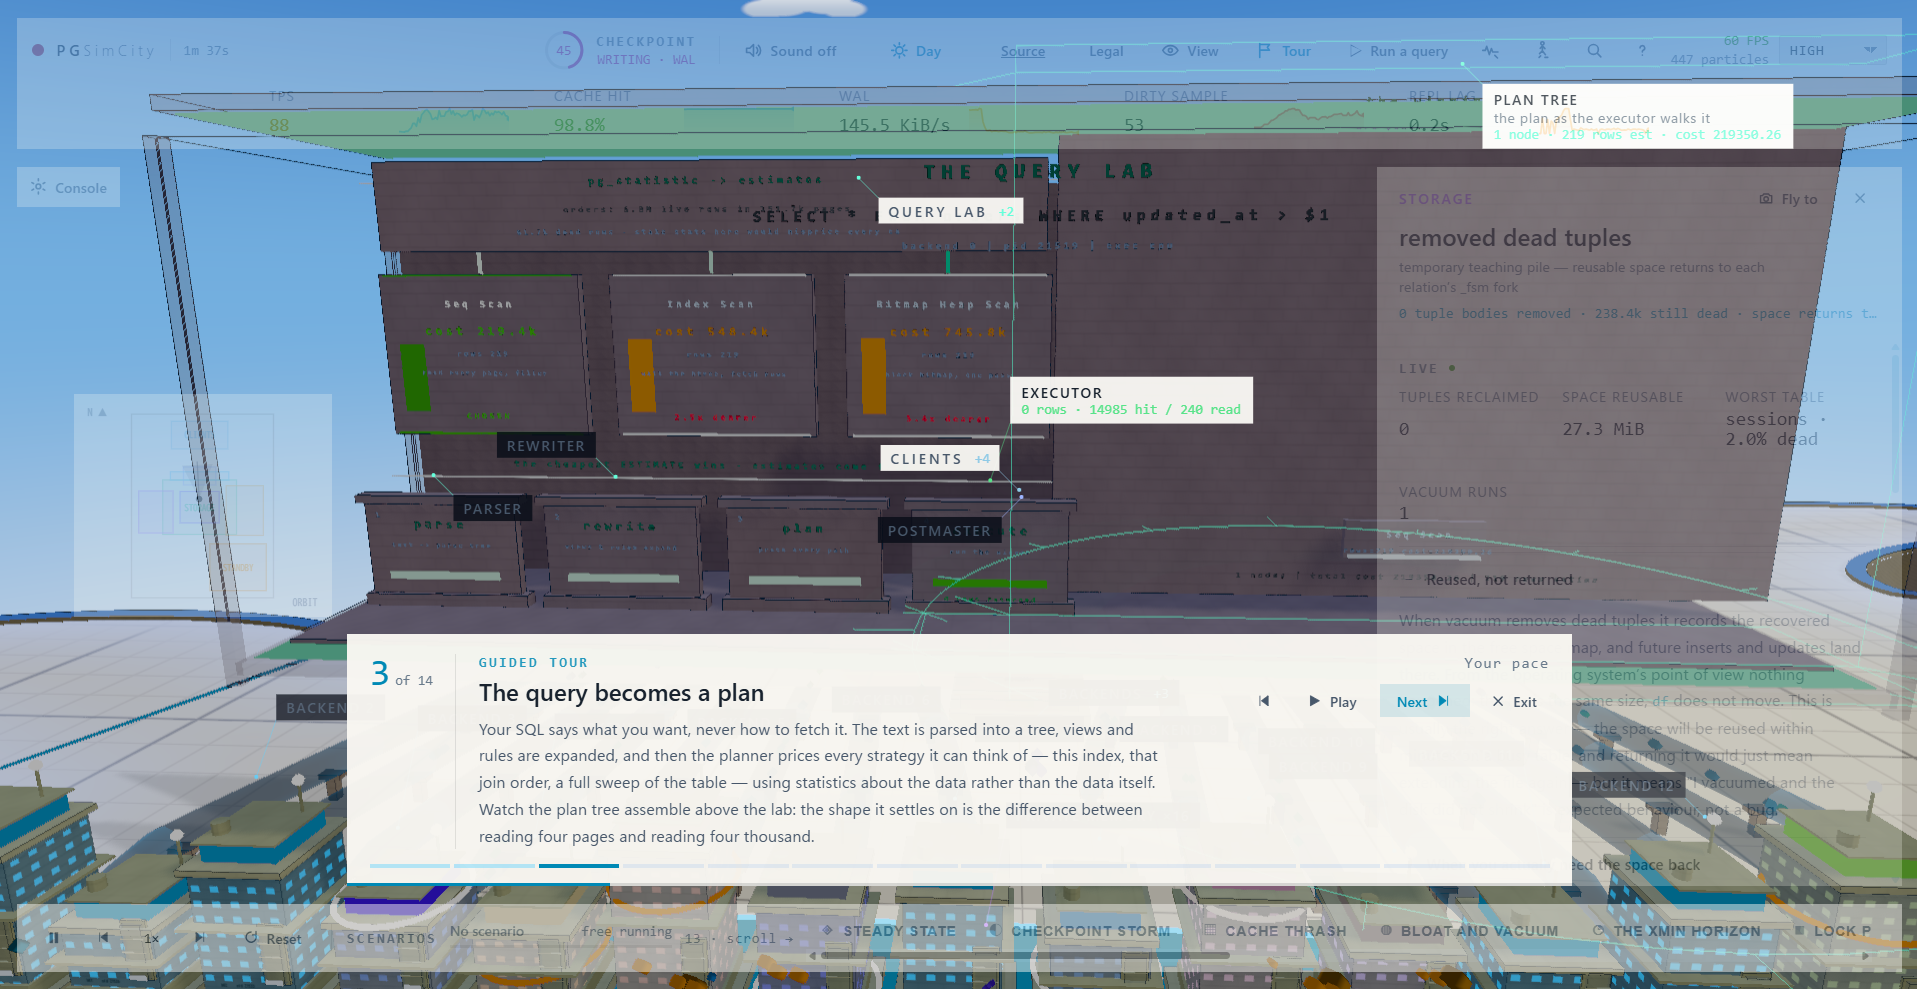
In 'Query Lab,' where SQL is converted into an execution plan, the SELECT statement is displayed at the top of the screen, while the processes corresponding to Parser, Rewriter, Planner, and Executor, as well as candidates such as Seq Scan, Index Scan, and Bitmap Heap Scan, are listed at the bottom. SQL specifies 'what data you want,' and PostgreSQL estimates and decides which path to actually read the data using statistical information.
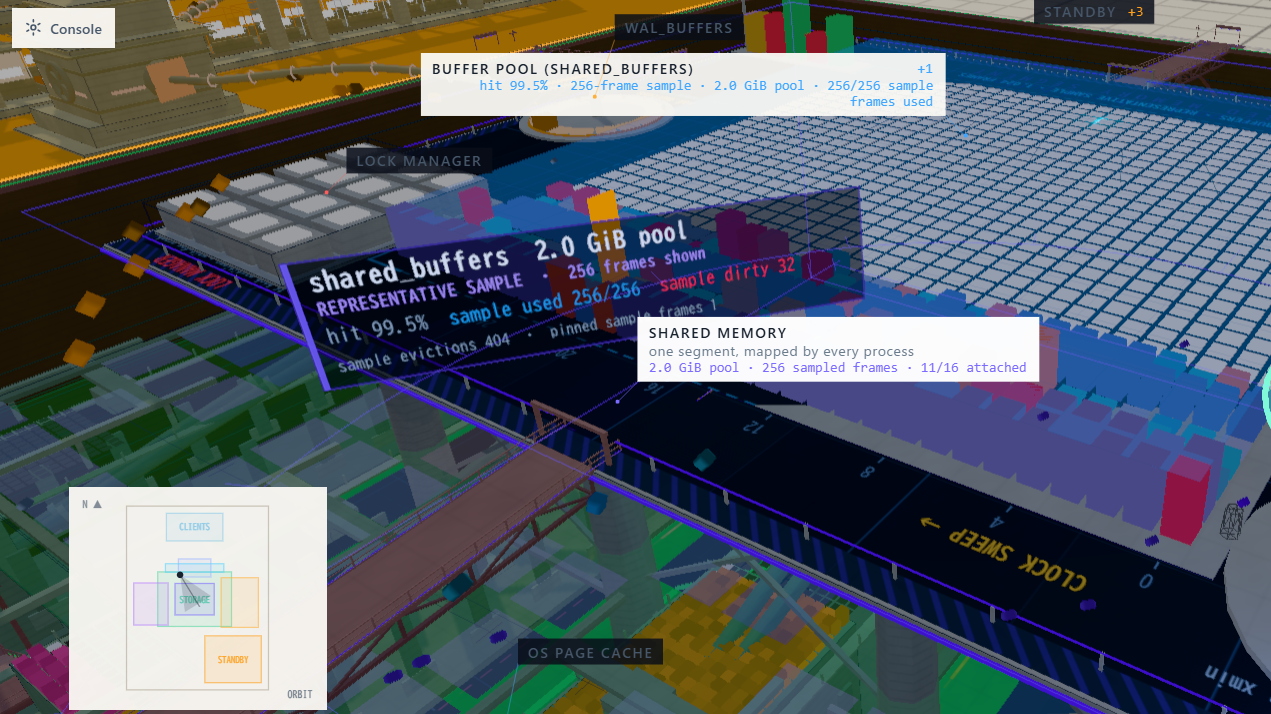
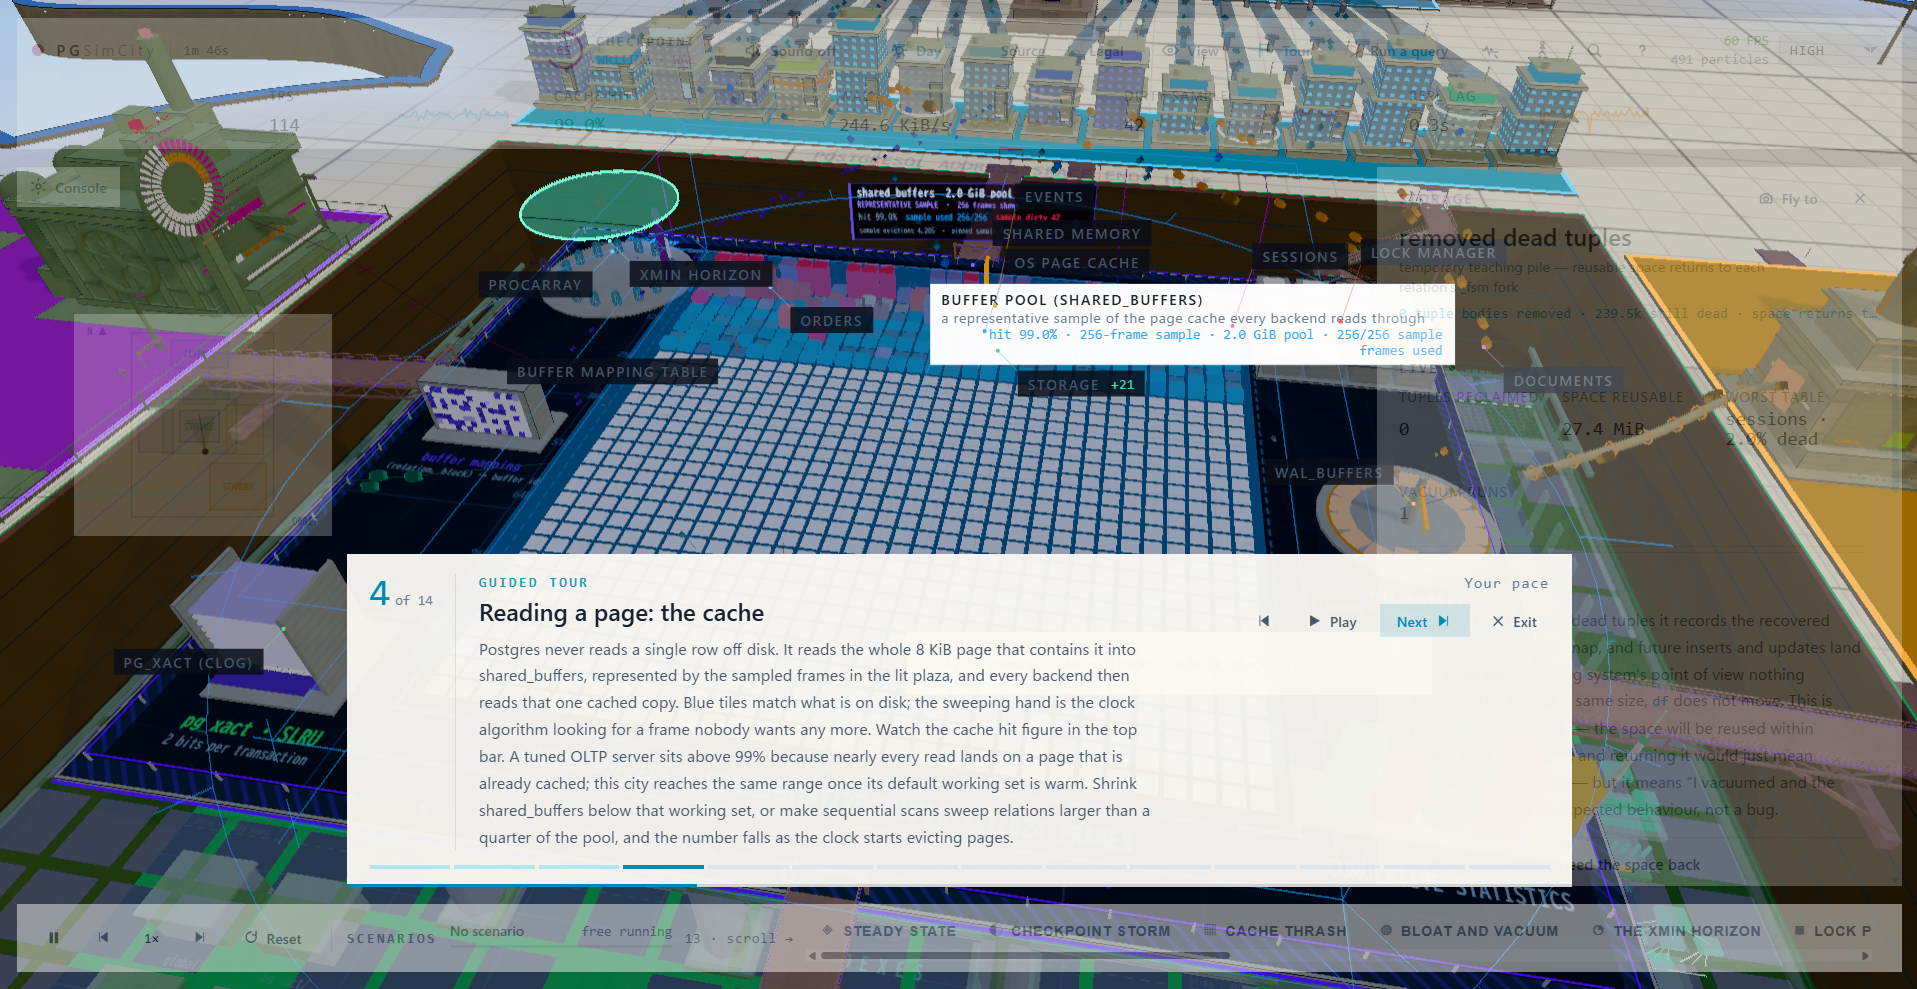
`shared_buffers` represents PostgreSQL's shared buffer cache. The white tiled area in the center is the buffer pool, where PostgreSQL reads data from disk in 8KiB pages rather than row by row. A higher CACHE HIT at the top means that the required pages are already in memory, avoiding disk access.
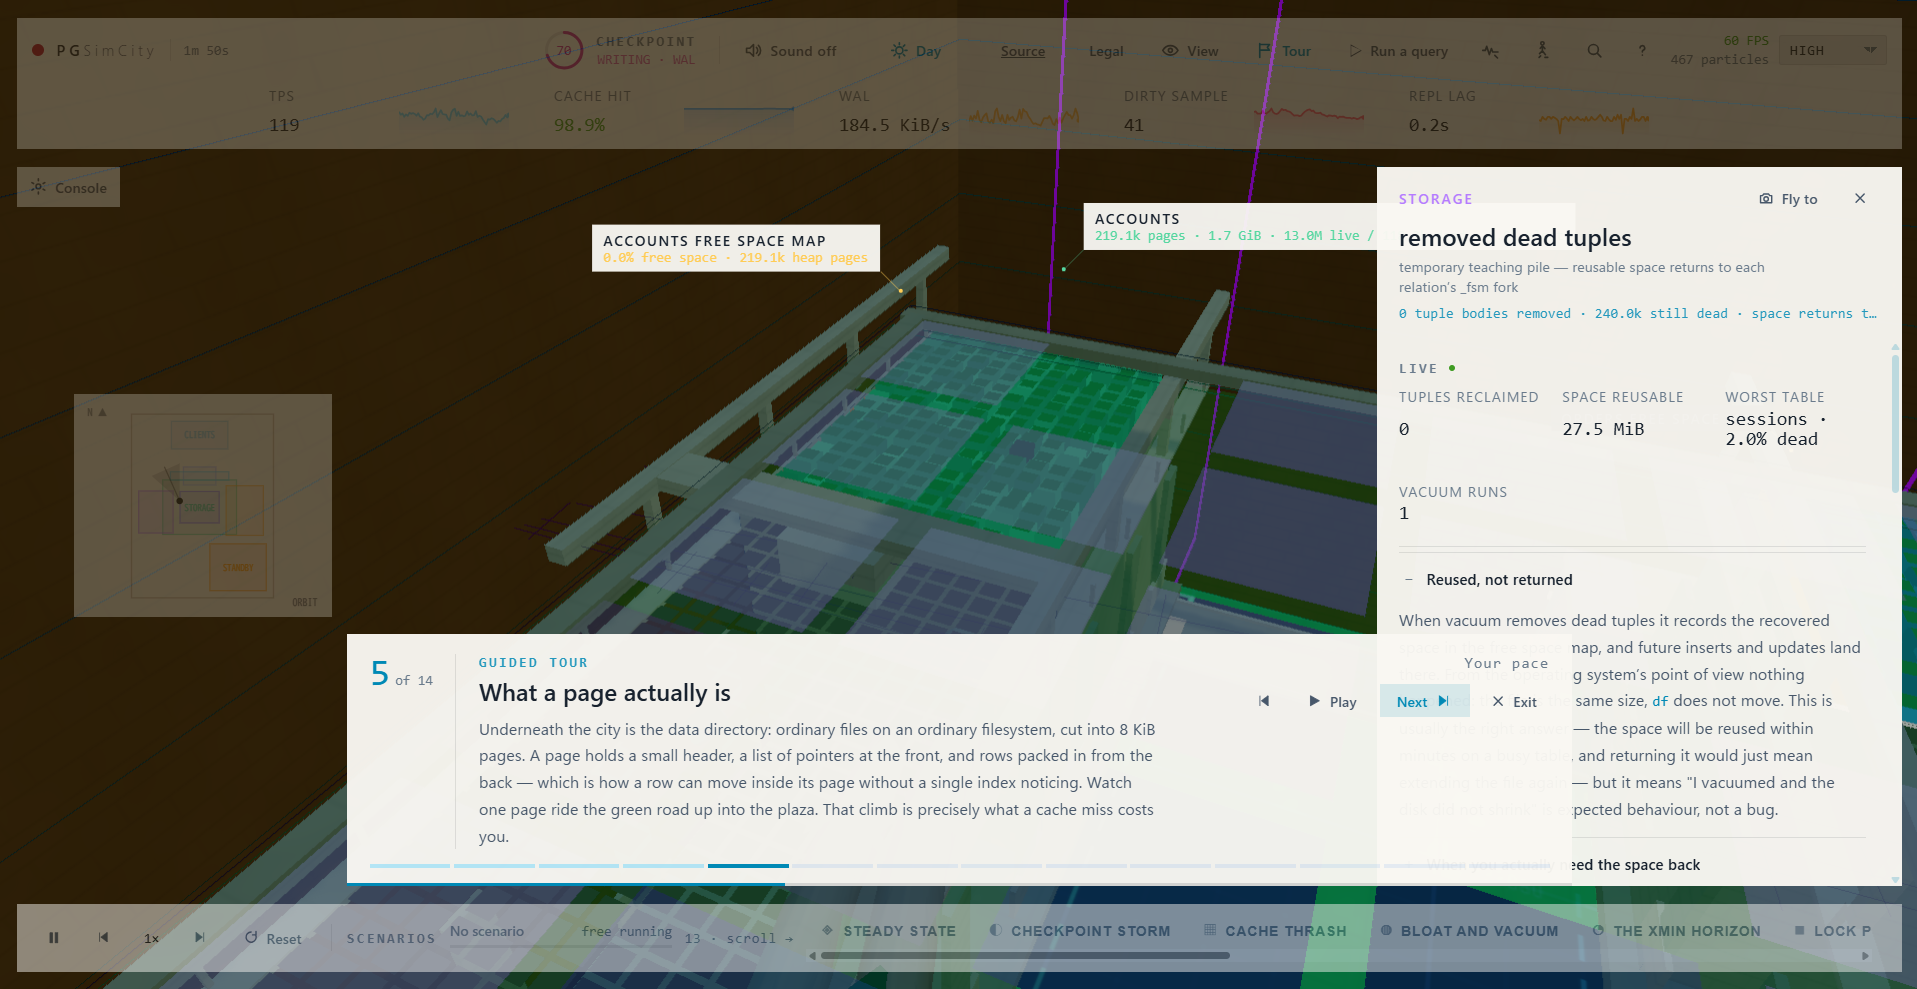
The contents of data pages on disk. The accounts table in the underground storage area is depicted as a collection of 8KiB pages, each containing row data and information for managing free space. The green path represents the flow of pages on disk being read into shared_buffers.
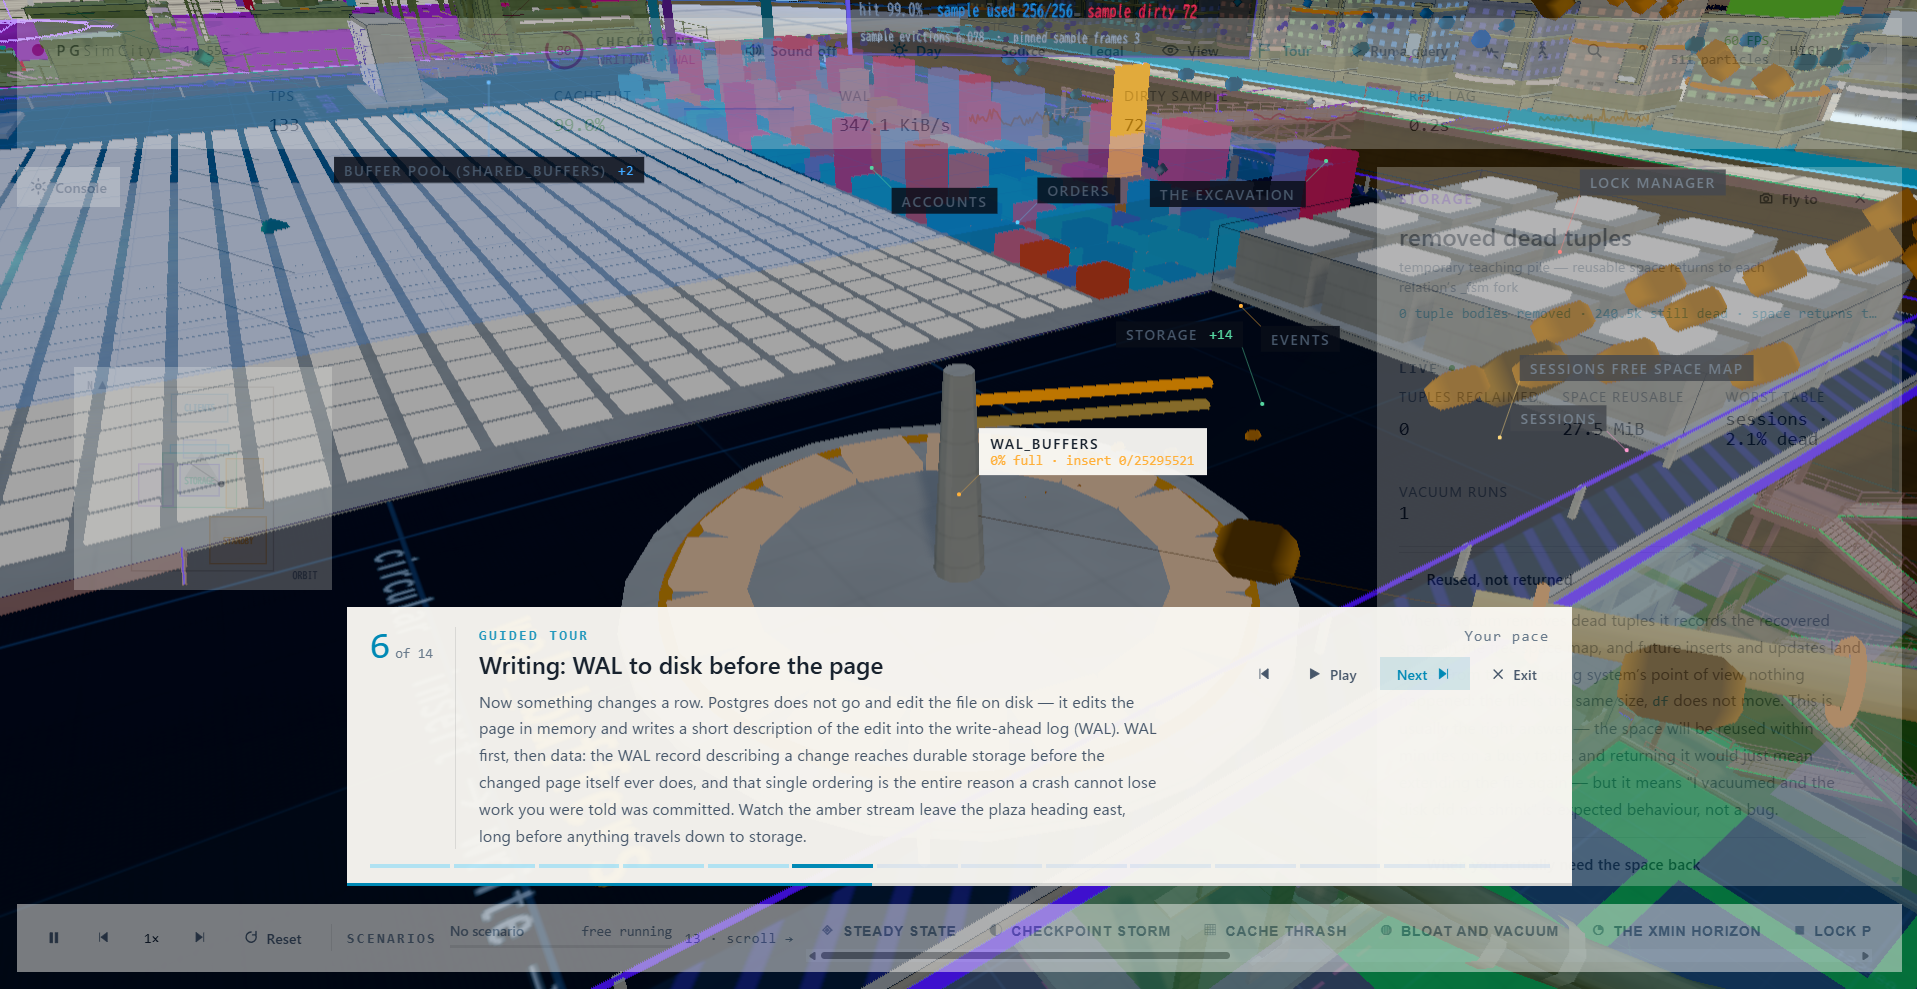
This mechanism writes changes to the WAL (Write-Ahead Log) before the data page. When you modify a row using an UPDATE statement, PostgreSQL first modifies the page in memory and records those changes in the WAL buffer. The circular area at the bottom center of the screen is the WAL buffer, and even if the page itself is written later, recovery is possible after a failure as long as the WAL remains.
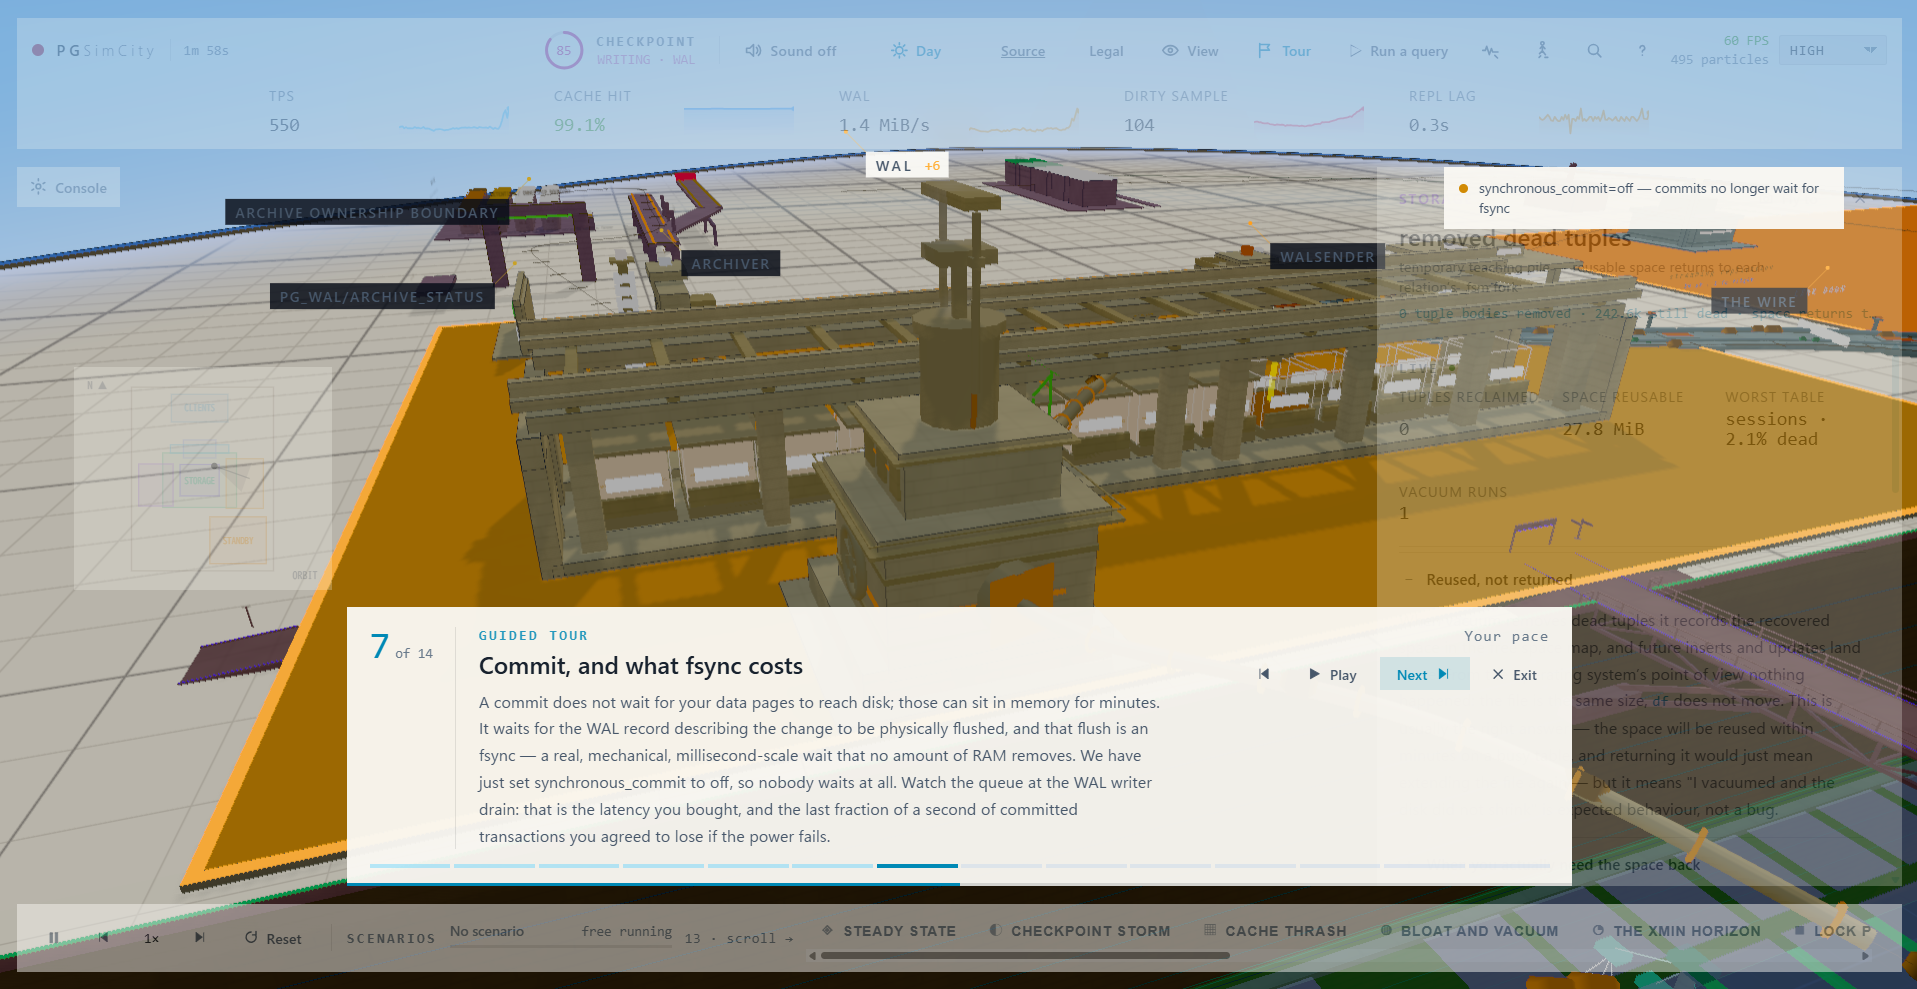
Transaction commits wait for the WAL records to be safely flushed, rather than waiting for the modified data pages themselves to be written to disk immediately. The upper right of the screen also shows the state with synchronous_commit turned off, illustrating the trade-off between reduced waiting time and the possibility of losing the most recent commit in the event of a failure.
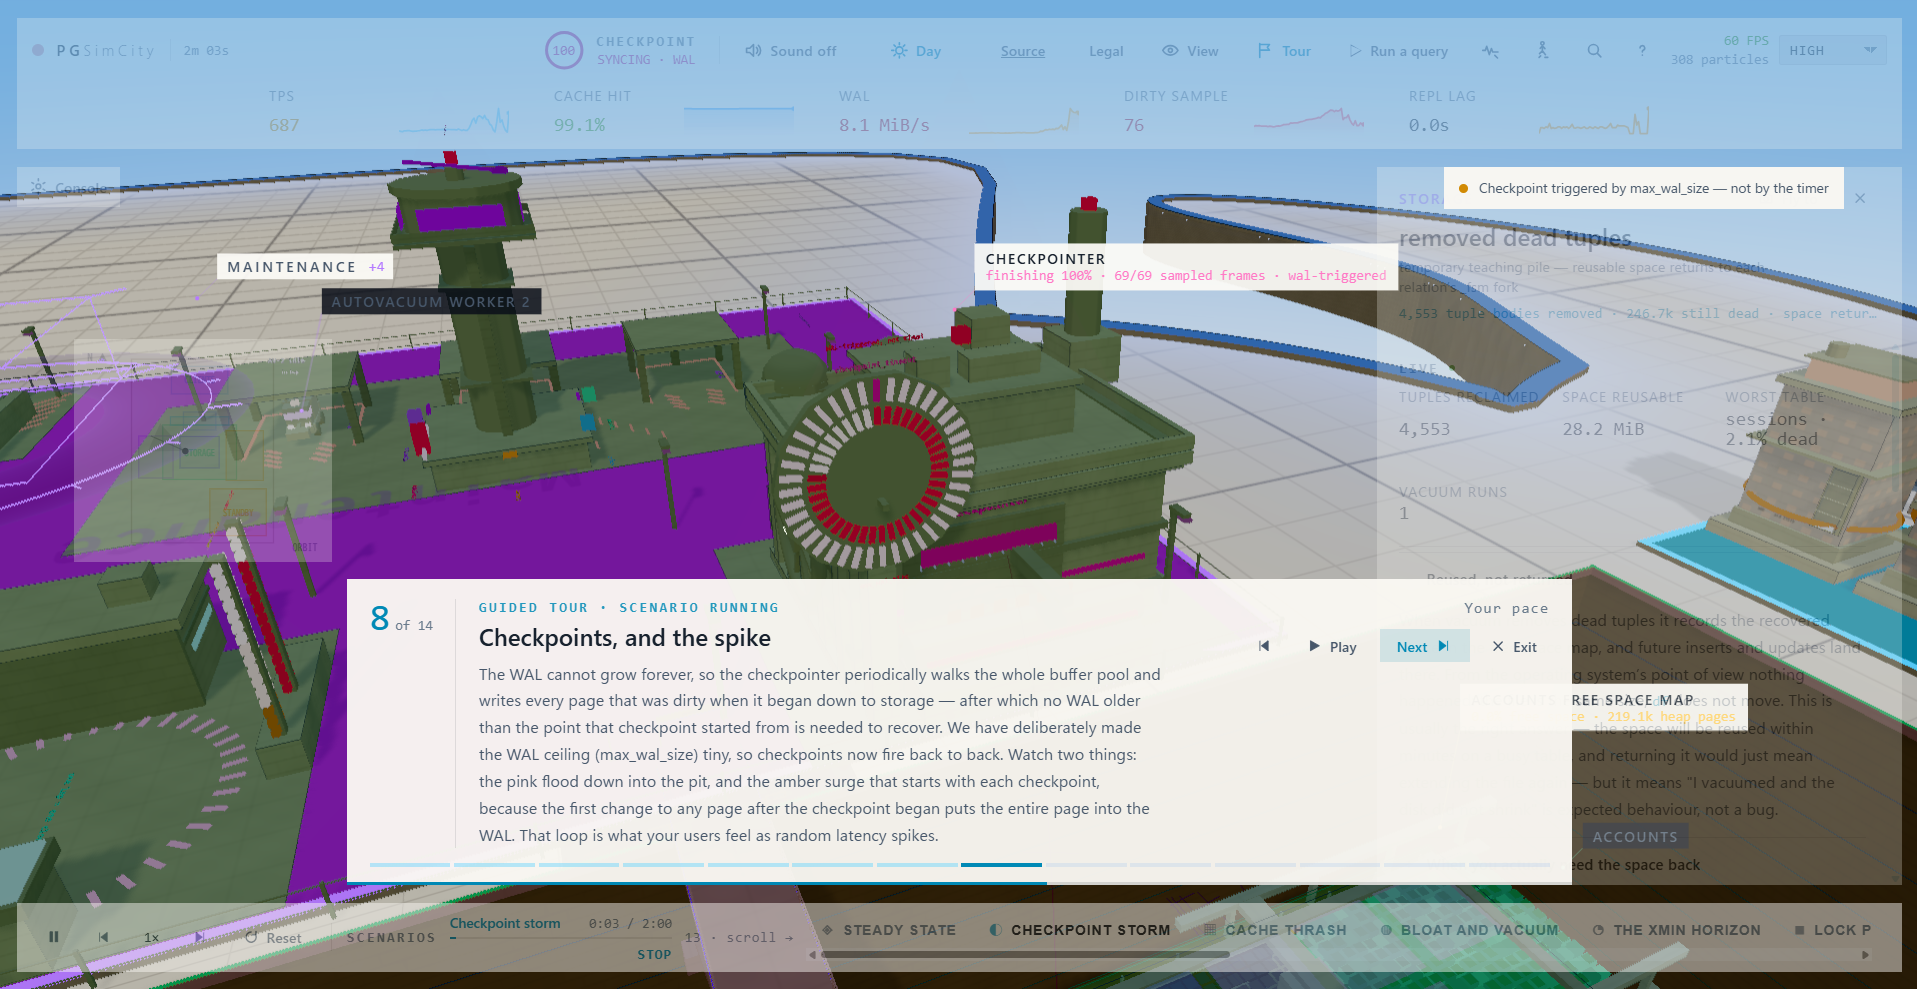
The image shows how write loads become concentrated due to checkpoints. The green facility on the left is the checkpointer, which writes dirty pages from shared_buffers to storage in batches. The top indicates that a checkpoint occurred due to max_wal_size, and when checkpoints occur frequently, writes to WAL and data pages become concentrated, resulting in latency spikes.
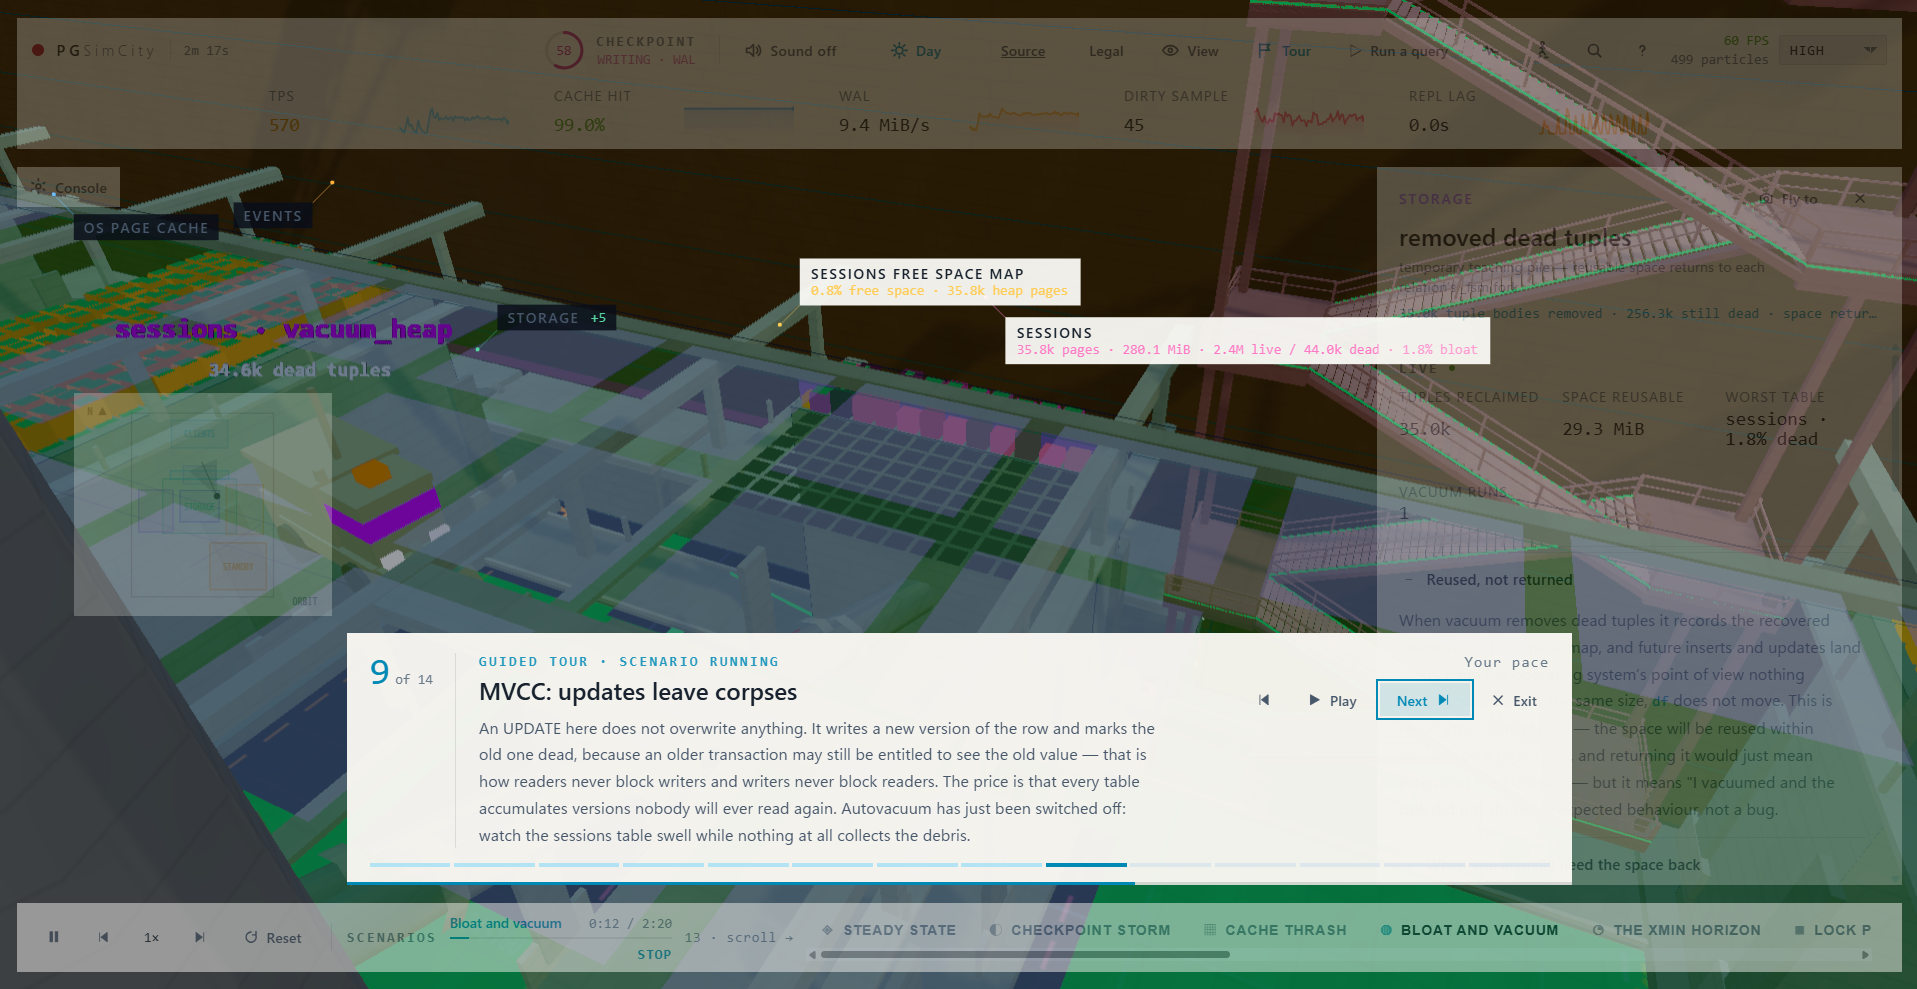
PostgreSQL's MVCC means that updated old rows don't disappear immediately. Instead of overwriting existing rows in place, UPDATE creates a new row version, leaving the old row as a dead tuple. In the image below, dead tuples accumulate in the sessions table, which, while less likely to block reads and writes, will require a vacuum cleanup later.
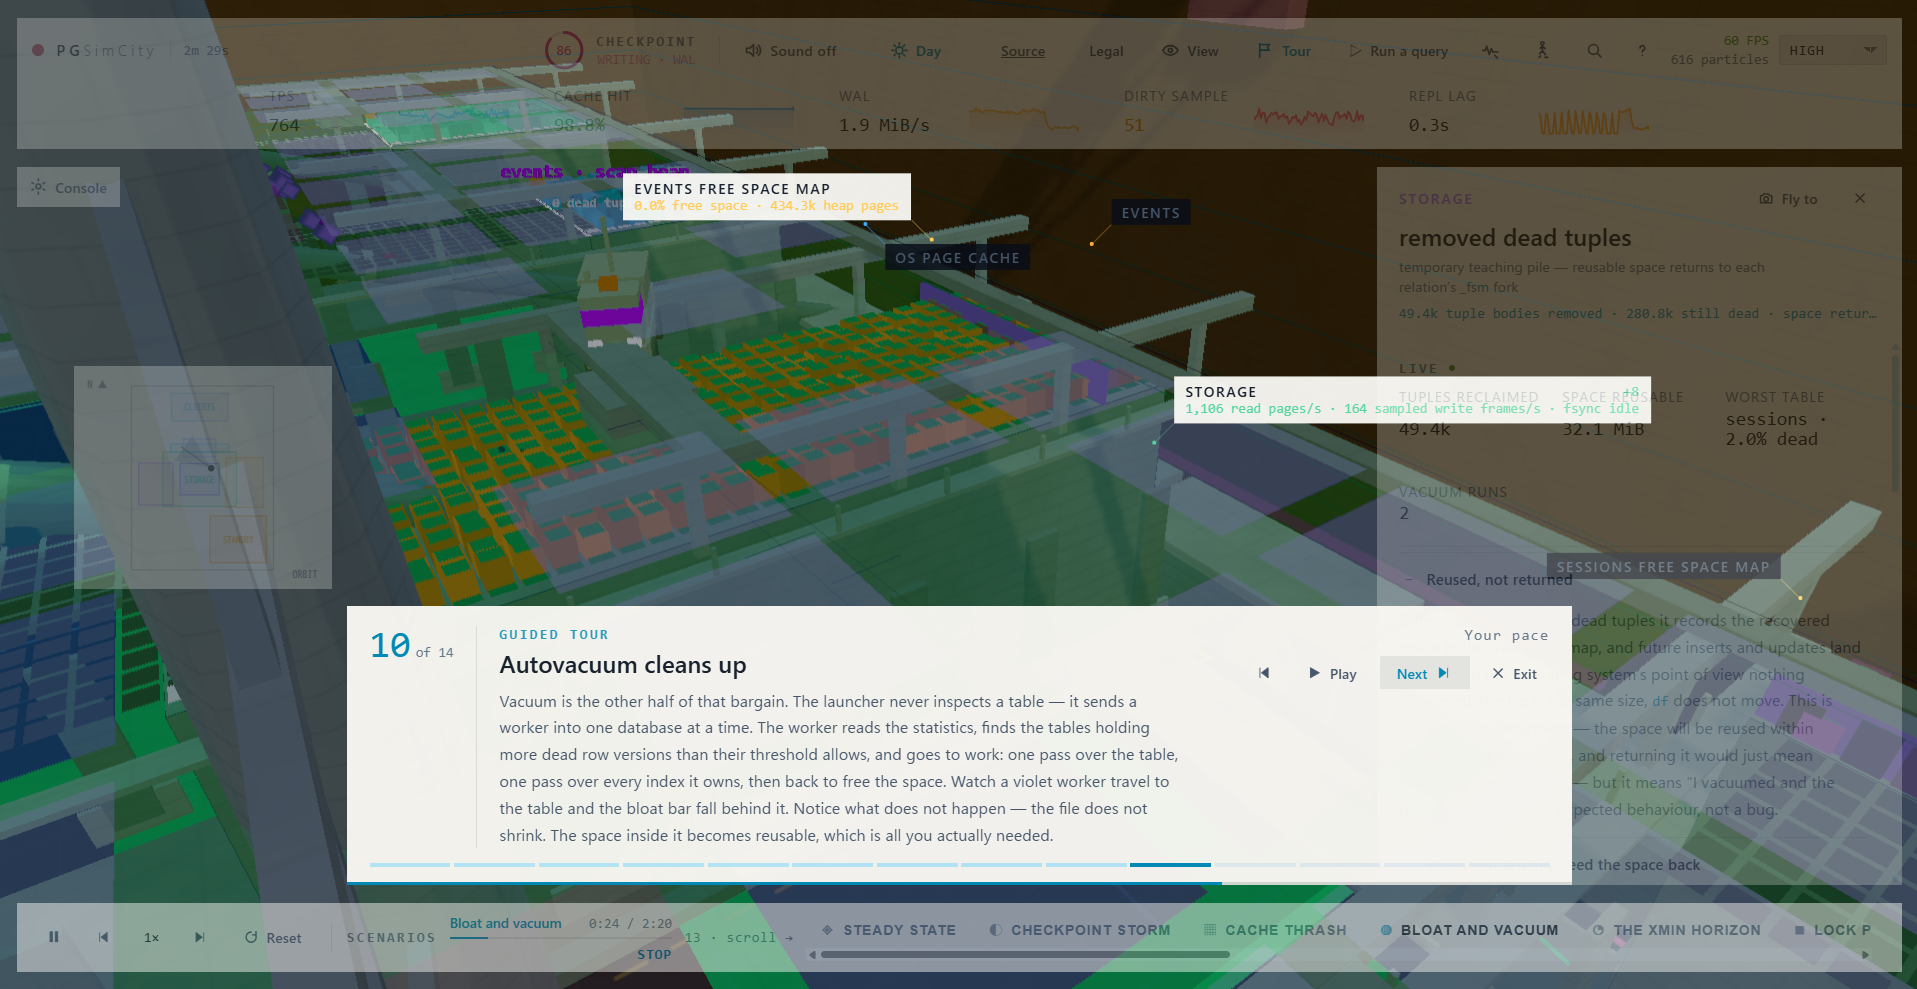
This shows how autovacuum collects dead tuples. The autovacuum worker looks at statistics, iterates through tables with increasing numbers of unnecessary row versions, and makes free space available by reading tables and indexes. However, it's important to note that vacuuming doesn't usually directly reduce file size; rather, it frees up space within tables so that it can be used for future INSERT and UPDATE operations.
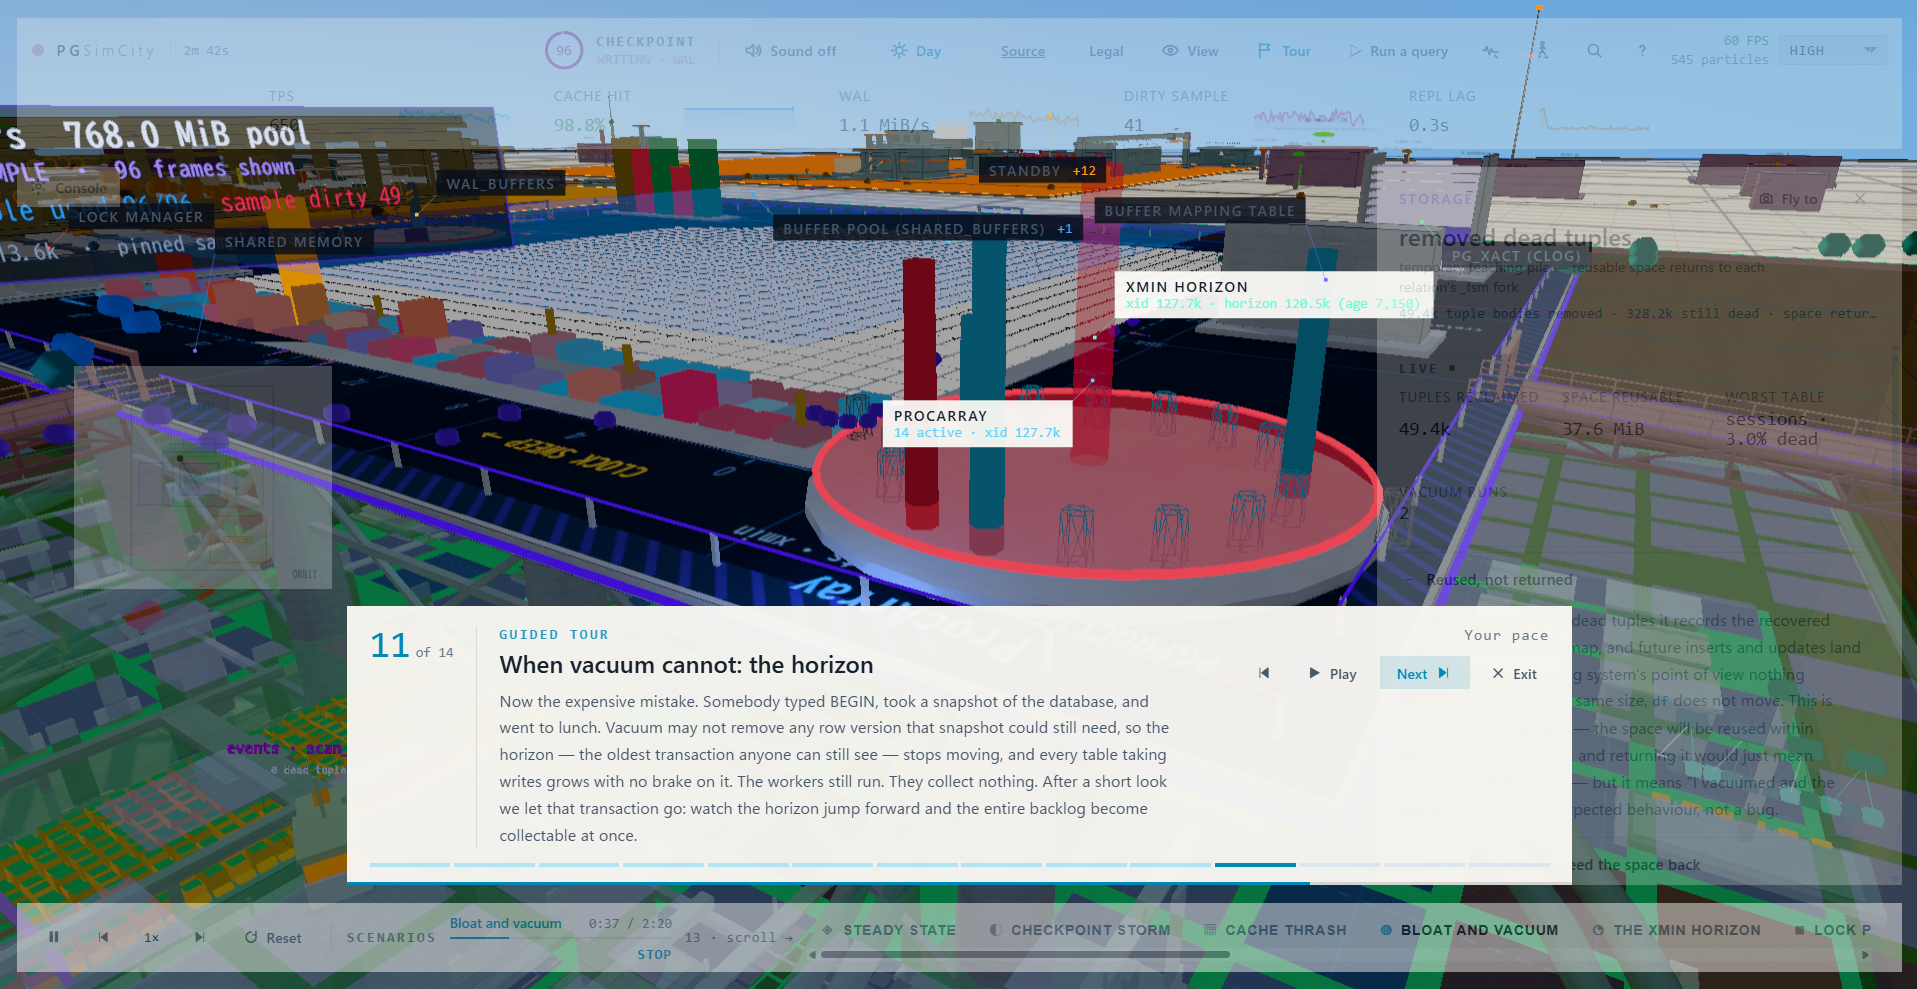
The 'XMIN HORIZON,' indicated by the red circle in the center, represents the boundary of row versions that older transactions may still be able to reference. If this boundary does not move, autovacuum cannot safely remove dead tuples, leading to the accumulation of unnecessary rows and table bloat.
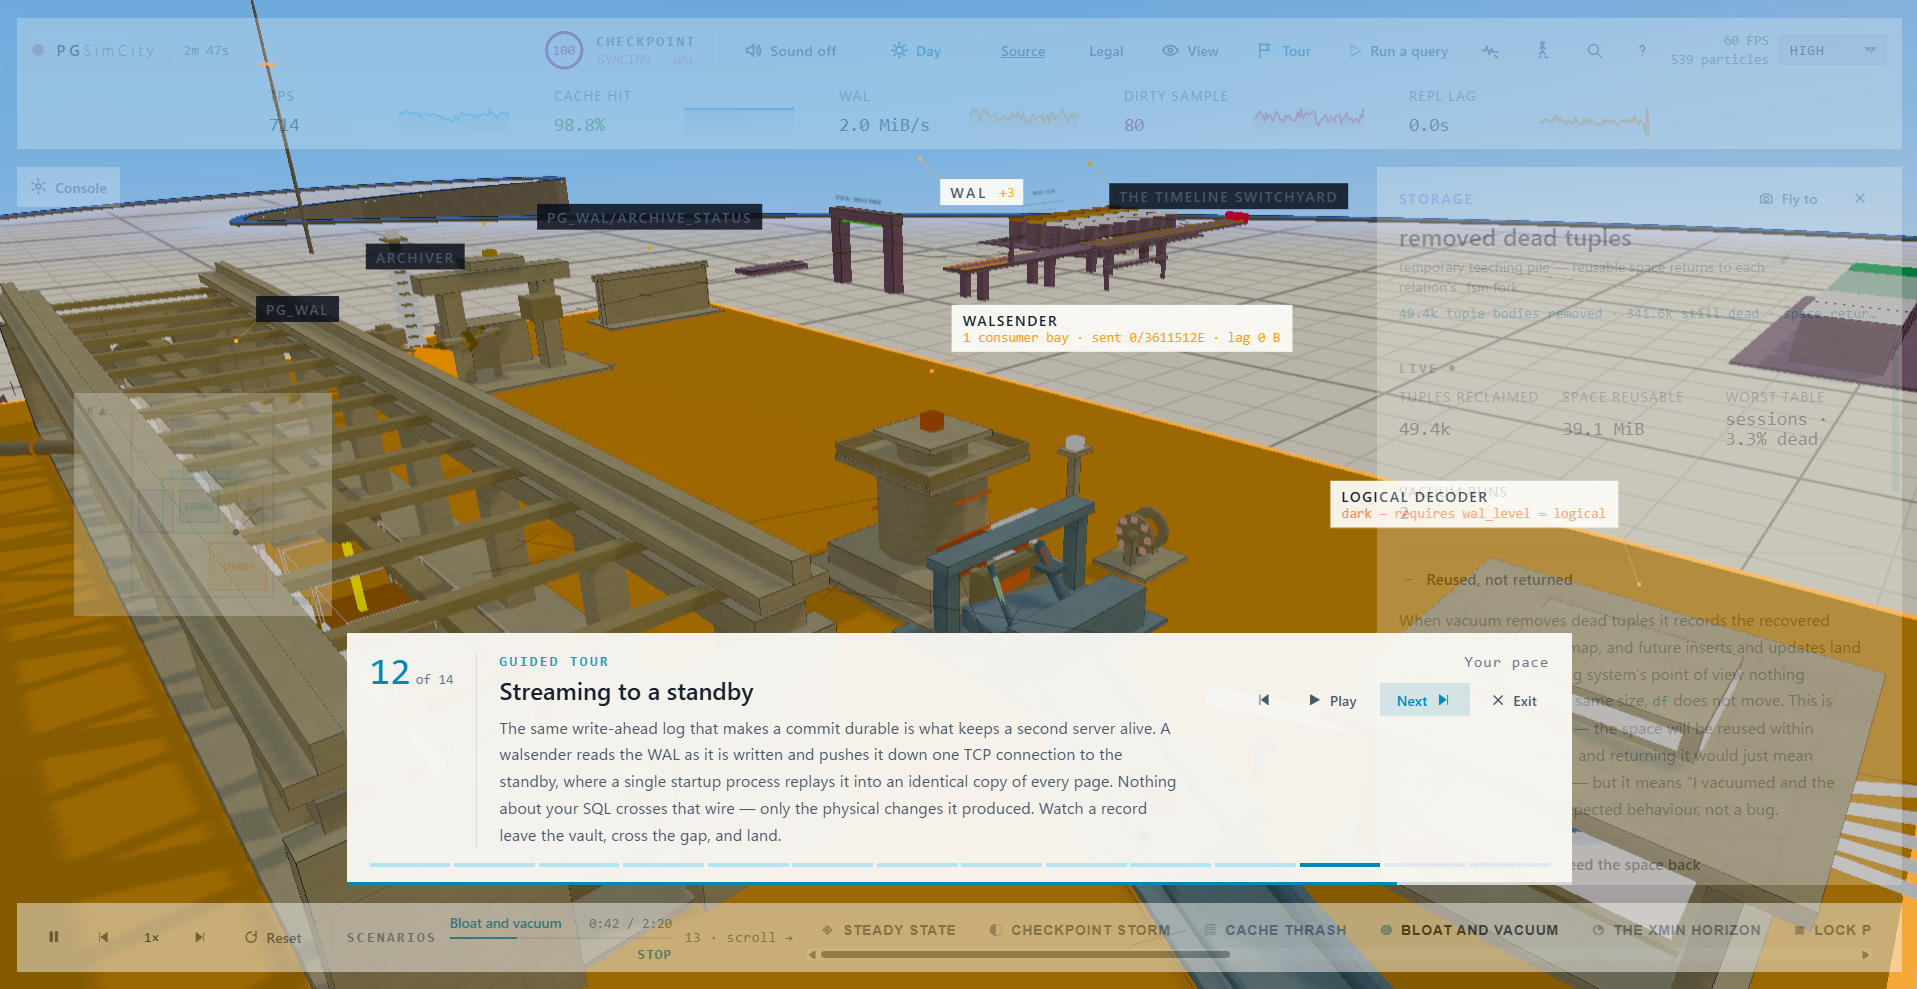
WAL generated on the primary side is sent from walsender to the standby, where the standby's walreceiver and startup process receive and replay it. What is sent here is not the SQL statement itself, but a record of the physical changes that have occurred on the data pages, and the standby applies this WAL sequentially to follow the primary.
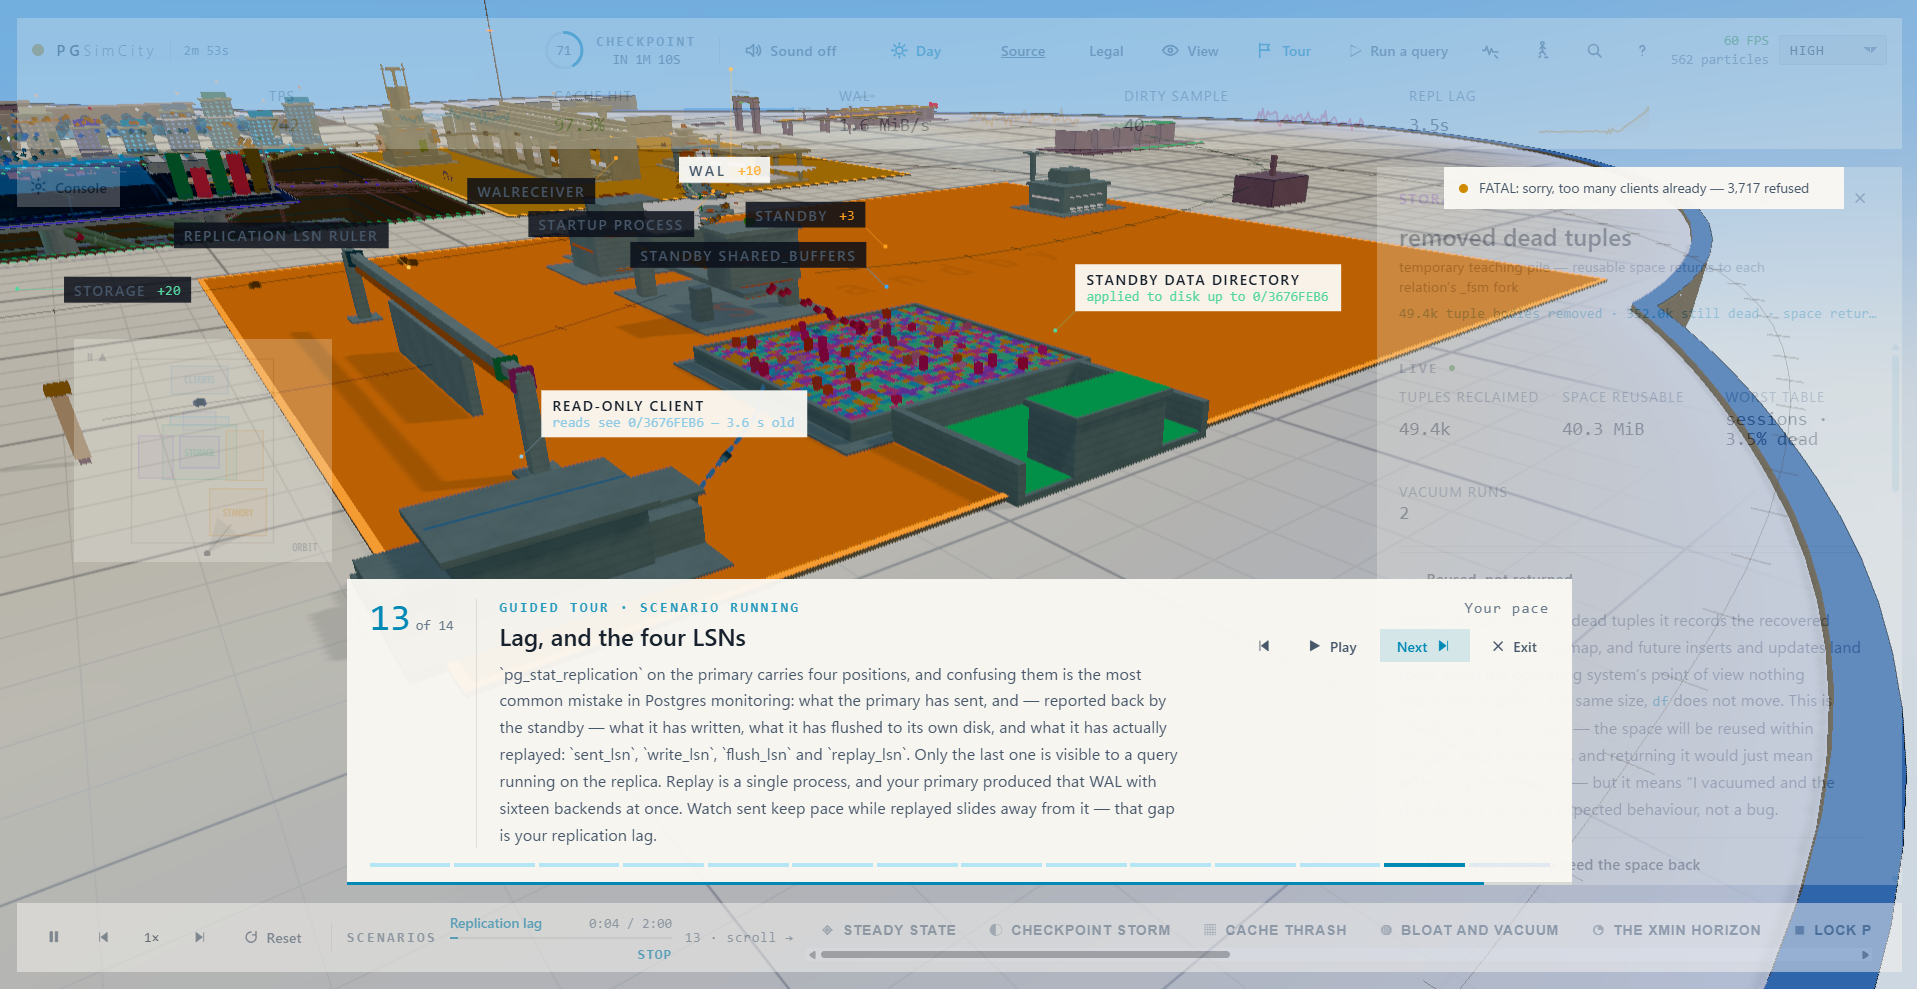
The screen displays the status corresponding to four LSNs: Sent, Written, Flashed, and Played. Even if the standby has received the WAL, it will not be reflected in the query results if it has not yet been played back. The difference between the position where the primary sent the data and the position where the standby actually applied it is shown as the REPL LAG at the top of the screen.
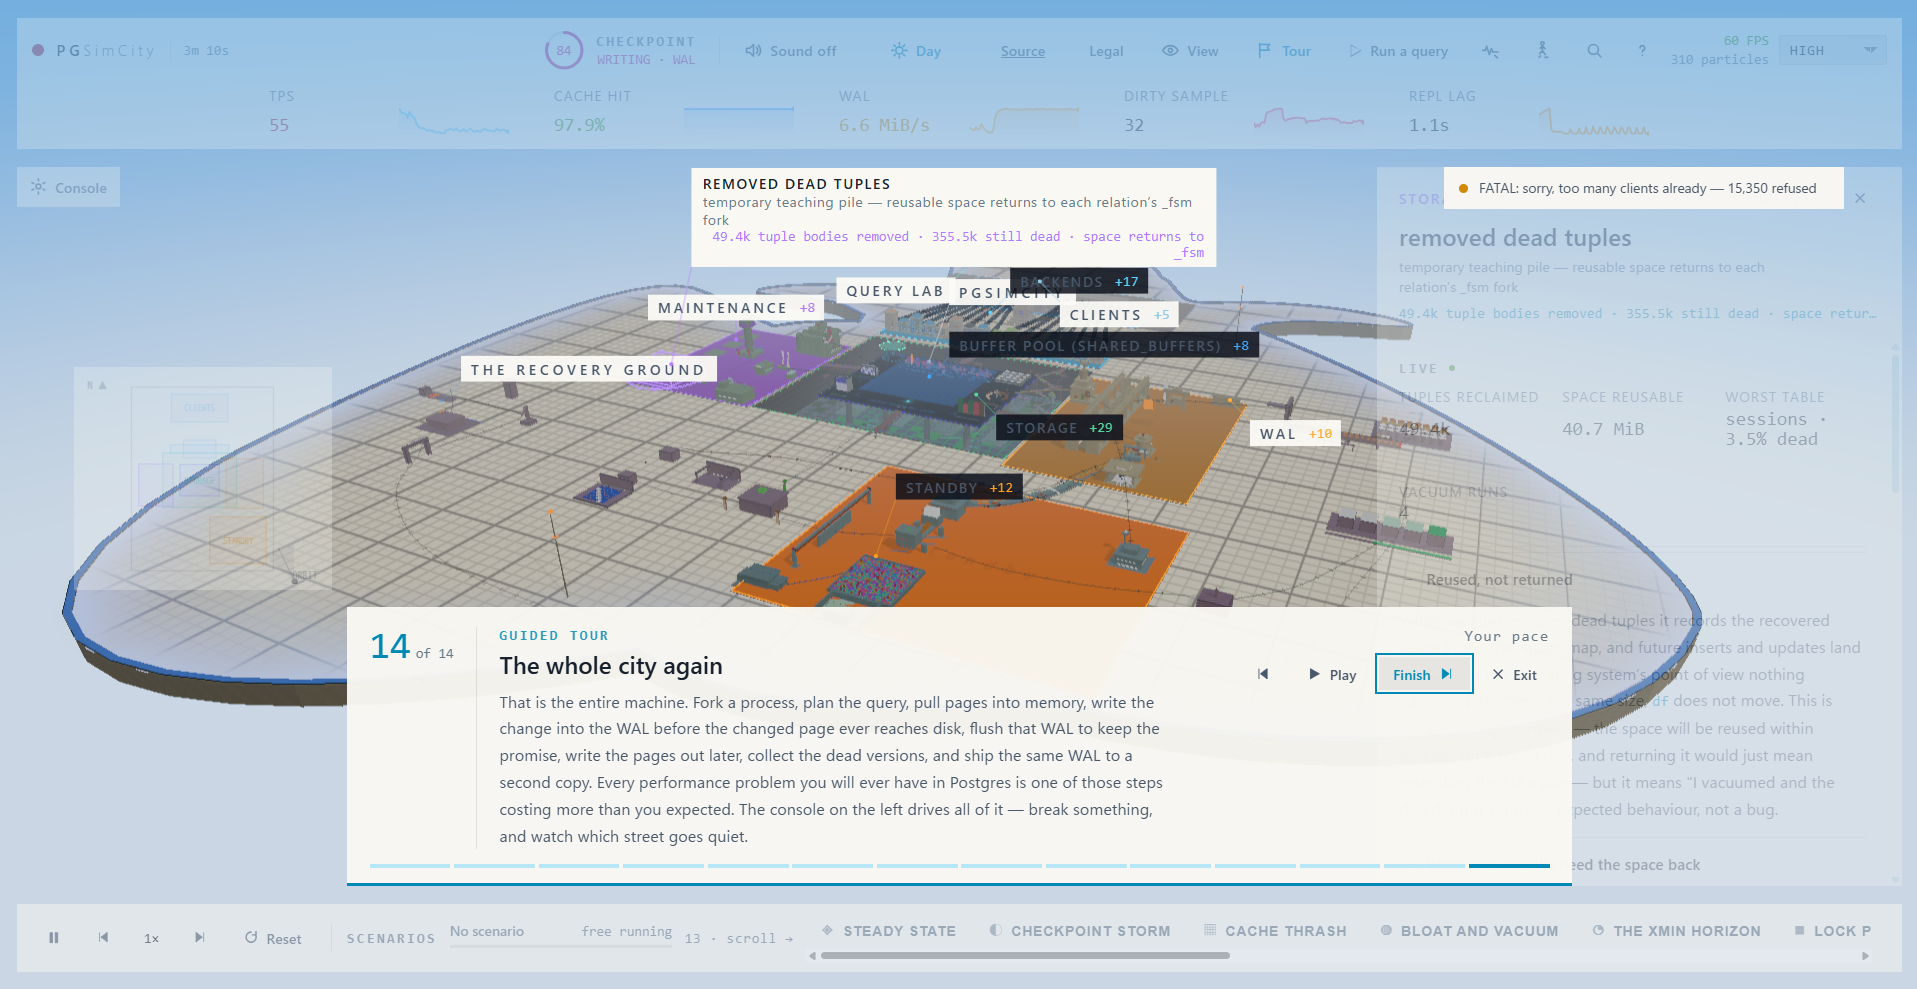
Finally, let's review the entire process within PostgreSQL as a whole. Client connections, Postmaster, backend, Query Lab, shared_buffers, WAL, storage, maintenance, and standby are all located in the same space, and we can see that the processes we've looked at so far are connected as a single flow. PostgreSQL performance problems surface when waits or bottlenecks occur somewhere in this process, such as in caching, WAL, checkpoints, vacuuming, or replication.
Related Posts:





in Software, Review, Web Application, Posted by log1i_yk