What are the problems with the American healthcare system, which has medical costs about three times higher than Japan's, yet a shorter average life expectancy?
While healthcare costs in the United States are higher than in Japan, average life expectancy is lower. The open-source project 'The American Healthcare Conundrum,' released on GitHub, examines publicly available data to identify what costs are incurred in the American healthcare system and where 'waste' occurs, and then compiles its findings.
The American Healthcare Conundrum
Health expenditure per capita: Health at a Glance 2025
https://www.oecd.org/en/publications/2025/11/health-at-a-glance-2025_a894f72e/full-report/health-expenditure-per-capita_affe6b0a.html
According to statistics from the Organization for Economic Cooperation and Development (OECD) , per capita healthcare expenditure in 2024 was approximately $14,885 (approximately 2.36 million yen) in the United States and approximately $5,790 (approximately 920,000 yen) in Japan. Meanwhile, average life expectancy in 2023 was 78.4 years in the United States and 84.1 years in Japan, with Japan having the second highest among OECD member countries.
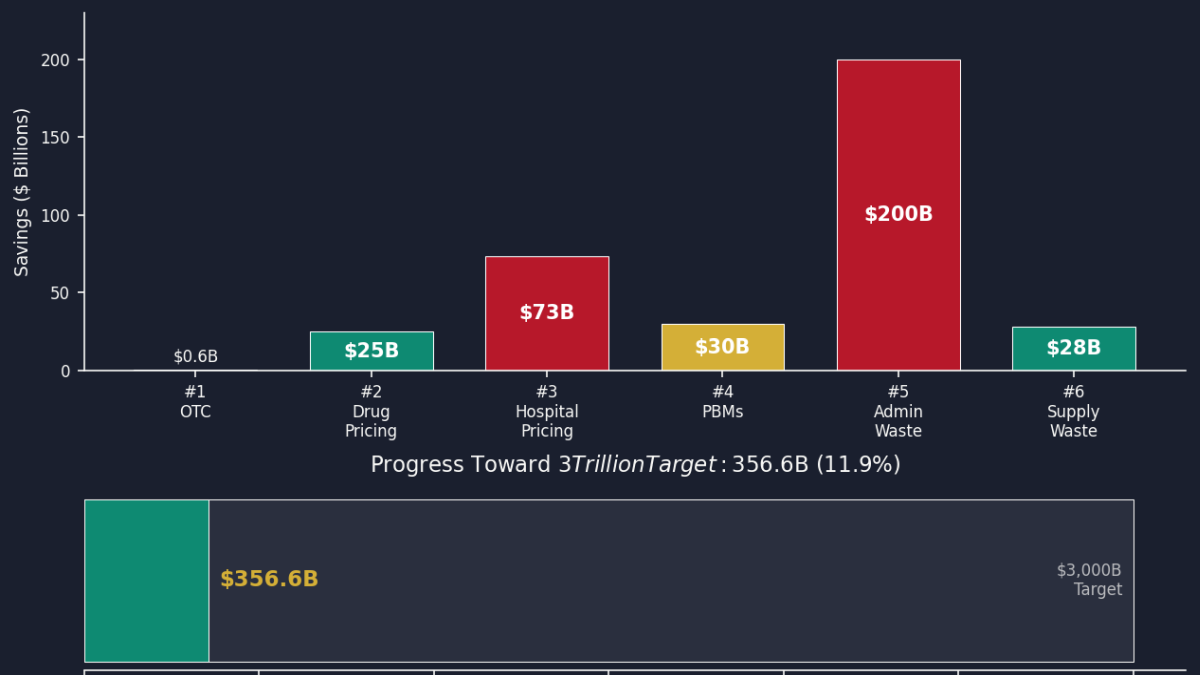
The project's first point regarding what costs are incurred in the American healthcare system is that 'even over-the-counter (OTC) drugs that can be bought directly from pharmacies without a prescription are sometimes covered by Medicare, America's public health insurance, through the prescription drug system.' An analysis using 2023 Medicare prescription drug benefit data revealed that spending on drugs with OTC versions amounted to approximately $2 billion (approximately 316.8 billion yen), with approximately 83 million claims and benefiting approximately 28 million recipients.
The project points out that there are cases where over-the-counter (OTC) versions of medications, such as stomach medicines, are available at pharmacies at lower prices, yet higher costs are incurred through the prescription drug system. It suggests that reviewing these spending could potentially save approximately $600 million (about 95 billion yen) annually.
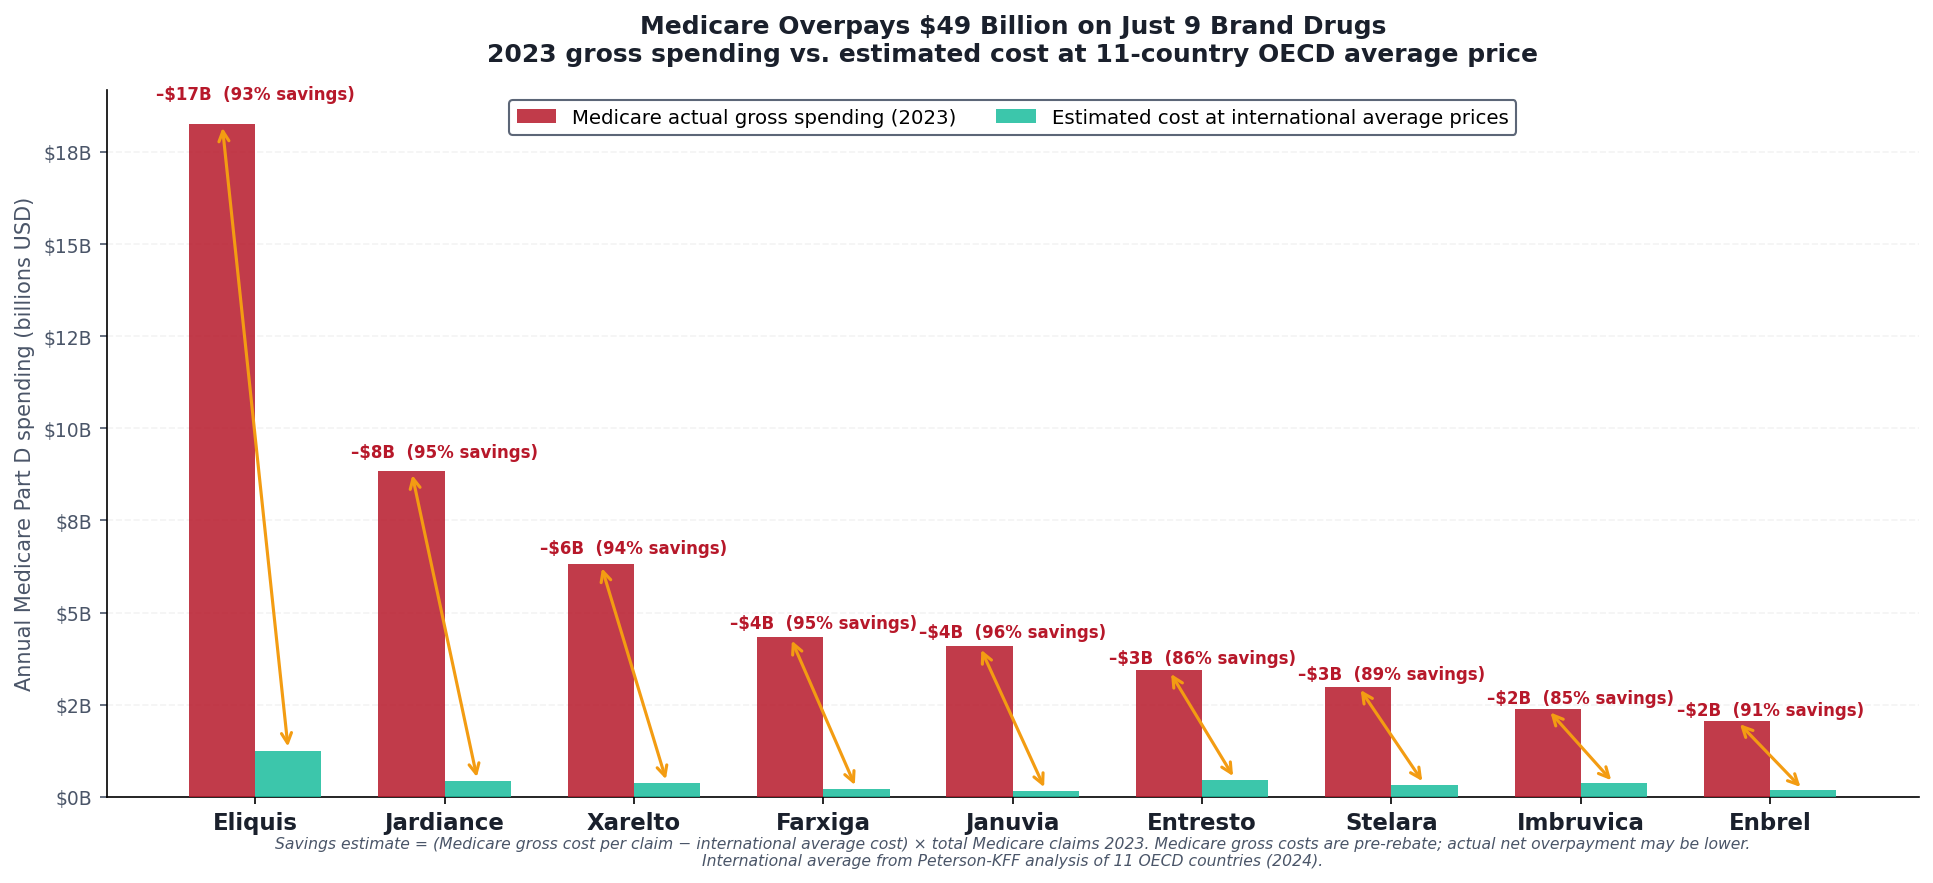
The project also points out that 'the same drug can be priced considerably higher in the United States than in other developed countries.' An analysis using data on Medicare prescription drugs in the United States, pricing data used in the UK's public healthcare system 'NHS,' and healthcare cost comparison data from the American think tank ' RAND ' found that Medicare spending on the nine high-priced drugs targeted in the study reached approximately $52.7 billion (approximately 8.347 trillion yen) in 2023.
For example, the blood thinner Eliquis (apixaban) costs $862 (approximately 136,500 yen) for a 30-day supply under Medicare, but only about $22 (approximately 3,490 yen) in Japan and about $1.48 (approximately 235 yen) in the UK. The project estimates that narrowing these price differences, which can be as high as 581 times, could save approximately $25 billion (approximately 3.9597 trillion yen) annually.
The following graph compares the amount Medicare spent on nine major brand-name drugs in 2023 with the estimated amount calculated using international average prices. The red bars represent prices in the United States, and the green bars represent average prices in other developed countries.
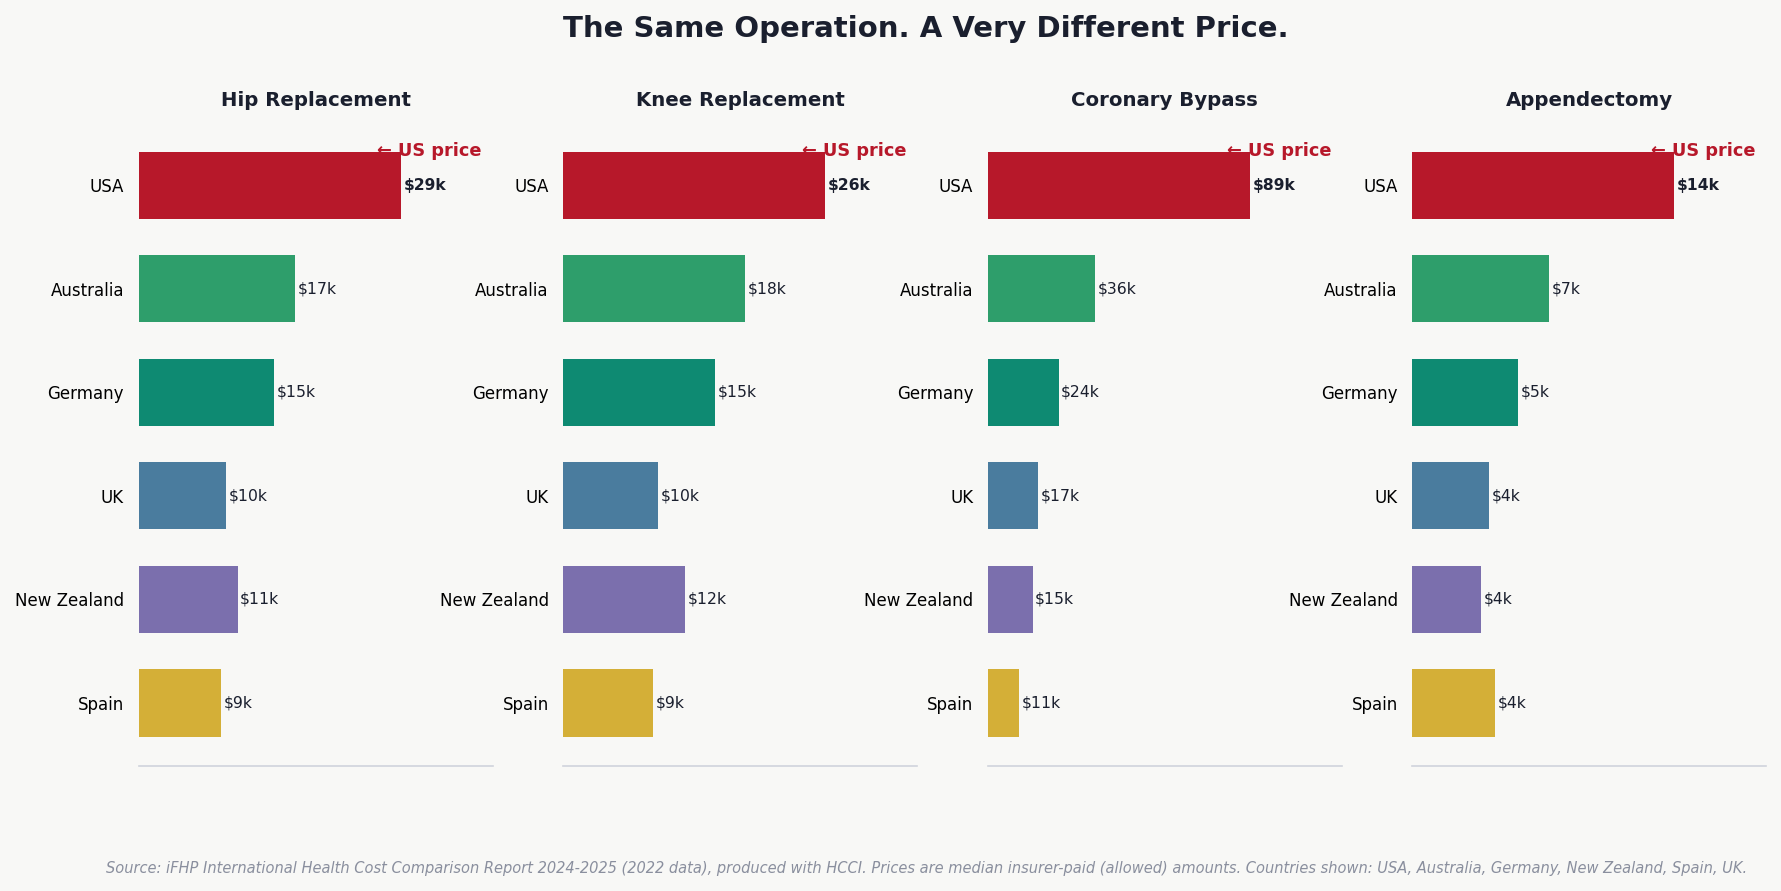
Furthermore, the project points out that 'for the same procedures performed in hospitals, private insurance pays significantly more than Medicare.' An analysis using US hospital cost reporting data and RAND's healthcare cost comparison data found that private insurance pays 2.54 times more for the same procedures than Medicare pays.
For example, the cost of artificial hip replacement surgery is approximately $29,006 (about 4.6 million yen) in the United States, but $14,986 (about 2.37 million yen) in Germany, $9,641 (about 1.53 million yen) in the UK, and $9,105 (about 1.44 million yen) in Spain. Coronary artery bypass surgery also costs $89,094 (about 14.11 million yen) in the United States, significantly higher than the $24,044 (about 3.81 million yen) in Germany and $16,936 (about 2.68 million yen) in the UK. The project estimates that if these levels could be reduced to about twice the Medicare rate, there is room to save approximately $73 billion (about 11.5623 trillion yen) per year.
The following graph compares the prices of total hip replacement, knee replacement, coronary artery bypass surgery, and appendectomy by country. It shows that the cost of surgery in the United States (red) is higher than in other countries.
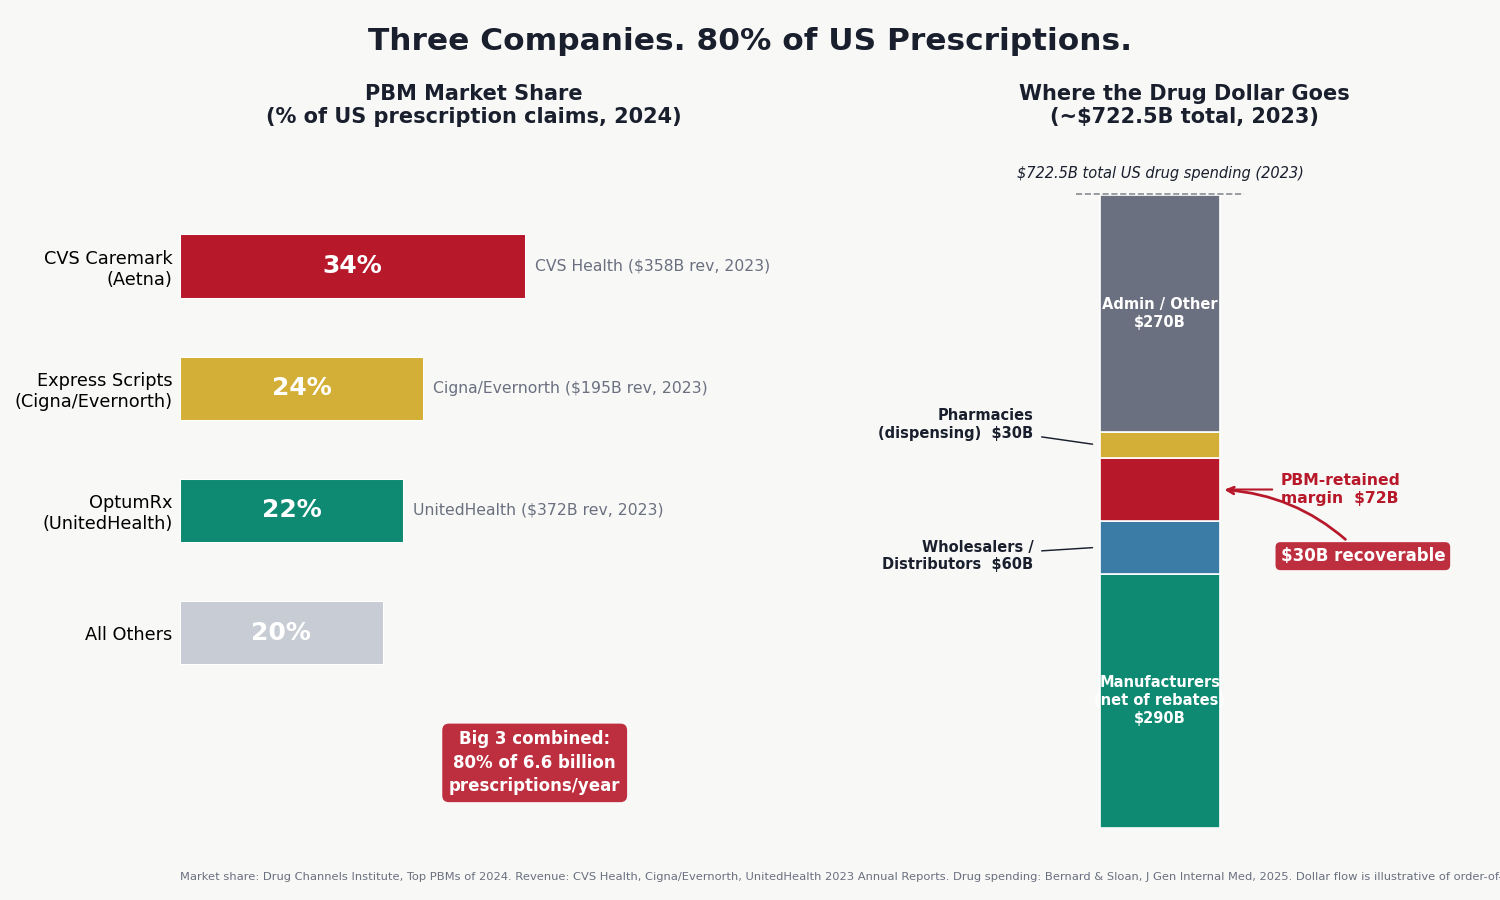
Another major point of contention is that 'Pharmacy Benefit Management Companies (PBMs) are inflating intermediary costs behind the scenes of drug pricing.' PBMs are companies that manage drug payments, acting as intermediaries between insurance companies, pharmaceutical companies, and pharmacies. According to the project, in the United States, three companies—CVS Caremark, Express Scripts, and OptumRx—handle 80% of the 6.6 billion prescription drugs issued annually. These PBMs are said to be profiting from '
The following graph summarizes the market share of PBMs (Pharmacy-Based Medicines) and where the money spent on prescription drugs goes. It shows that three companies handle the majority of prescription drugs and that PBMs receive large margins.
The fact that 'a lot of manpower and huge costs are spent on procedures other than medical treatment' is highlighted as a particularly large expenditure. An analysis using US hospital cost reporting data, overall healthcare spending statistics, and data from the OECD and the American Medical Association (AMA) shows that the US spends $4,983 (approximately 790,000 yen) per person on medical administration such as billing, dealing with insurance companies and pre-approval, which is significantly higher than the $884 (approximately 140,000 yen) in comparable countries.
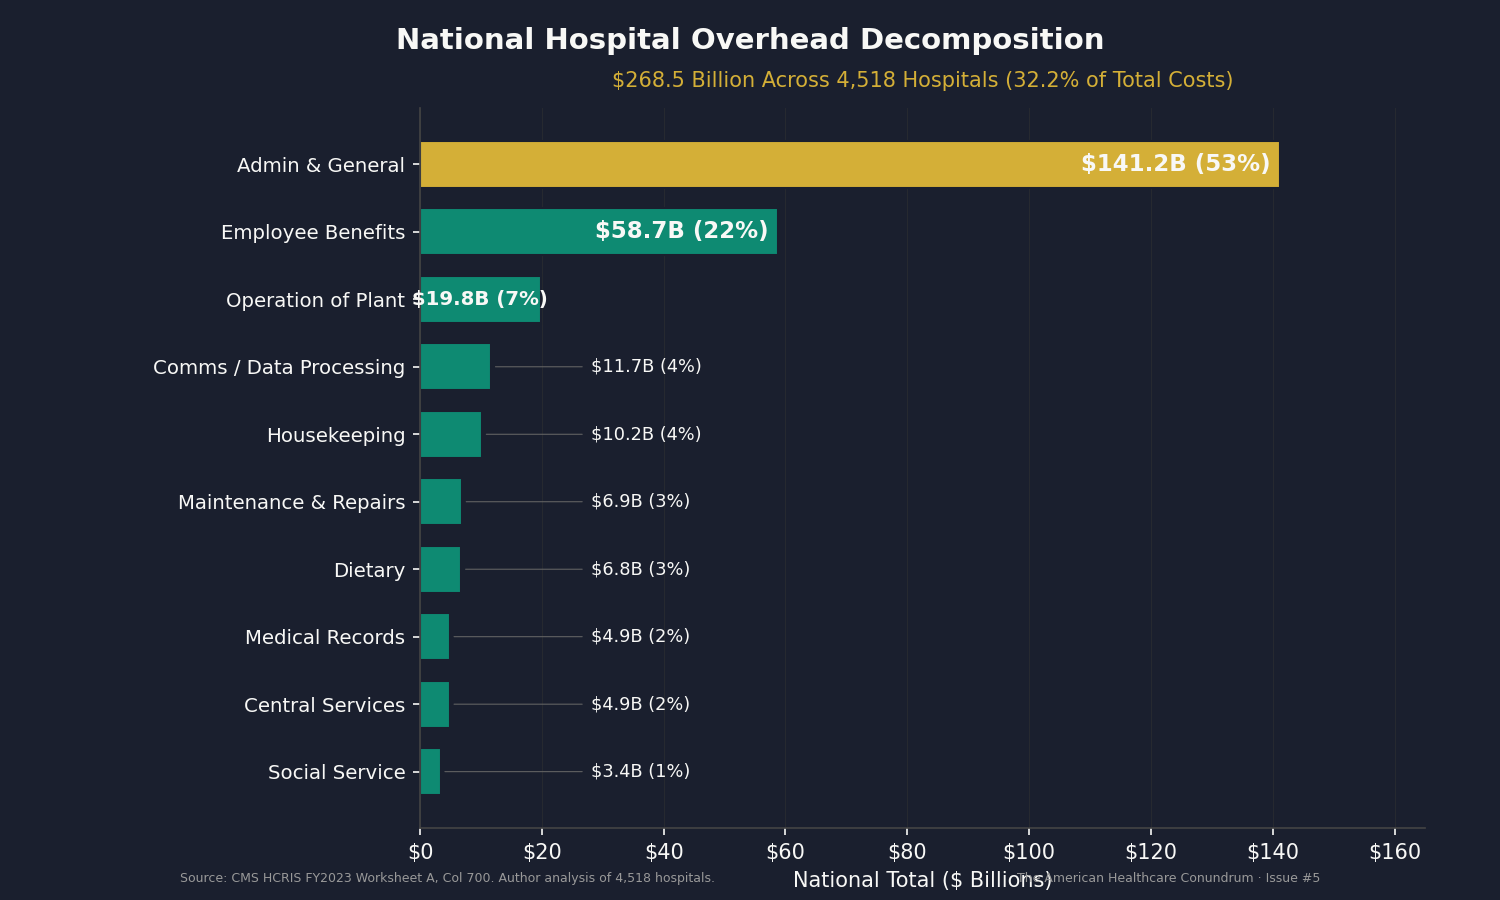
Furthermore, an analysis of 4,518 hospitals using 2023 hospital cost reporting data revealed that administrative department costs alone amounted to $141.2 billion (approximately 22.3644 trillion yen), and total administrative and operational costs, including employee benefits and data processing, totaled $268.5 billion (approximately 42.5232 trillion yen), accounting for 32.2% of total hospital costs. The project estimates that it could save approximately $200 billion (approximately 31.6776 trillion yen) annually by standardizing billing procedures and automating pre-approval processes.
The following graph shows a breakdown of administrative and management costs incurred in American hospitals. Administrative department expenses account for 53% of the total, followed by employee benefits at 22%.
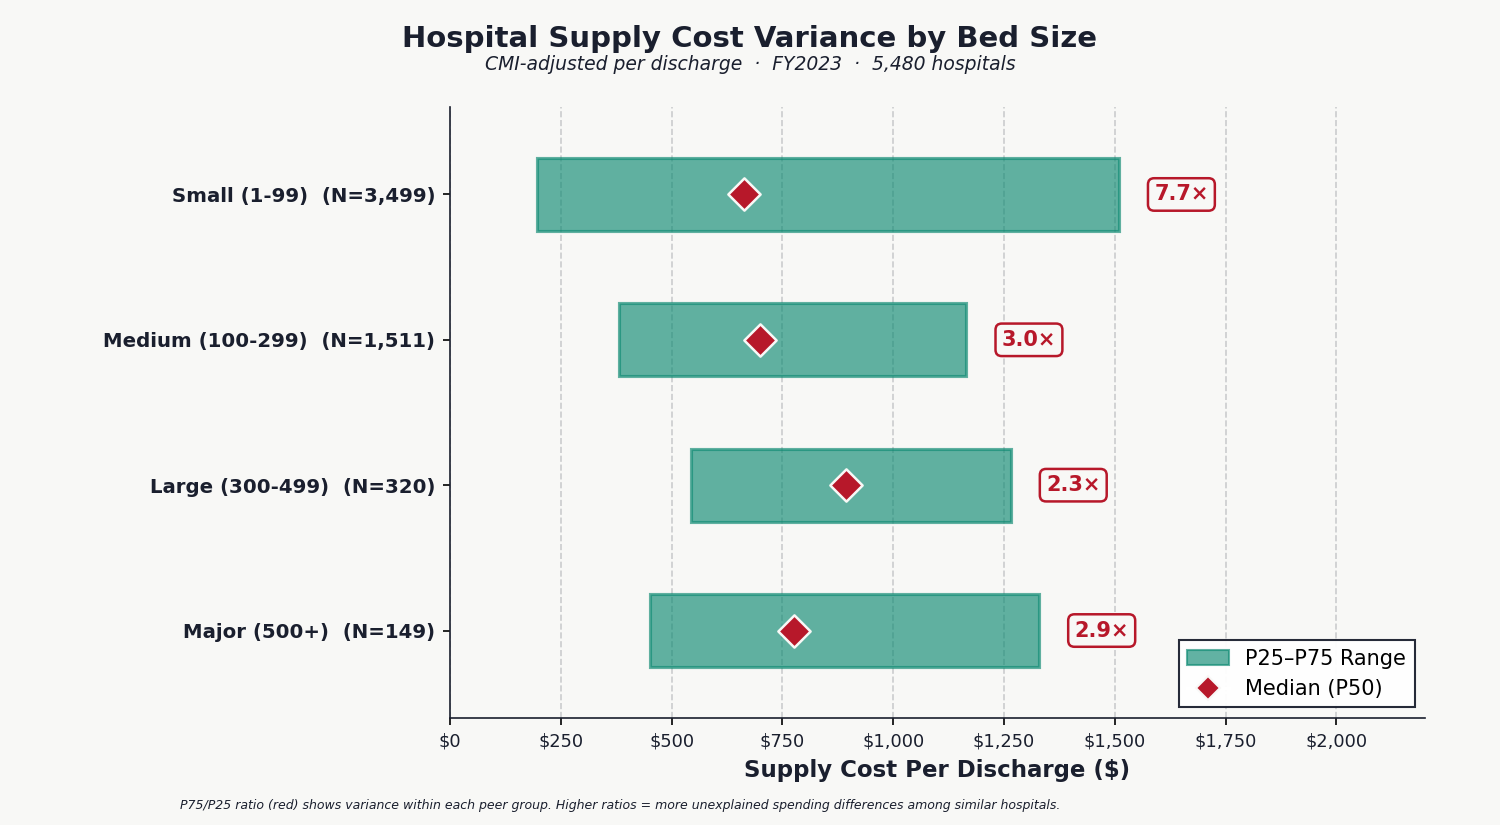
Furthermore, the project also highlights the significant differences in the cost of items used in hospitals. Using 2023 US hospital cost reporting data, an analysis of 142.3 million discharge cases from 5,480 hospitals revealed that combined expenditures on medical supplies, implantable devices, and medications directly billed to patients reached $170.9 billion (approximately 27.0645 trillion yen), with a national average of $1,941 (approximately 310,000 yen) per discharge.
However, it was found that costs tend to be higher in hospitals with a large number of patients with severe symptoms, and even when comparing hospitals of the same size, there were significant differences. For example, in medium-sized hospitals, the cost of supplies per discharge varied from $382 (approximately 60,000 yen) to $1,165 (approximately 184,000 yen), a difference of more than three times. Furthermore, in small hospitals with fewer than 100 beds, this difference widened to 7.7 times. The project estimates that if these high-cost hospitals can reduce their costs to a level that places them in the top quarter of hospitals of the same size, there is room to save approximately $28 billion (approximately 4.4349 trillion yen) per year.
The following graph shows the variation in the cost of supplies used in hospitals, broken down by hospital bed size. It demonstrates that even among hospitals of similar size, from small to large, there are significant differences in the cost per patient discharge.
However, the project notes that 'there is a difference of approximately $3 trillion (approximately 475.164 trillion yen) in annual medical expenses between the United States and Japan, and the examples given are only a fraction of the total.'
Related Posts:


in Note, Posted by log1b_ok