A study that followed people for about half a century reveals the age at which physical performance peaks

While many people know that physical strength and muscle power decline with age, it can be difficult to determine at what age the peak occurs and when the decline becomes noticeable. A Swedish research team followed a group of ordinary participants who do not regularly engage in strenuous activities, such as athletes, for 47 years to examine how physical ability changes with age.
Rise and Fall of Physical Capacity in a General Population: A 47-Year Longitudinal Study
47-Year Study Reveals The Age We Hit Our Physical Peak
https://www.sciencealert.com/47-year-study-reveals-the-age-we-hit-our-physical-peak
Although there have been previous studies examining the relationship between aging and physical fitness, the mainstream has been cross-sectional studies that compare groups of people at a certain point in time by age. A research team led by Maria Vesterstall and Gustav Jornöker of the Karolinska Institutet in Sweden felt that cross-sectional studies may underestimate the decline in physical fitness due to aging, and therefore believed that longitudinal data that follow the same people over a long period of time was necessary to confirm this.
The research team used data from a cohort study of long-term physical activity and fitness among the general population born in 1958. Participants were enrolled in 1974 when they were 16 years old and were followed continuously thereafter. The analysis used data from five measurements taken at ages 16, 27, 34, 52, and 63.
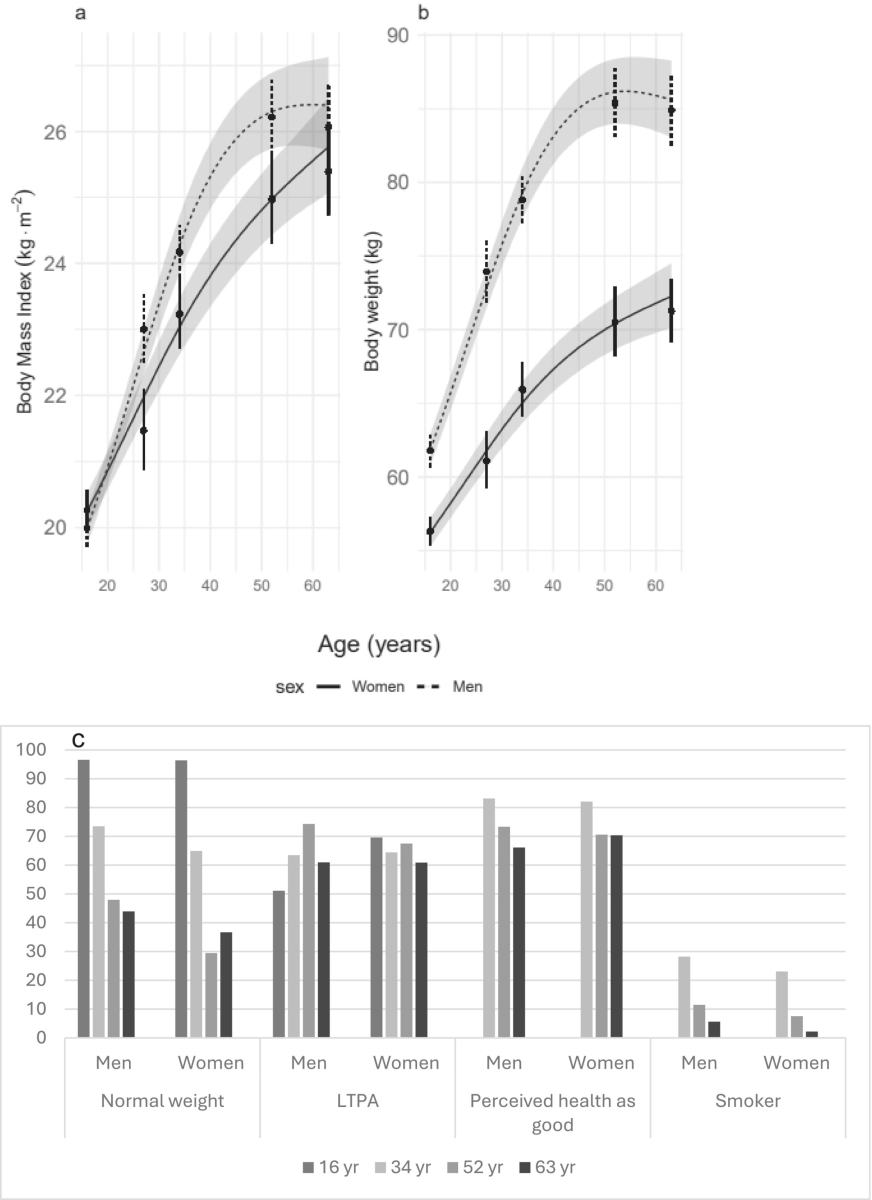
Because physical ability is inseparable from changes in physique and lifestyle habits, the research team also examined changes in BMI and weight over time, the percentage of people who were at ideal weight for each age, leisure-time physical activity (LTPA), self-assessed health, and smoking status. The graphs below summarize the changes over time for each factor. The solid line on the graphs represents women, the dotted line represents men, and the gray band represents the range of estimates.
The researchers found no significant gender differences in muscular endurance and estimated maximum aerobic capacity, which peaked between the ages of 26 and 36, initially declining at a rate of 0.3% to 0.6% per year, before accelerating to 2.0% to 2.5% per year. However, the timing of peak explosive power differed: men peaked at age 27 and women at age 19, initially declining at a rate of 0.2% to 0.5% per year, before accelerating to over 2% per year.
The graph below summarizes the changes by age, with the top two showing absolute values and aerobic capacity per body weight, the bottom left showing the number of bench press repetitions as an indicator of muscular endurance, and the bottom right showing the vertical jump as an indicator of explosive power.
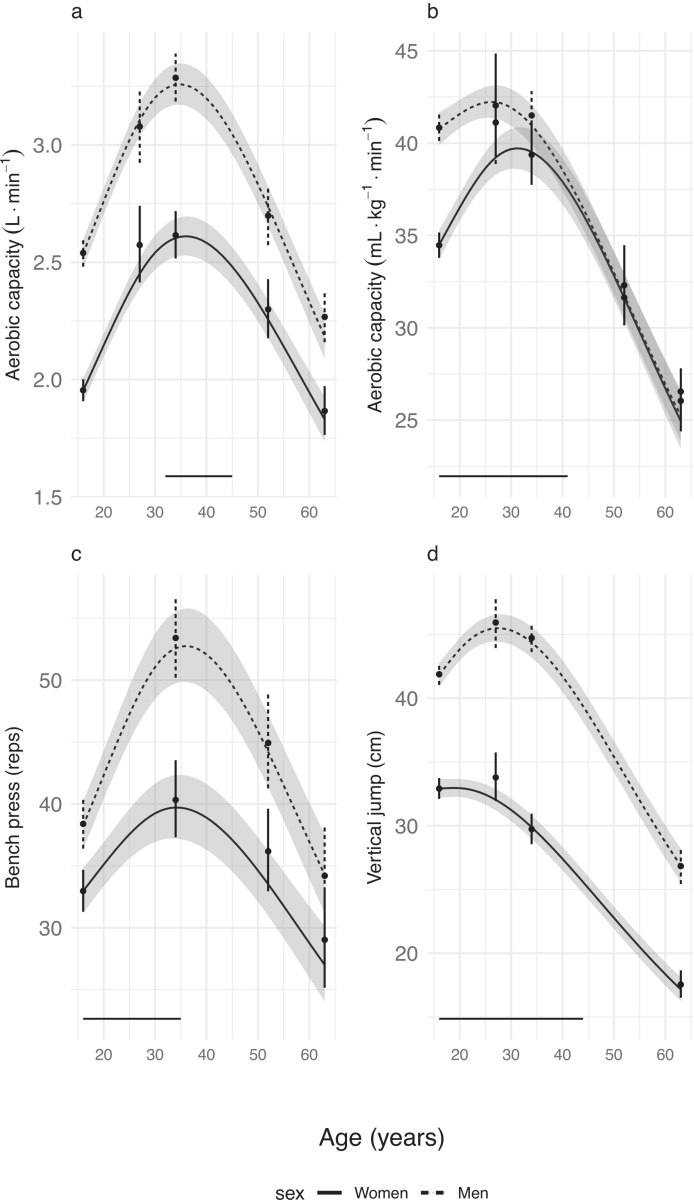
The research team also reported that the decline in physical ability from peak physical ability to age 63 ranged from 30% to 48%, depending on the indicator. Endurance and muscle strength did not decline at the same rate, and there were differences in the extent to which each indicator declined.
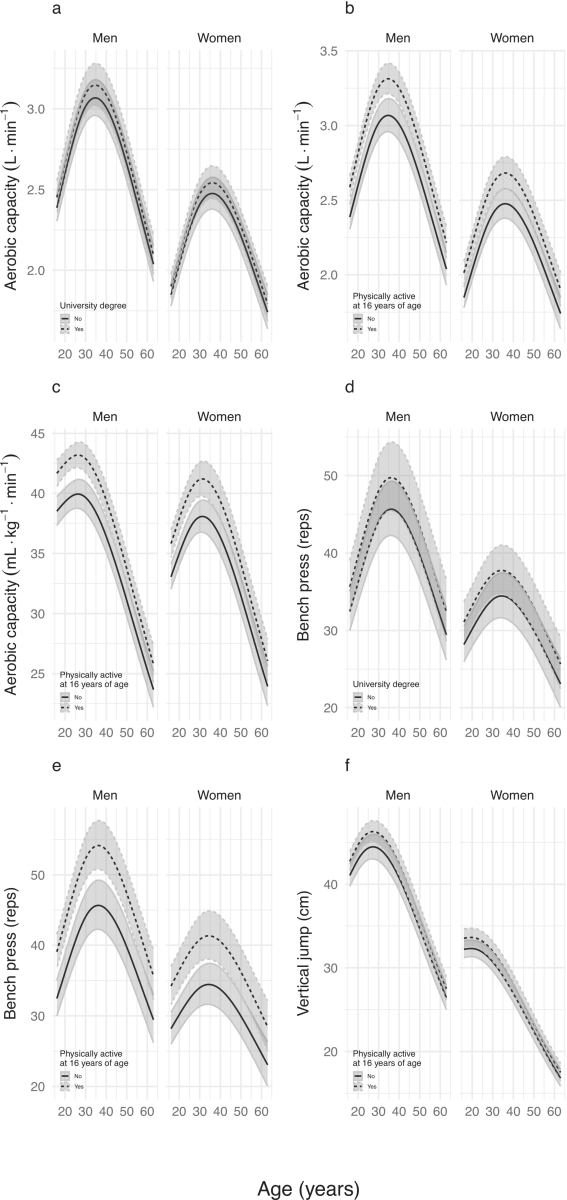
The research team looked not only at the age at which people peaked, but also at differences in ability levels even at the same age. The researchers found that participants who were physically active at age 16 maintained higher aerobic capacity, muscular endurance, and explosive power throughout the observation period.
The graphs below show the differences by category. Graph a shows aerobic capacity (absolute value: L/min) by college degree holders. Graph b shows aerobic capacity (absolute value: L/min) by physical activity at age 16. Graph c shows aerobic capacity (per body weight: mL/kg/min) by physical activity at age 16. Graph d shows muscular endurance (bench press repetitions) by college degree holders. Graph e shows muscular endurance (bench press repetitions) by physical activity at age 16. Graph f shows explosive power (vertical jump) by physical activity at age 16. The graphs on the left and right show the progression over time for men and women, respectively.
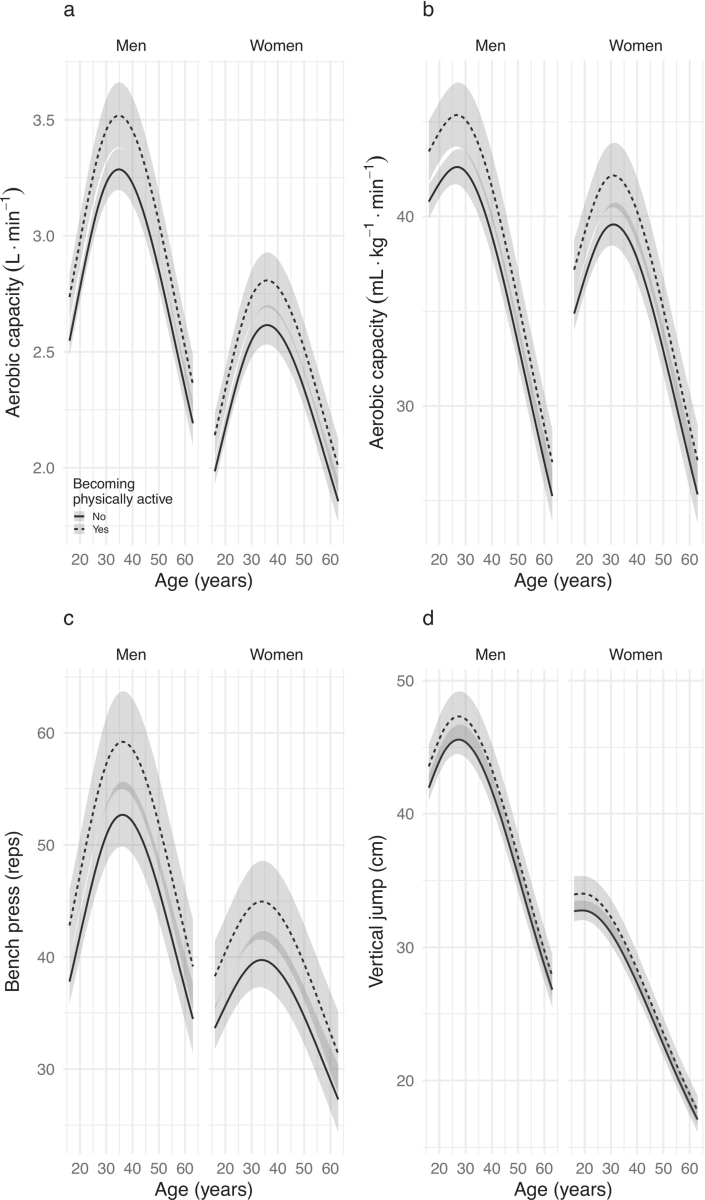
The researchers also analyzed whether starting exercise in adulthood had any effect, and found that participants who became more active in adulthood may have improved their physical fitness by about 10 percent.
The graphs below compare the progress of participants who became more physically active during the study. Graph a shows aerobic capacity (absolute value: L/min), graph b shows aerobic capacity (per body weight: mL/kg/min), graph c shows muscular endurance (bench press repetitions), and graph d shows explosive power (vertical jump). In all cases, the solid line shows the progress of participants who became more physically active during the study, and the dotted line shows the progress of participants who did not become more physically active.
In conclusion, the research team states that their findings show that decline in physical ability does not begin suddenly in people's 60s, but can begin as early as their mid-30s, and that the rate of decline in physical ability may increase with age.
Furthermore, the research team reports that while exercise is unlikely to delay the peak of physical ability, exercise habits may be linked to the rate at which physical ability declines and the level at which it can be maintained.
The research team stated that it is necessary to investigate 'the mechanism by which most people's physical abilities peak around the age of 35.' They also stated that while physical activity may slow decline, it is also necessary to dig deeper into the mechanism behind why it does not completely stop decline.
Related Posts:


in Science, Posted by log1b_ok