"Lifetime income of life is determined by the first 10 years of career"

ByLe temple du chemisier
Many people have a passion for saying "When you start working and go to society" many people have a passion for saying "Let's get a lot of salary", but from the results of analyzing the income data for the past 200 million people in the United States, It turned out that those who earned a lot of income early in the career tend to have a dramatic growth rate in later years.
What Do Data on Millions of U.S. Workers Reveal about Life - Cycle Earnings Risk?
(PDF file)http://www.newyorkfed.org/research/staff_reports/sr710.pdf
Your Lifetime Earnings Are Decided in the First 10 Years of Your Career - Bloomberg Business
http://www.bloomberg.com/news/articles/2015-02-09/your-lifetime-earnings-are-decided-in-the-first-10-years-of-your-career
This researchFederal Reserve Bank of New YorkThe research team of Fatih Guvenen et al. The team analyzes the revenue data of about 200 million from 1978 to 2010 and investigates the relationship between the scale of revenue and its growth rate.
Here is one of the graphs shown in the report. The horizontal axis shows the distribution of income size, which means that the more you go to the right, the more revenue you have. The vertical axis shows the growth rate of each distribution, but it is shown that the higher the income, the higher the growth rate, and the difference in growth rate has a big influence on income size It can be seen.
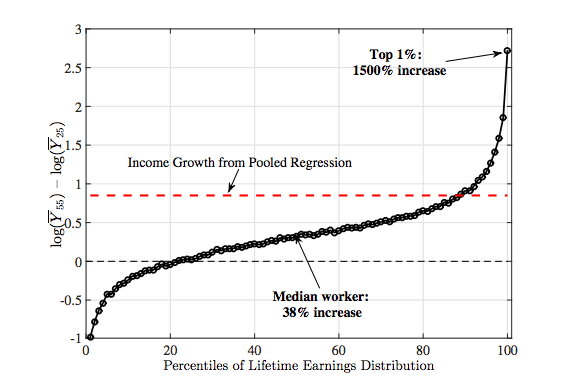
In the case of the average earnings income, the increase rate of income between 25 and 55 years old was 38%, whereas the upper 5% (95Percentile) And the rate of increase of people belonging to the upper 1% (99th percentile) is 230%, and it is clear that the rate of increase is acceleratingly increasing to 1450% in the upper 1% (99th percentile) stratum.
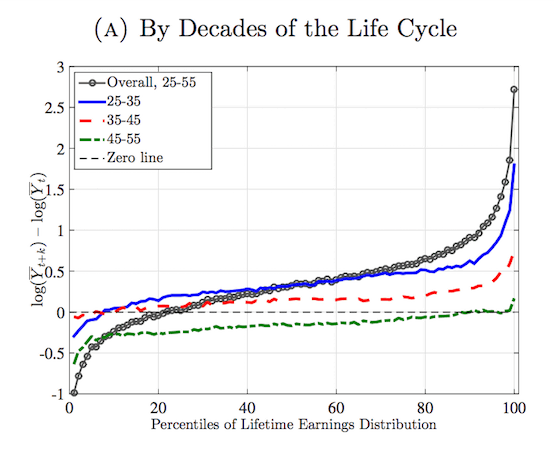
And here is the graph showing the growth rate by age by color. The black dotted line on the line of "0" indicates "growth rate 0% line", which means that the income is decreasing if it is below this line. It can be seen that the line of blue (25 to 35 years old) and red (35 to 45 years old) is in the positive area in any income group, but the line of green (45 to 55 years old) is almost all income We are beginning to see negative growth in the layer. This means that "Revenues are most likely to increase until the age of 45,Age from 25 to 35 has the greatest influence on growthThat means that.
Although it is not necessarily to be pessimistic to say "I have not succeeded because I did not succeed while I was young", it seems likely that the young start dash is strongly responding to the subsequent growth strongly.
Related Posts:


in Note, Posted by darkhorse_log