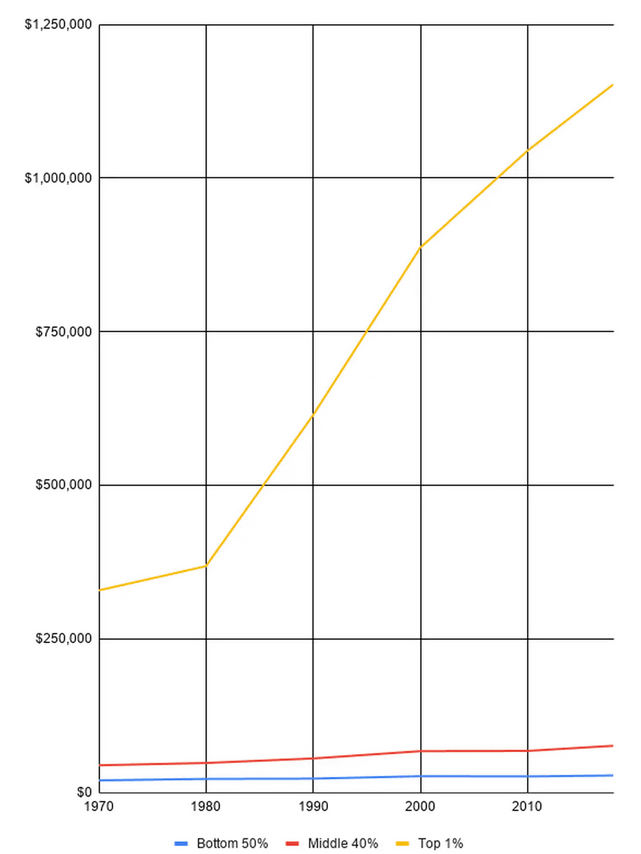
The survey clearly shows that the top 1% income is growing 100 times faster than the bottom 50%, and when visualizing the momentum it looks like this

by
It has been pointed out that the gap between rich and poor has been widening for some time now, but economists have newly published a table showing how the rich are rapidly increasing their wealth. It's hard to feel the momentum at the individual level as the inequality is widening for decades, but visualization in tables and graphs shows that the change is overwhelming.
The massive triumph of the rich, illustrated by stunning new data-The Washington Post
https://www.washingtonpost.com/opinions/2019/12/09/massive-triumph-rich-illustrated-by-stunning-new-data/
'Staggering' New Data Shows Income of Top 1% Has Grown 100 Times Faster Than Bottom 50% Since 1970 | Common Dreams News
https://www.commondreams.org/news/2019/12/09/staggering-new-data-shows-income-top-1-has-grown-100-times-faster-bottom-50-1970
According to Greg Sargent , a Washington Post columnist, the rich in the U.S. are increasingly wealthy due to their income and regression tax structure, with the richest 1% having tripled their annual income in the last 50 years It turned out that it increased. This is an average increase of $ 800,000 (about 88 million yen), while the average annual income of the bottom 50% is only $ 8000 (about 880,000 yen). thing. The top 1% earns an average of over $ 1 million a year (about 110 million yen) annually, excluding tax, and it seems that the growth rate of income is 100 times higher than the bottom 50%.
New data:
— Greg Sargent (@ThePlumLineGS) December 9, 2019
For top 1%, average income has risen by $ 800,000 since 1970.
For top 0.1%, it has risen by $ 4 million.
For top .01%, it has risen $ 20 million.
Bottom 50%? $ 8,000.
All this is * after taxes and transfers. *
Great work from @gabriel_zucman : https://t.co/iaxntlHdvl
Sargent's announcement is based on research by economists Gabriel Zachman and Emmanuel Saez . In a book called The Triumph of Injustice , they publish a table of how people's salaries have changed.
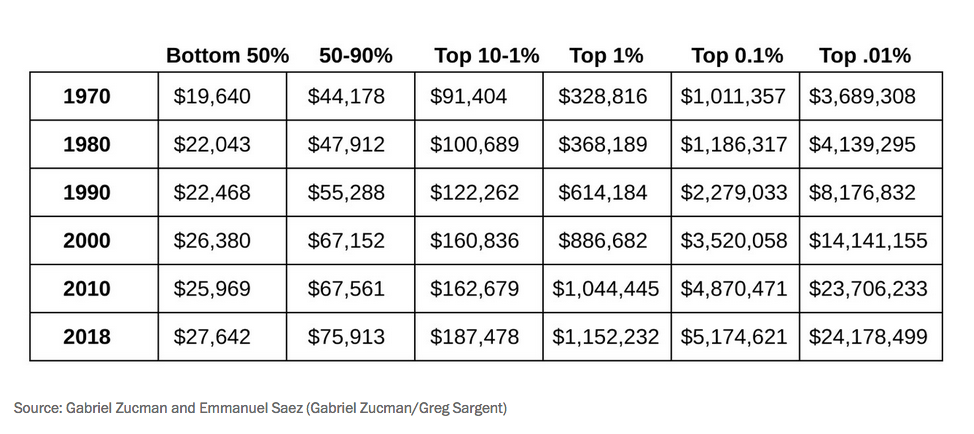
The following is the table. The columns indicate the age, marked from top to bottom in 10-year increments. In addition, the rows are groups of the average annual income, so from the left, the “lowest 50%”, “50-90%”, “top 10-1%”, “top 1%”, “top 0.1%”, “top 0.01%” It has become. It can be seen that the bottom 50% has little change in the last 50 years, while the top 0.01% has changed digits. From 2000 to 2010, the bottom 50% in the recession has reduced the proceeds, but the top tier has increased without being affected by the recession.
Further graphs of 'Lower 50%' (blue), 'Medium 40%' (red), and 'Top 1%' (yellow) look like this. You can see that the top 1% of the proceeds are increasing at a rate comparable to the bottom and middle ranks.
Some politicians, including Congressional candidate Elizabeth Warren, have alleged the introduction of a tax called the `` Ultra-Millionaires Tax, '' which includes renowned investor George Soros and others agree.
Mr. Soros and others millionaires 'tax on the super rich' (Photo = AP): Nihon Keizai Shimbun
https://www.nikkei.com/article/DGXMZO46527130V20C19A6000000/

Zachman and Saez said that the introduction of the super-rich tax is `` To understand the wealth gap, the annual income of the top tier is increasing explosively '' and `` Effective tax rate of all income classes '' 2 Two things are important. ' Not only is the inequality in the market widespread and pre-tax income is unequal, but in addition to that the tax system is reluctant to redistribute the top tier of income, so two factors Are likely to reinforce each other and widen the gap.
You can see how the tax rate for the wealthy has been reduced in the past 70 years from the following movie. The change is overwhelming.
Watch how radically taxes on the wealthy have fallen over the past 70 years:
— David Leonhardt (@DLeonhardt) October 7, 2019
(Full column: https://t.co/XP0a4Iljti ) pic.twitter.com/dGxmOjQ1b5
Tony Annette , Columbia University's Center for Sustainable Development, pointed out that GDP can no longer be used as a measure of economic well-being because growth benefits are no longer distributed to all income earners. .
With this kind of distribution, it is no longer meaningful to rely on GDP, not even accounting for its other deficiencies. GDP became a widely used measure of economic well-being at a time when the benefits of growth were shared widely.https : / /t.co/IIL5EYMMGy
— Tony Annett (@tonyannett) December 9, 2019
Anxious Scientists Alliance Seth Michael is also concerned about economic growth remaining in the hands of a few and many not seeing it.
even if you know that inequality is increasing, the scale is staggering to consider.the bulk of a * generation * of economic growth has been captured and concentrated in a few hands, and many people have barely seen any of it.https : // t.co/XldPkUoIM9
— ???? Seth D. / Michaels / A Wonderful Christmas Time (@sethdmichaels) December 9, 2019
Related Posts:


in Note, Posted by darkhorse_log