Young people are becoming poorer than the adults of the upper generation

ByGarry Knight
Not everyone can be at Millionaire (millionaires) many people dream about, and the probability of being a Millionaire varies depending on age. For example, as of 2015, a 62-year-old American will get 1 million dollars (about 124 million yen) per one in seven, but if it is under 40 years old the proportion will be 1 in 55 It is said that it will be a steep road as a person. Although the probability of elderly becoming billionaire in the past 25 years slightly improves, the survey results showing that the disparity of rich and poor in every generation is widening, that the probability of the young generation is greatly deteriorating ToFederal Reserve Bank of St. LouisAnnounced.
HFS - Essay - 3 - 2015 - Age - Birth - year - Wealth.pdf
(PDF file)https://www.stlouisfed.org/~/media/Files/PDFs/HFS/essays/HFS-Essay-3-2015-Age-Birth-year-Wealth.pdf
The growing wealth gap that nobody is talking about - The Washington Post
https://www.washingtonpost.com/news/wonkblog/wp/2015/07/29/millennials-should-no-longer-dream-of-ever-becoming-millionaires/
Federal Reserve Bank of St. LouisHousehold economic stability centerInvestigated 40,000 households during the period from 1989 to 2013 and investigated what kind of influence the birth year has on income.
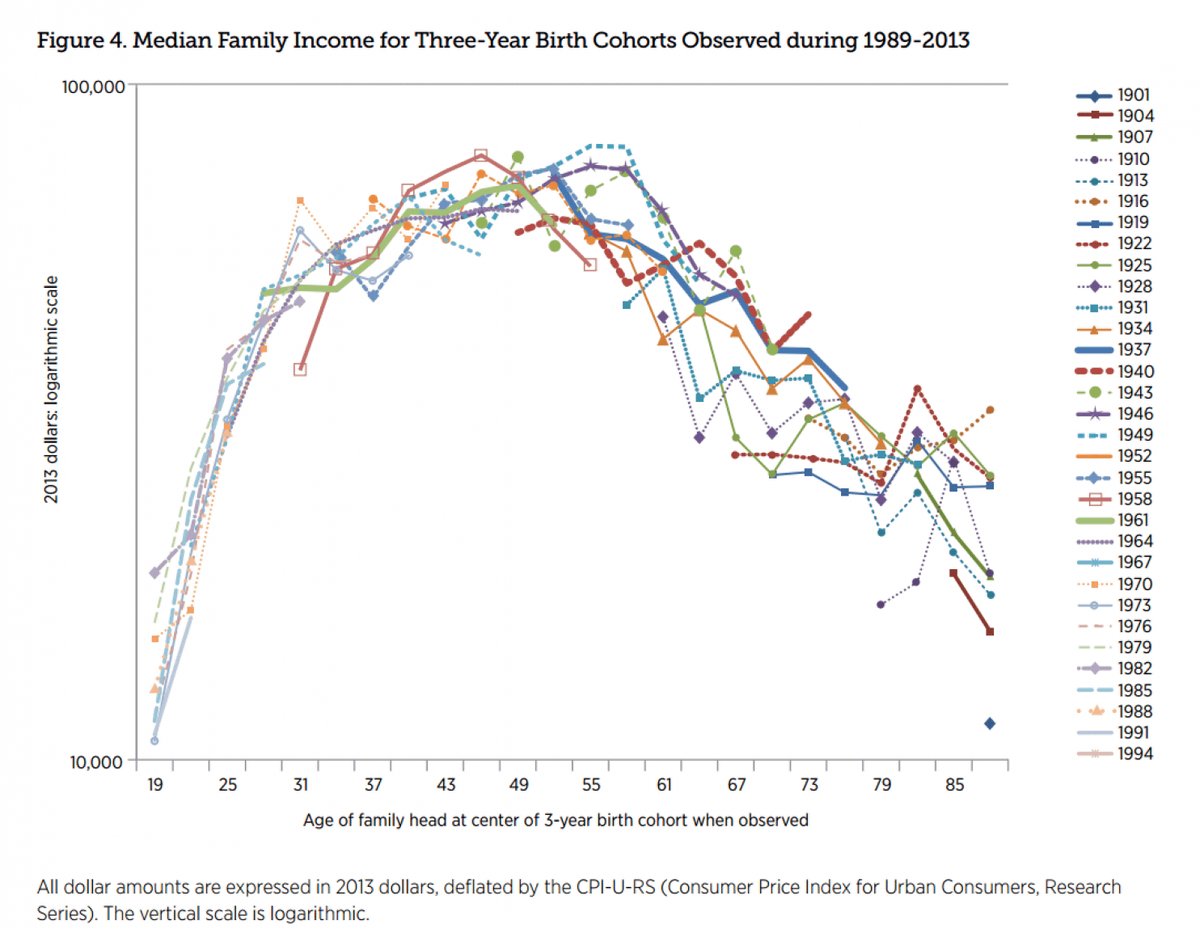
According to the survey, it turns out that every generation has a tendency to follow certain kinds of natural patterns with the course of life, for example, because the working period is still short until reaching 40 years, there are not many opportunities to saving sufficient property . When it is 40 to 61 years old it will start to turn the property into savings because it will have a sufficient working period. Since it will retire from retirement beyond the age of 62, it tends to start using property. Despite all generations forming wealth with this trend, it turned out that the current situation that the modern young generation became more difficult to become wealthier than the old generation.
Below is a graph of "average household income" from 1989 to 2013 by grouping people of different birth year every three years, such as 1901, 1904, 1907. The vertical axis represents average household income, and the horizontal axis represents the transition of age. Lines have been created with different colors for each year of birth, for example, the line rises rapidly from 19 to 30 years old because it graduates from high school and university and starts to work, obtaining a job I understand that the average household income is rising.
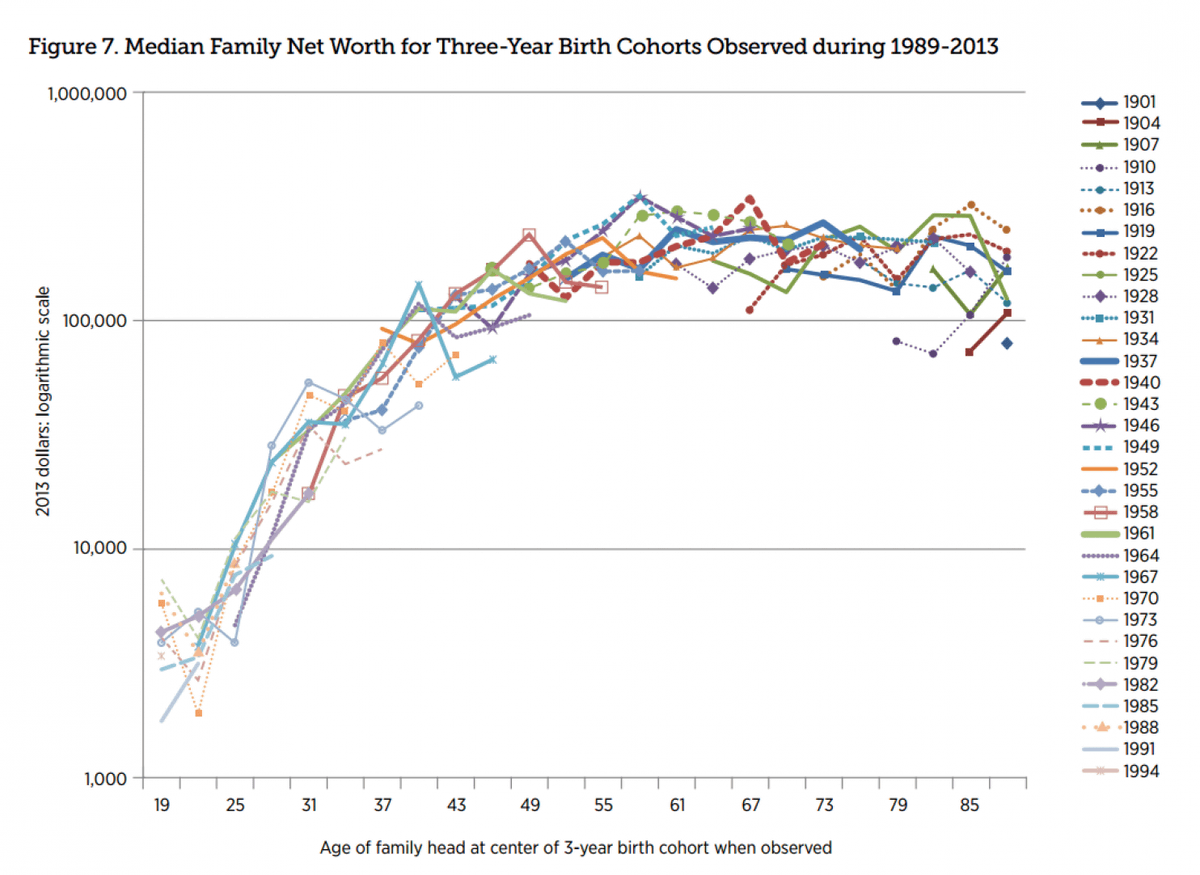
The graph below shows the "net assets" of debt minus the total assets of the same period / group. Compared with the chart of the average household income, you can see that the net assets take time to accumulate and the end gradually declines. This is because repayment of scholarships, housing loans, etc. begins in a phased manner in life, and it does not decline sharply after retirement because it is after having acquired a large asset like home.
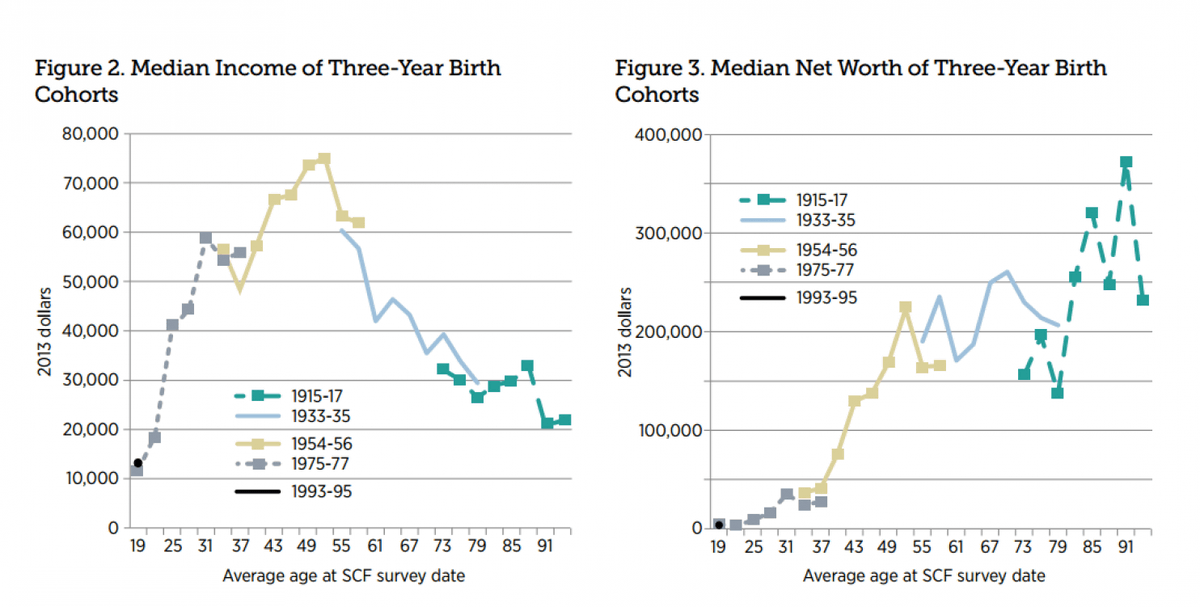
The last graph was born between 1915 and 1917 and paid a great sacrifice for World War II "The greatest generation"Born between 1933 and 1935Silent generation"Born from 1954 to 1956"Baby BoomerGeneration "and the average income (left) and net assets (right) for each generation. Looking at the graph on the left side income, it seems that there is no big gap in the same trend for every generation, but on the graph on the net assets on the right you can see that there is a disparity at the point where each generation overlaps. Especially the generation born before "Silent Generation" born between 1933 and 1935 tends to be wealthy, probably because it benefits from the high economic growth after World War II. Also, this generationThe Great DepressionIt is also a generation born and temporary occurrence of declining birthrate has also reduced competition such as work, housing, investment, etc. It is also a factor that pushed up the net asset.
According to the Federal Reserve Bank of St. Louis, the most dangerous generation is a group born between 1975 and 1977, which has been driven to a standard lower than the living standard that continues to rise. Even though the younger generation between 1993 and 1995 is considered to have a short income earning period, I know that he lives a poorer life than the older generation. In order for young people to become wealthy as the gap between rich and poor generations grows, the provision of contingency loss reserves, less repayment of debt, avoidance of high cost credit cards, large return investment etc. , It is one strategy to model the behavior of older generations.
Related Posts:


in Note, Posted by darkhorse_log