'This is a teenager' lets you scroll through and relive how teenagers are influenced by their parents and environment throughout their adult lives

It is known that early childhood experiences and environment play an important role in children's development, and various evidences have been presented, such as research showing that
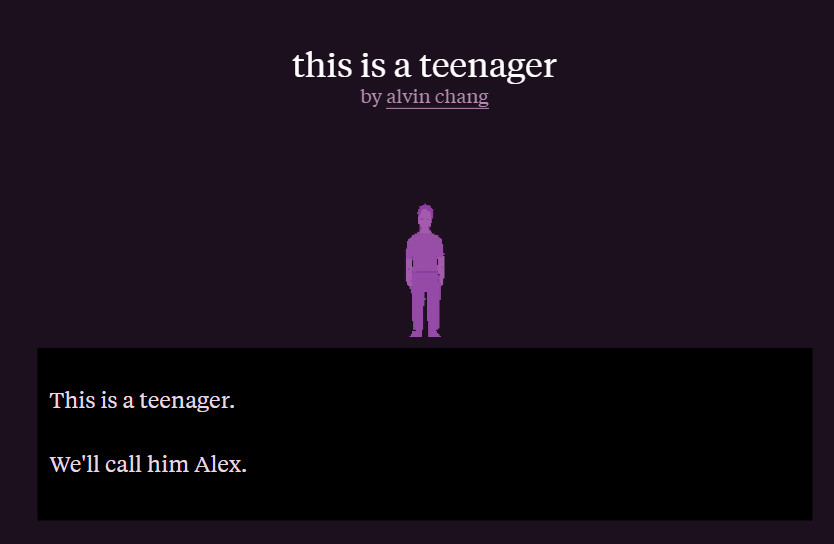
This is a teenager
https://pudding.cool/2024/03/teenagers/
I scrolled down the page a bit and it said, 'This is teenager Alex.'
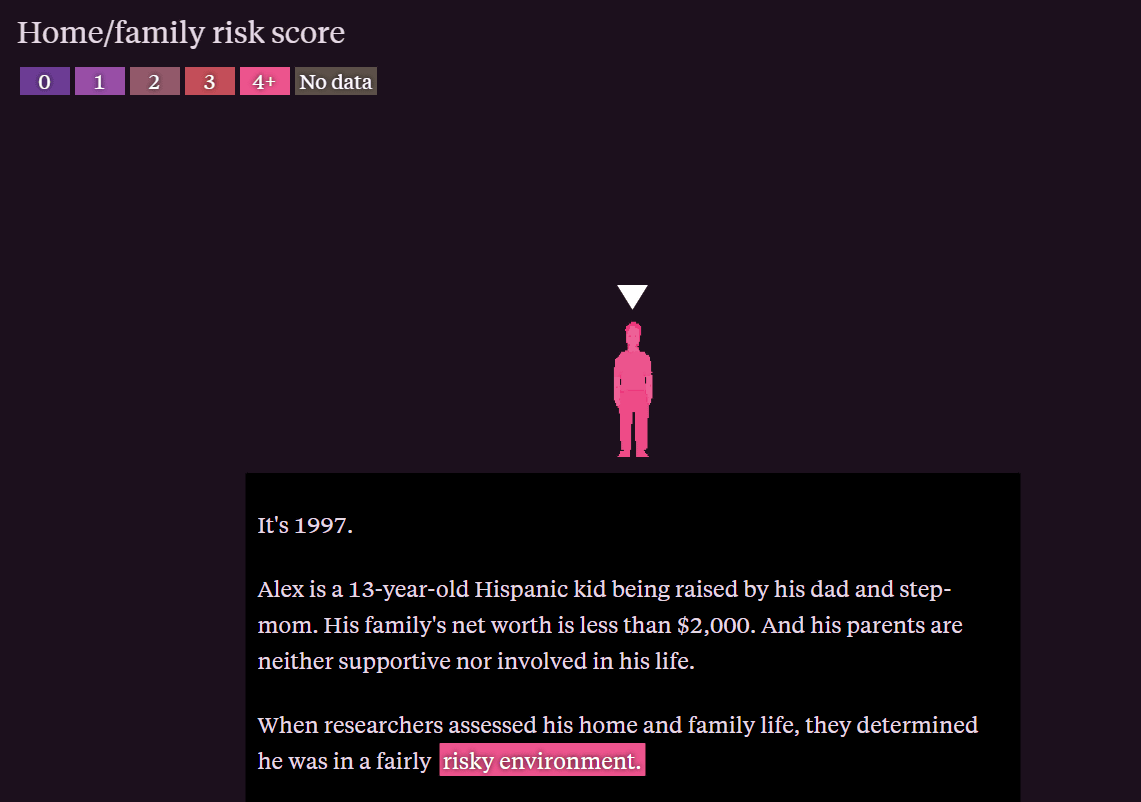
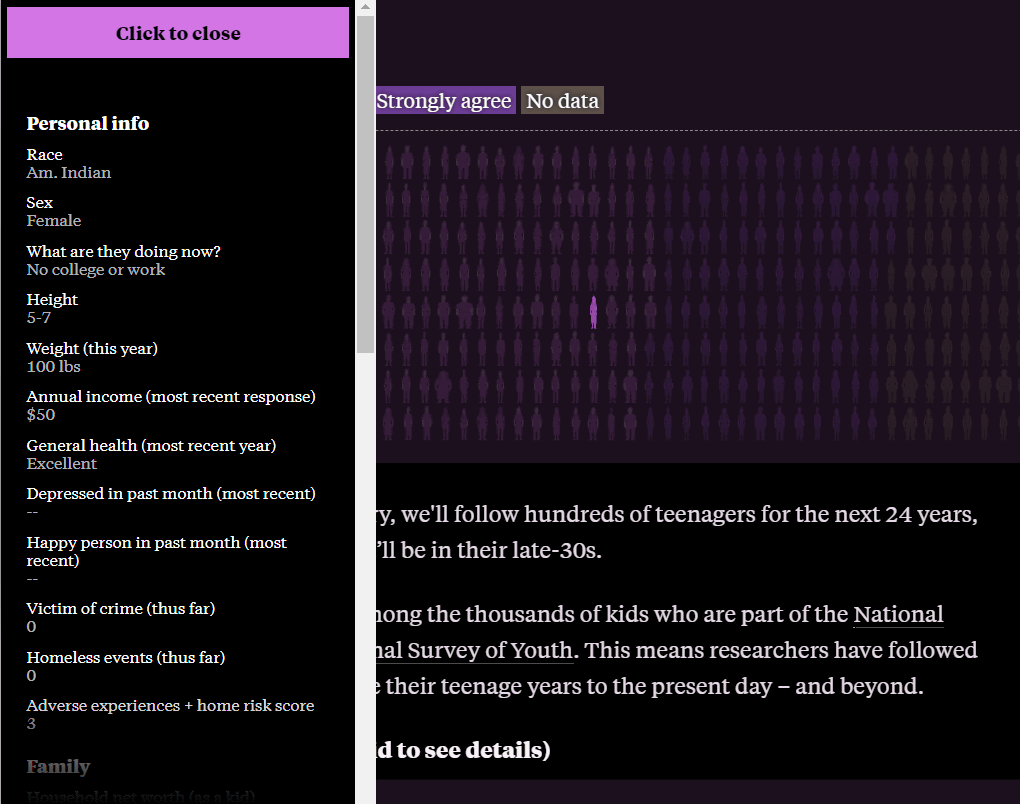
Alex is a 13-year-old child in 1997, raised by a mother who is not related to his father. The family's net worth is less than $2,000, and his parents neither cooperate nor interfere with Alex's life. The researcher evaluates Alex's home and family life as a 'fairly dangerous environment.' At this time, Alex's silhouette turns pink, and the 'Home and Family Risk Score' displayed in the upper left of the image below represents the most dangerous state of '4.'
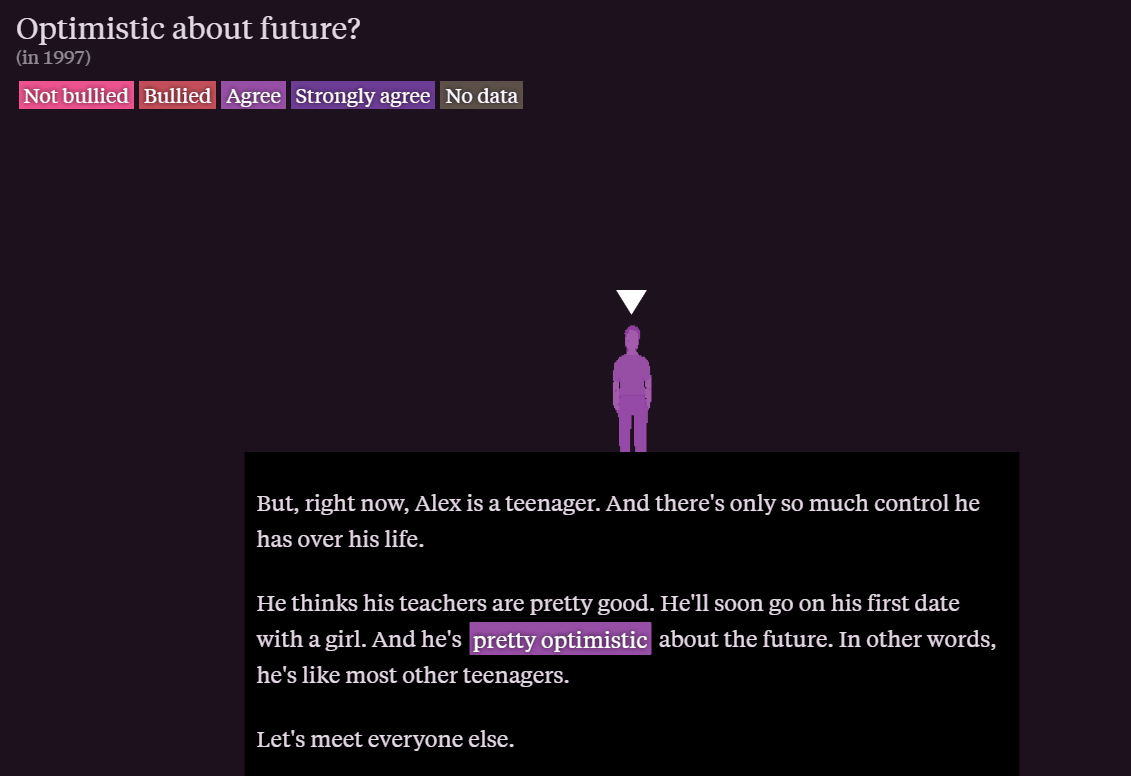
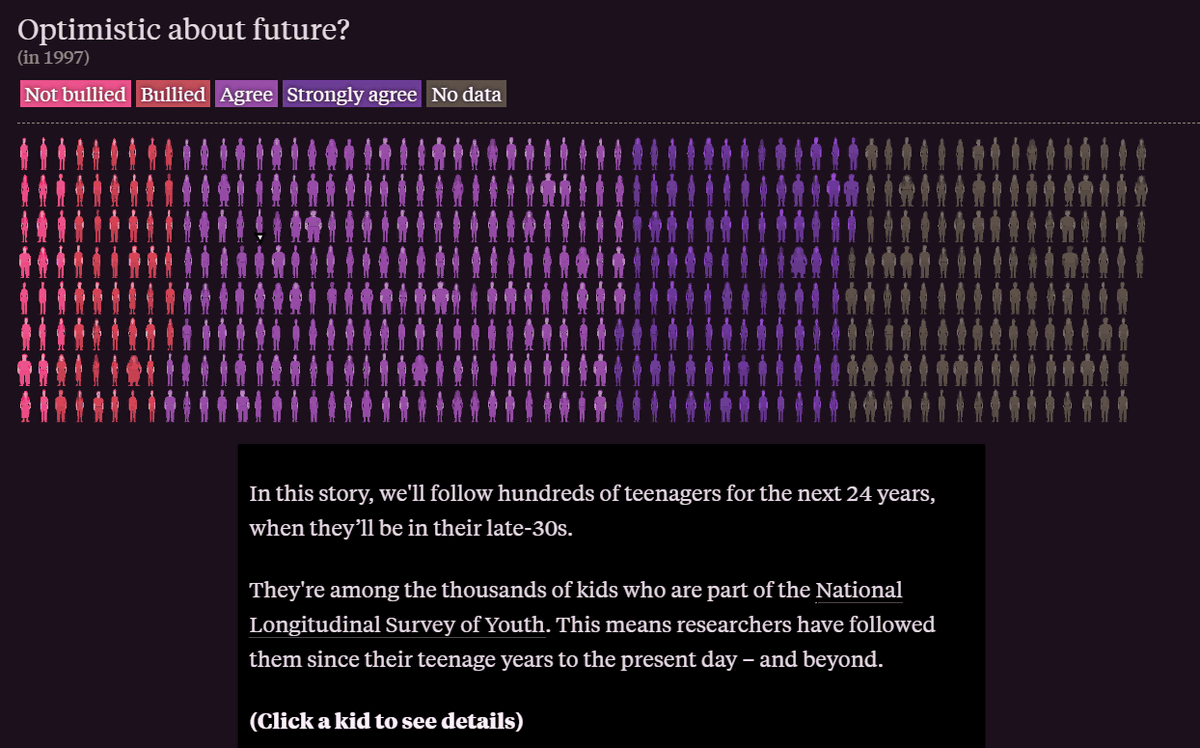
A follow-up study was conducted over the next 25 years, including continuous interviews with Alex. The study found that Alex was likely to grow up to be bullied at school, to have to repeat a grade, to not go to college, and to suffer from physical and mental health issues. However, in 1997, Alex answered 'very optimistic' in purple on the indicator 'Are you optimistic about the future?' In this way, you can scroll through the pages to see how young people, color-coded by various indicators, grow as they get older.
Scrolling further, a large number of silhouettes in various colors appeared. Here, the group that answered 'Strongly Disagree' to the question 'Are you optimistic about the future?' was shown in pink, those who answered 'Disagree' in red, those who answered 'Agree' in light purple, 'Strongly Agree' in dark purple, and those with no data in grey.
Clicking on a person's silhouette will reveal information about that person, including race, gender, height, weight, current occupation and income, health status, family risk score from their youth, other family circumstances, educational background, and relationships such as age at first date and first sex.
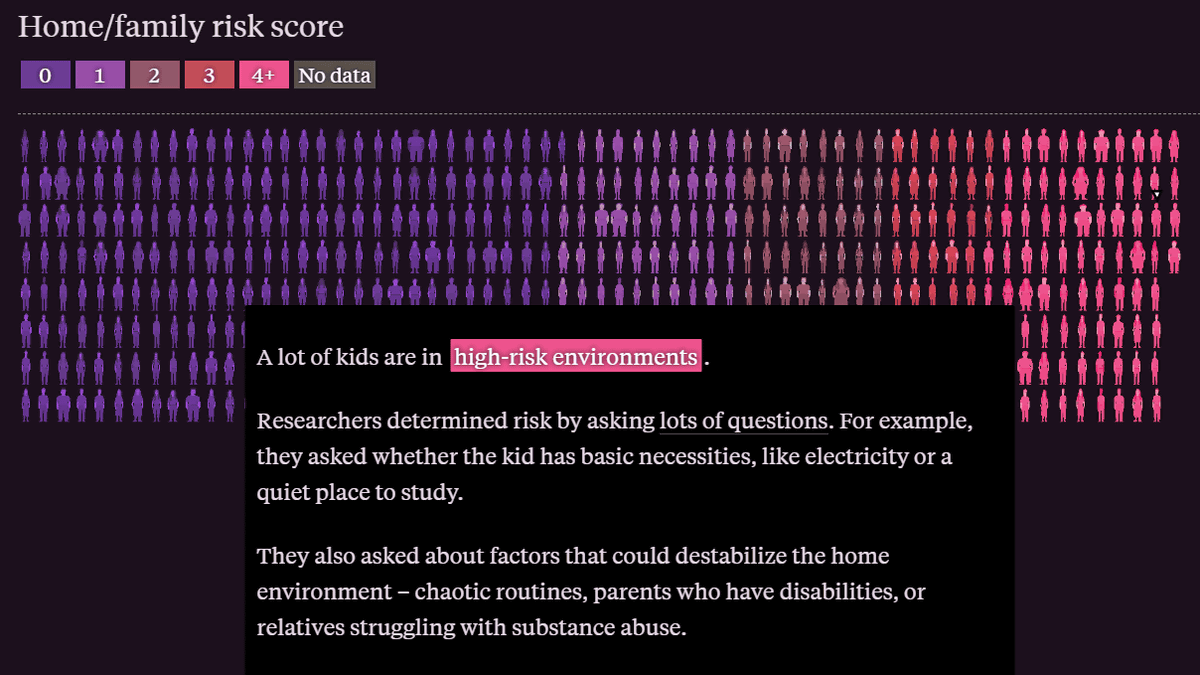
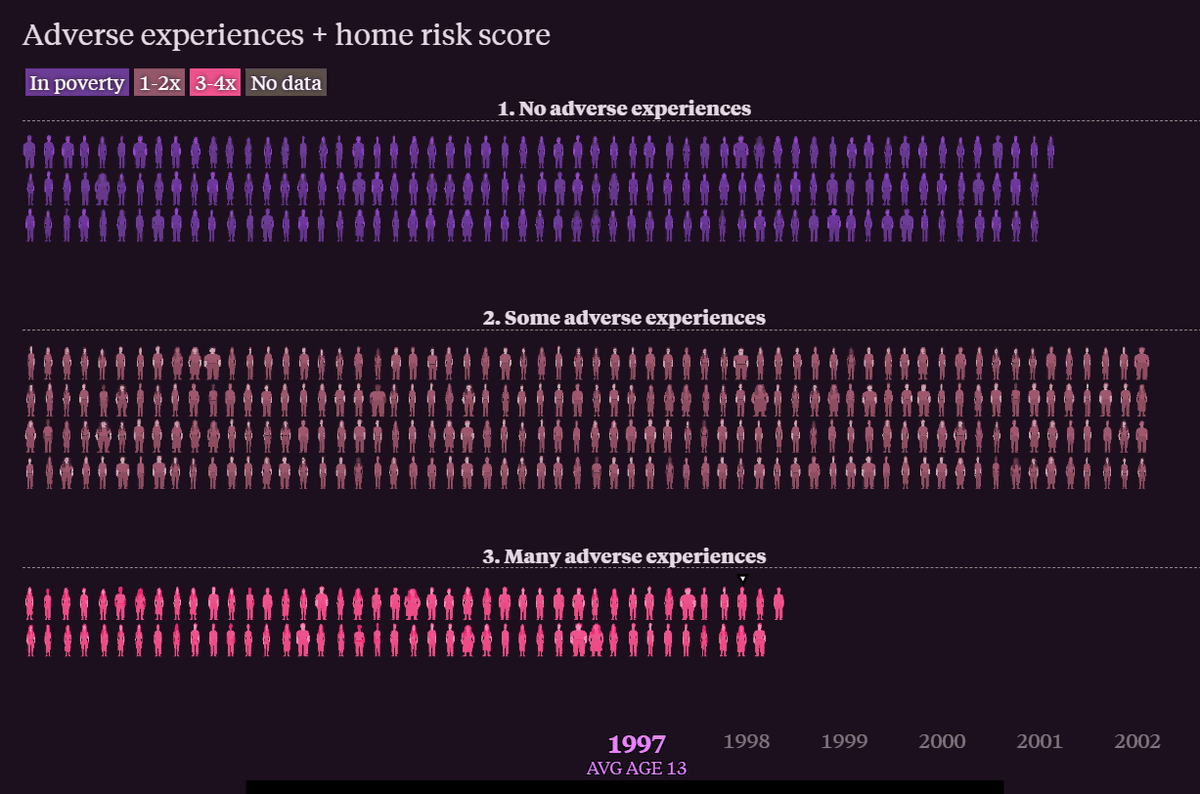
As you scroll further, the indicator in the upper left corner changes to 'Home/Family Risk Score' and the silhouettes start moving.
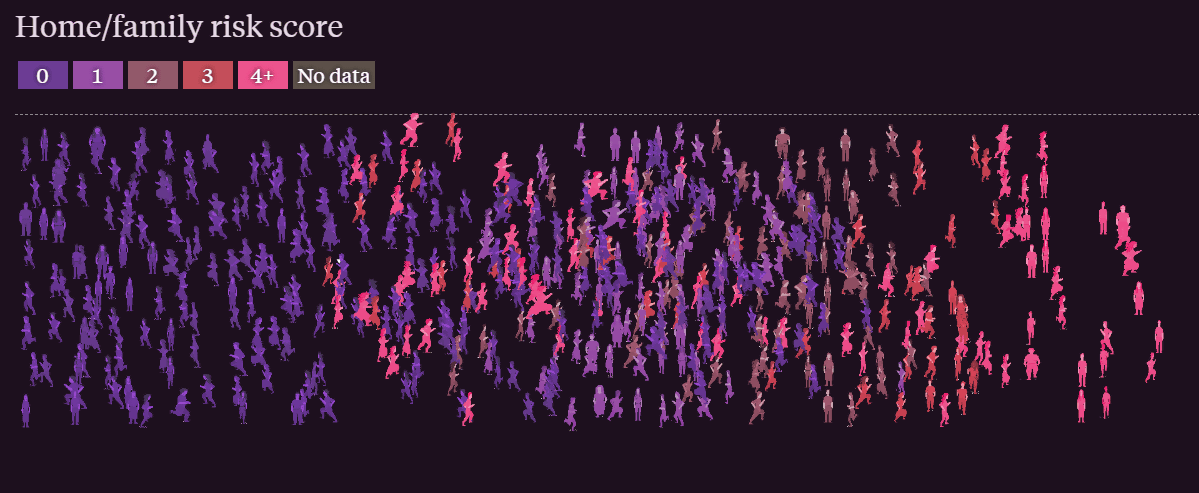
The children are listed according to their 'Home and Family Risk Score.' This shows that many children are growing up in high-risk environments. The 'Home and Family Risk Score' is specifically assessed from interviews about factors that make the home environment unstable, such as whether there are basic necessities such as electricity and a quiet place to study, or whether there is a parent with a disability or a relative who suffers from drug abuse.
In 1998, researcher Vincent Felitti published
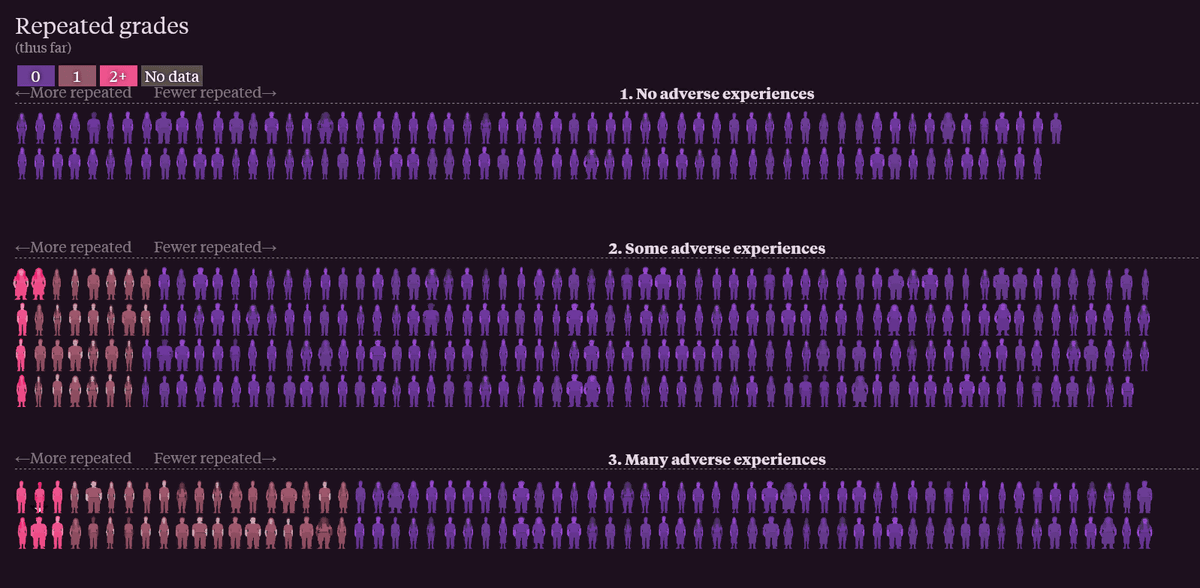
For example, the following is a classification of 'whether or not they have repeated a grade,' with purple representing young people who have not repeated a grade, brown representing young people who have repeated a grade once, and pink representing young people who have repeated a grade twice or more. No young people in the 'no adverse experiences' category had repeated a grade, but in the 'some adverse experiences' category, 25 people had repeated a grade once and five had repeated a grade twice or more, and in the 'many adverse experiences' category, 32 people had repeated a grade once and six had repeated a grade twice or more, indicating that the stronger the adverse experiences, the higher the rate of repeating a grade.
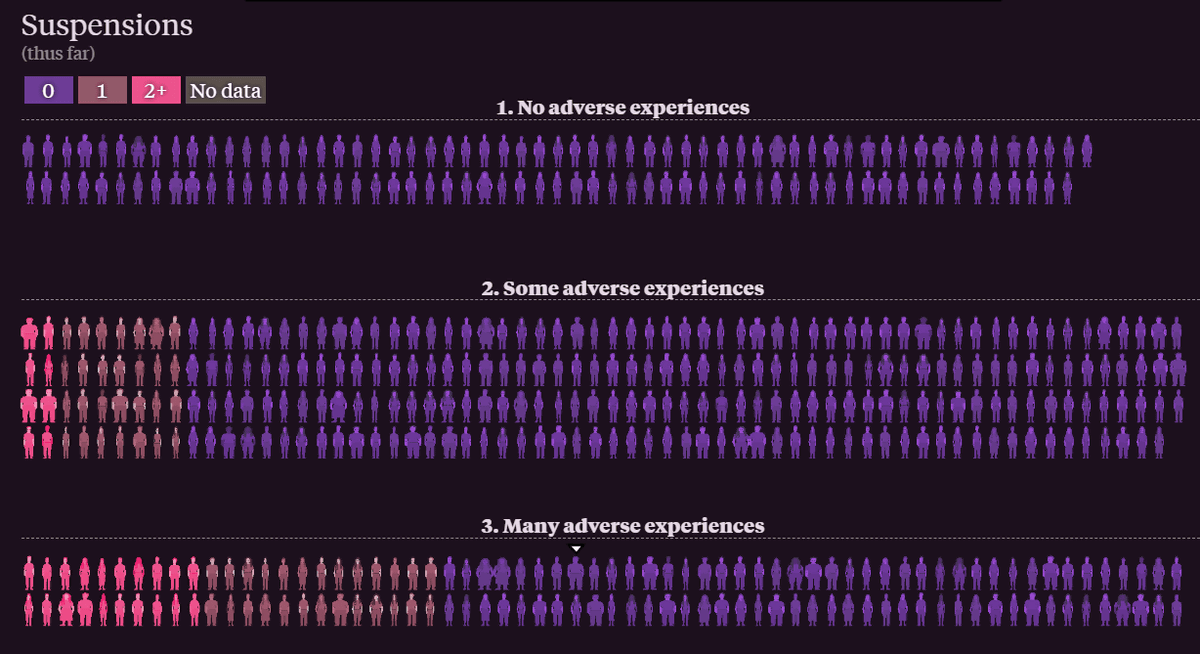
Also, below is the number of times a student has been suspended. Again, we can see that the brown color indicates a high number of suspensions, and the pink color indicates a higher percentage of students with more adverse experiences.
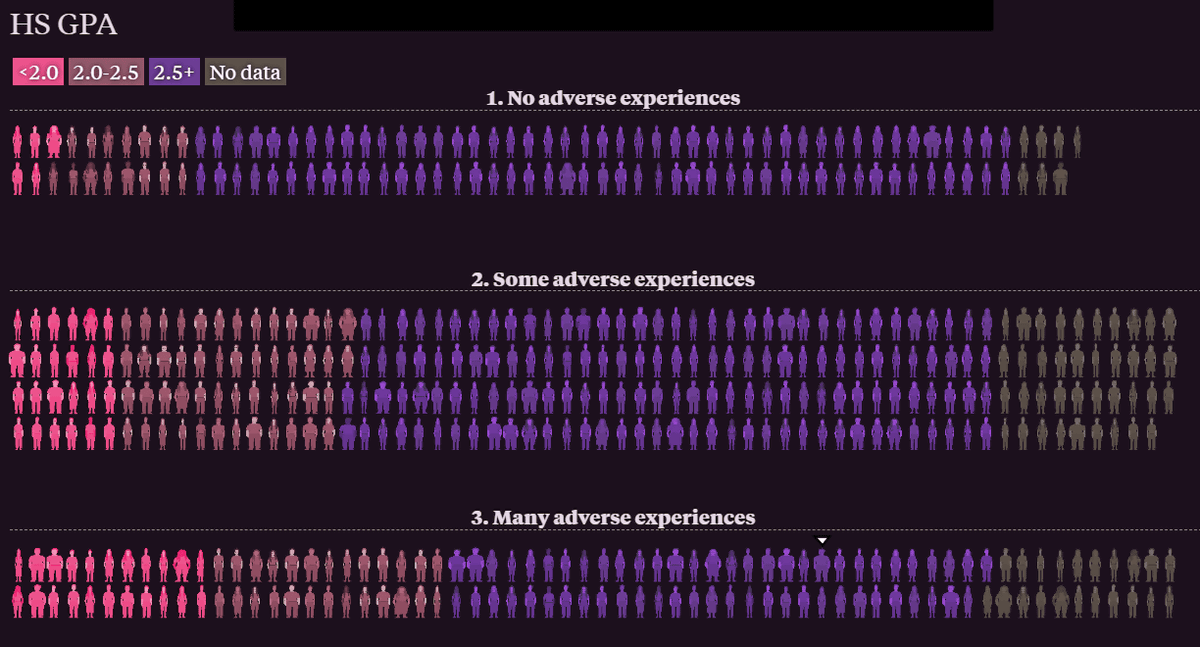
Regarding high school GPA, which is the average of grades over three years of high school, the pink 'GPA below 2.0' is more prevalent in the group with many adverse experiences, while the majority of the group with no adverse experiences recorded high scores of 'GPA 2.5 or above.'
By 2002, most young people had graduated from high school. The percentage of people who can go on to college is also affected by childhood experiences and family risks. In the figure below, people who did not attend college and were not working are shown in pink, people who graduated from high school and got a job are shown in brown, and people who went on to college are shown in purple. Some
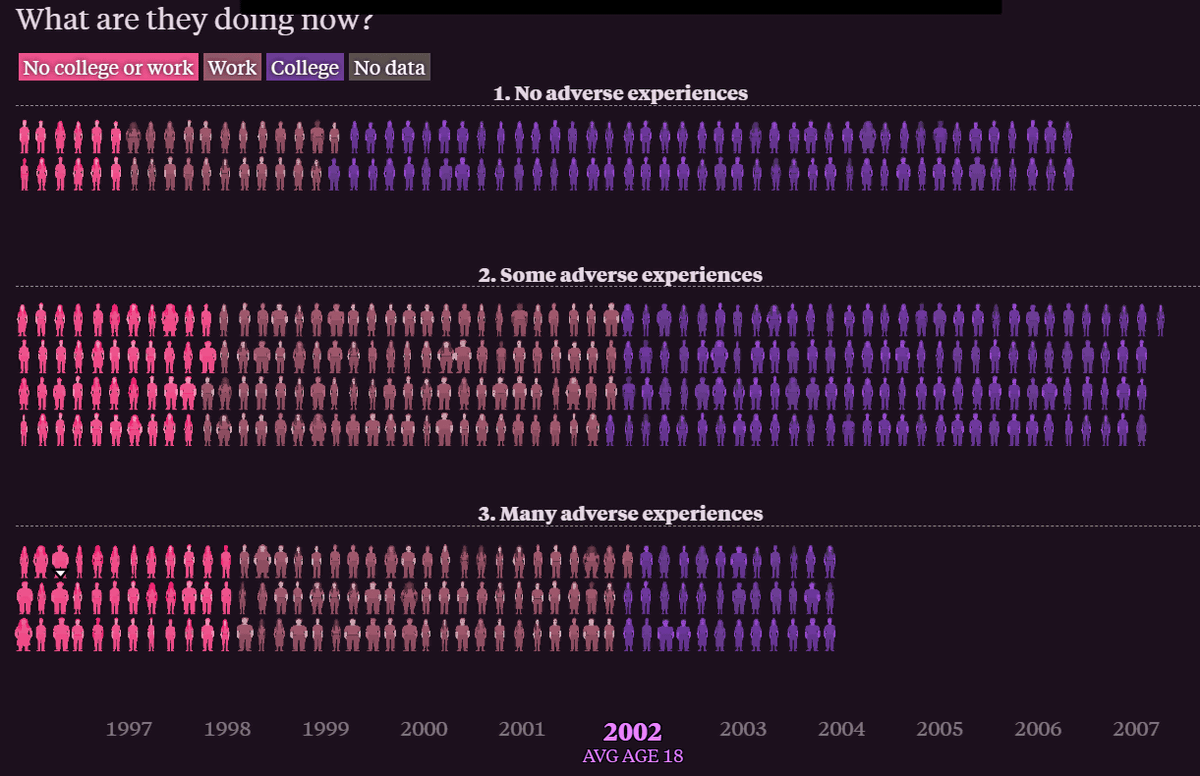
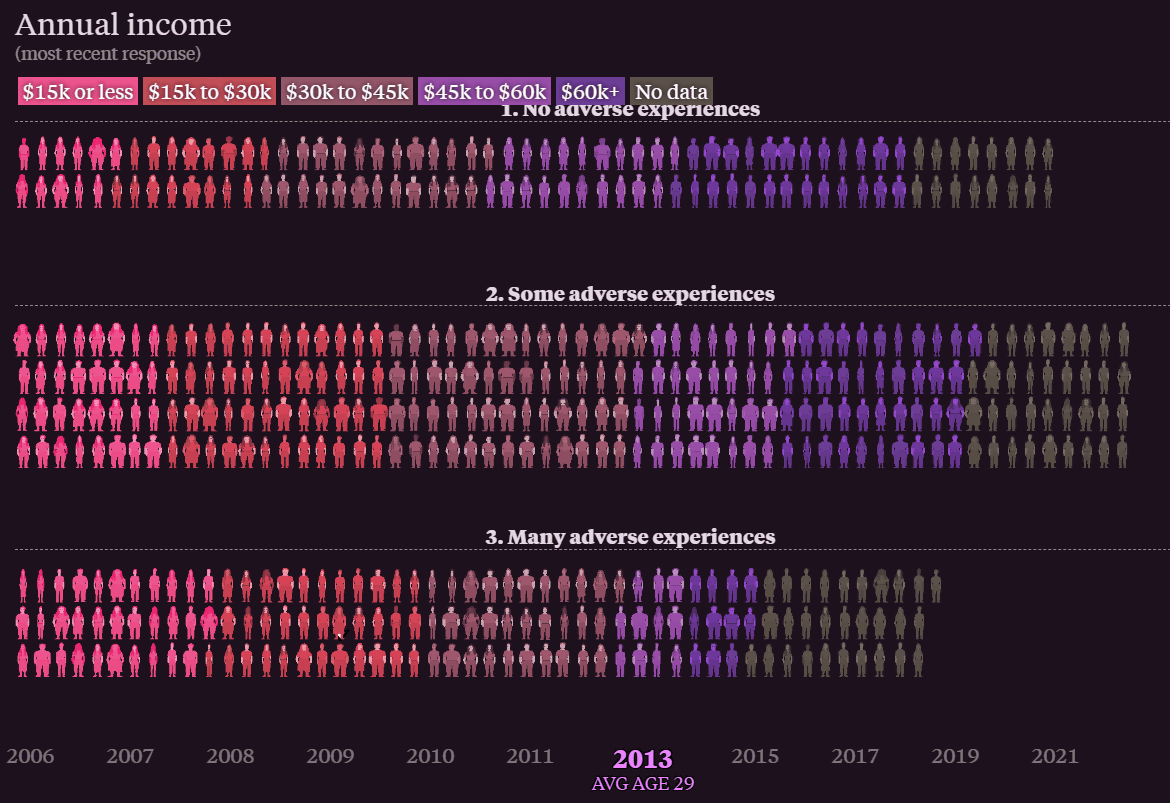
From there, you can scroll down to see how the percentage of people who are working has risen and fallen over the years. By 2013, when the average age of the young people we track is 29, most of both groups are working. But we still find that annual earnings are affected by adverse childhood experiences.
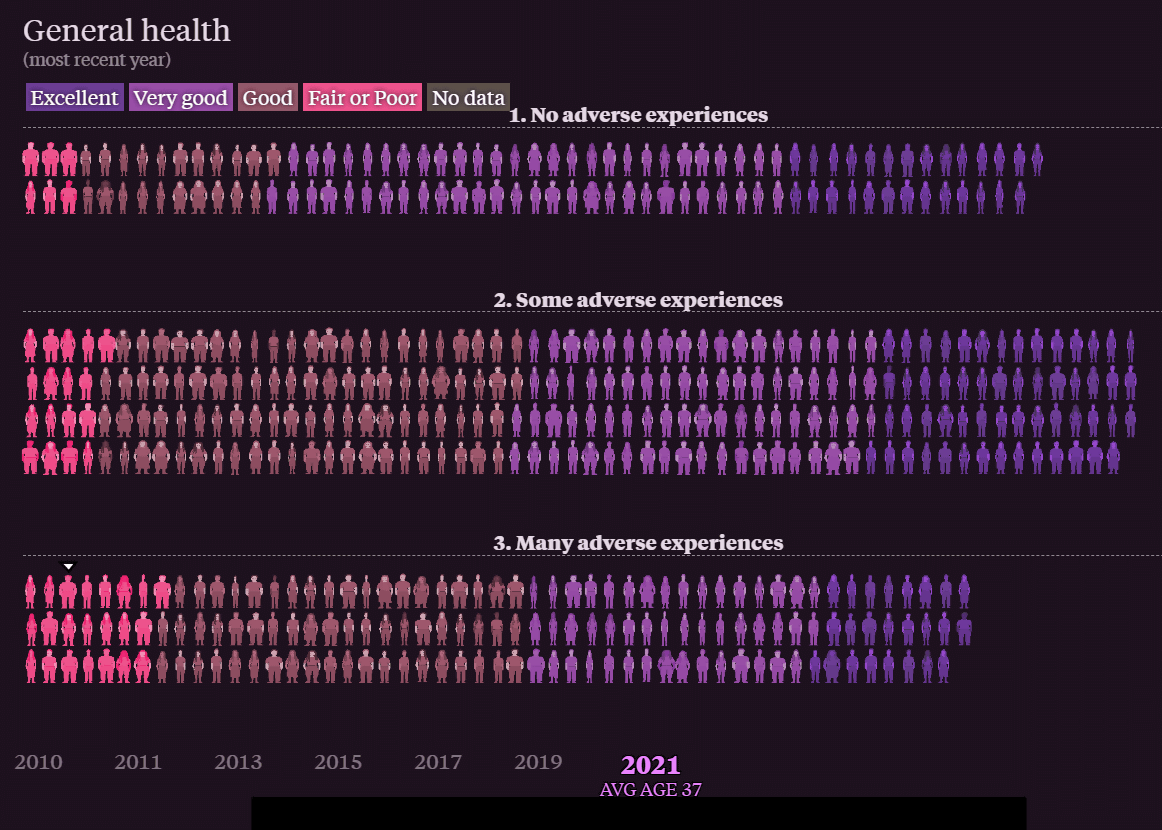
Furthermore, childhood experiences also influence future health. In the top group of people with no adverse experiences, most people described their health as 'fairly good' or 'excellent,' whereas in the groups with some adverse experiences and many adverse experiences, less than half described their health as 'fairly good' or 'excellent,' with most people describing it as 'average or poor.'
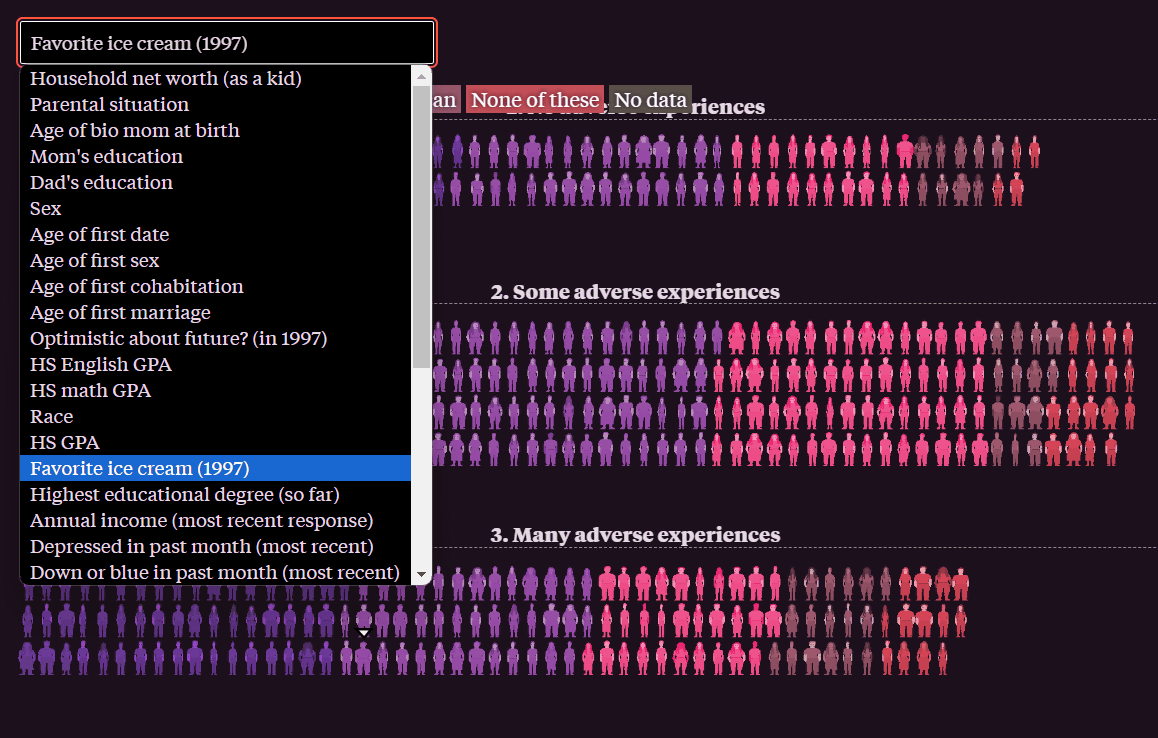
At the end of the page, you can view all the data using the drop-down menu. Click on the top left.
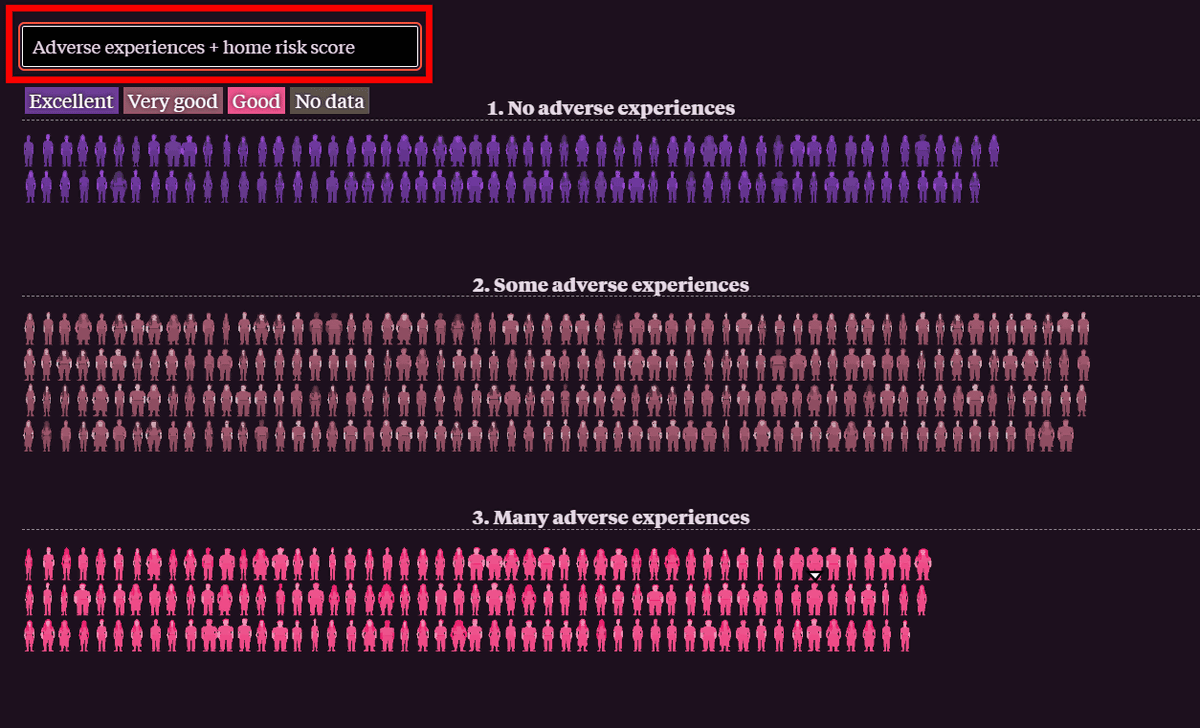
In addition to being able to review the data you have seen so far, you can also look at questions used in the survey, such as 'Favorite ice cream flavor,' according to groups of 'No adverse experiences,' 'Some adverse experiences,' and 'Many adverse experiences.'
Similar tracking and commentary is also shown in the movie.
This is a teenager. Let's track hundreds of teens into adulthood using this huge dataset. - YouTube
Related Posts:


in Web Service, Video, Posted by log1e_dh