What exactly is the ``EPSS model'' that scores ``which vulnerabilities should be prioritized?''
In software, vulnerabilities are design errors that make the system unsafe. Bugs are common in software development, and many vulnerabilities are discovered every month, making it difficult to respond to all vulnerabilities. Under such circumstances, the EPSS model was devised as a method for prioritizing vulnerability response.
The EPSS Model
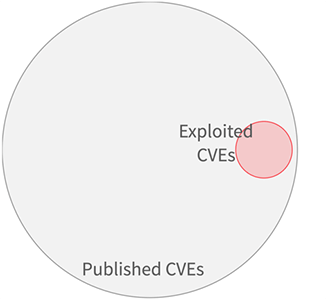
Only 2% to 7% of publicly available vulnerability information (CVE) is actually exploited.
The EPSS model calculates the 'likelihood that a vulnerability will be exploited' by combining vulnerability information and evidence of actual exploitation. Specifically, the following data is used.
・CVEs that are public on MITER's CVE list
Text-based “tags” extracted from CVE descriptions and other vulnerability information sources
・Number of days since CVE was published
・Number of references listed in CVE
・Exploit code demonstrating a vulnerability published on Metasploit, ExploitDB, or Github
・Security scanners such as 'Jaales', 'Intrigue', 'Nuclei', 'sn1per' etc.
・CVSS v3 vector of basic score published in National Vulnerability Database (NVD)
・Vendor (CPE) information published in NVD
・Observation of actual attacks by AlienVault and Fortinet
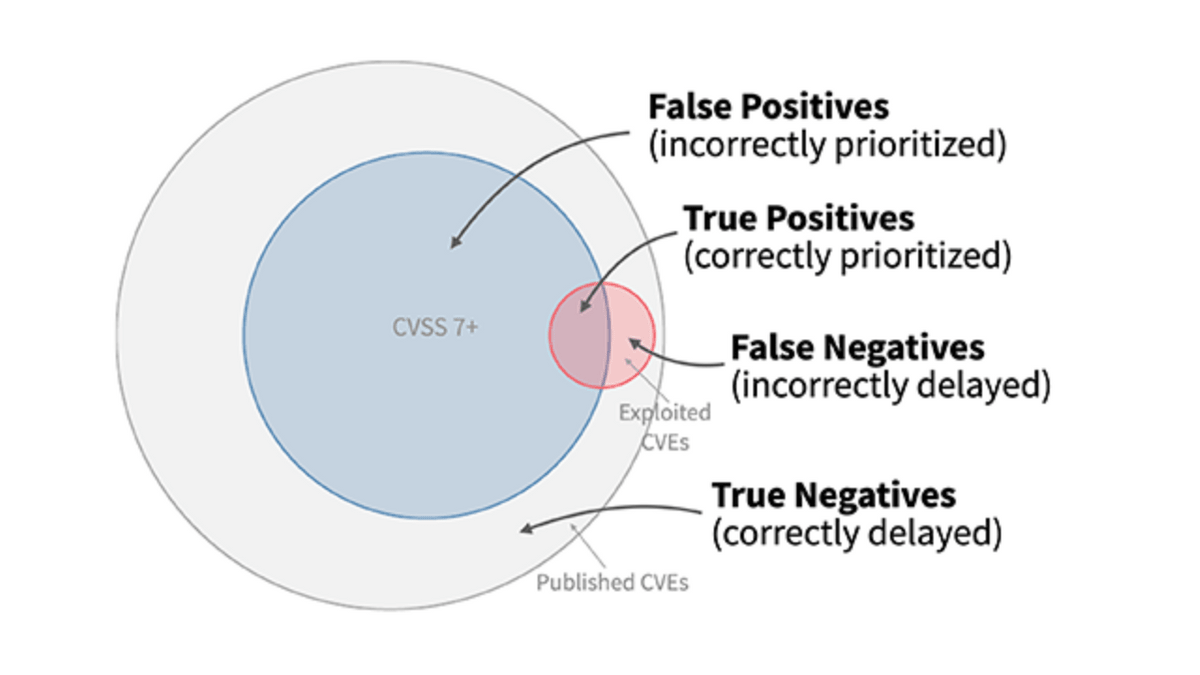
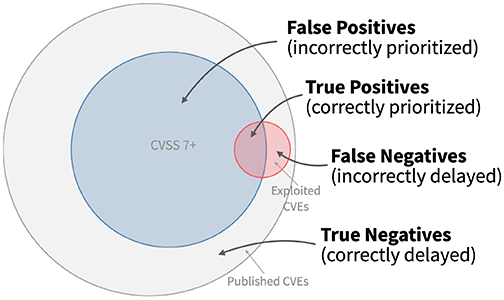
Model performance can be measured in two ways: efficiency and coverage. For example, as shown in the image below, if the corrected range is displayed in blue and the range where the attack actually occurred is displayed in red, 'efficiency' is the percentage of the range that overlaps with the red part of the blue part. On the other hand, 'coverage rate' is the percentage of the red part that overlaps with the blue part.
The calculation formula is as follows.
・Efficiency = True Positives/{True Positives + False Positives}
・Coverage rate = True Positives/{True Positives + False Negatives}
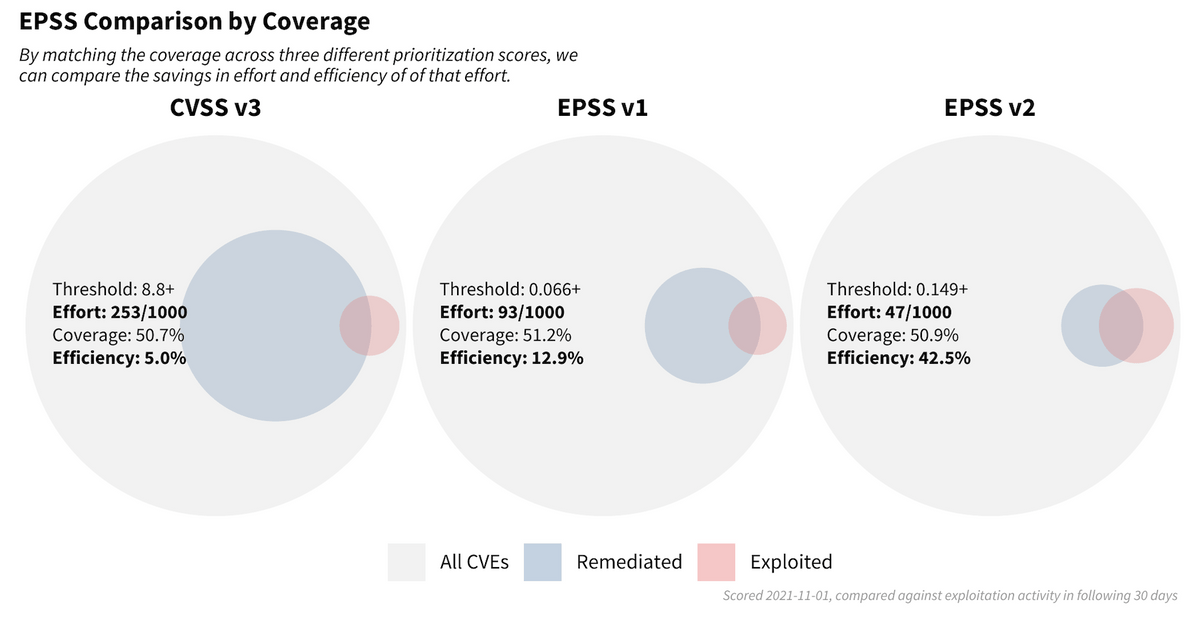
The figure below shows the results of comparing the performance of EPSS models based on two indicators: 'efficiency' and 'coverage rate.' When fixing vulnerabilities with a CVSS v3 base score of 8.8 or higher, the coverage rate was approximately 50% and the efficiency was approximately 5%. When correcting the coverage based on the EPSS score so that the coverage ratio is the same, the efficiency is 12.9% for EPSS v1 and 42.5% for EPSS v2, which shows that the prediction accuracy is significantly improved. .
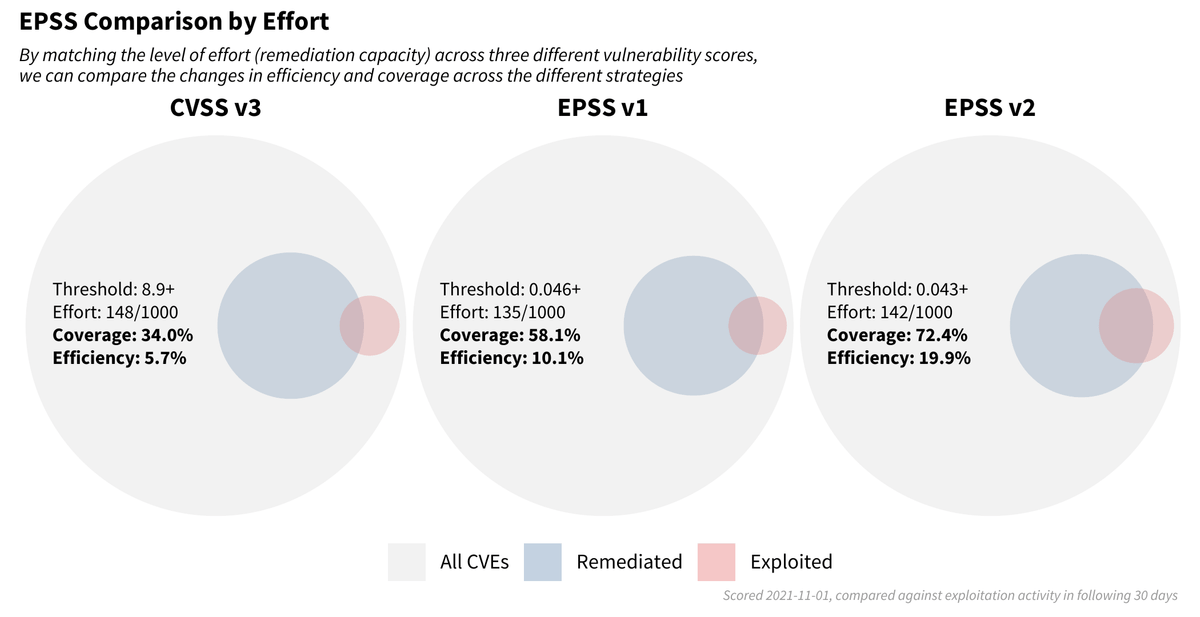
In the above comparison, we changed the range of vulnerabilities to be fixed so that the coverage rates matched, but if we fixed the range of vulnerabilities to be fixed, the comparison would be as shown in the figure below. When corrected based on CVSS v3, the coverage rate is 34% and the efficiency is 5.7%, but when EPSS v1 is used, the coverage rate increases to 58.1% and the efficiency is 10.1%, and with EPSS v2, the accuracy is even higher with a coverage rate of 72.4% and efficiency of 19.9%. You can see that it's improving.
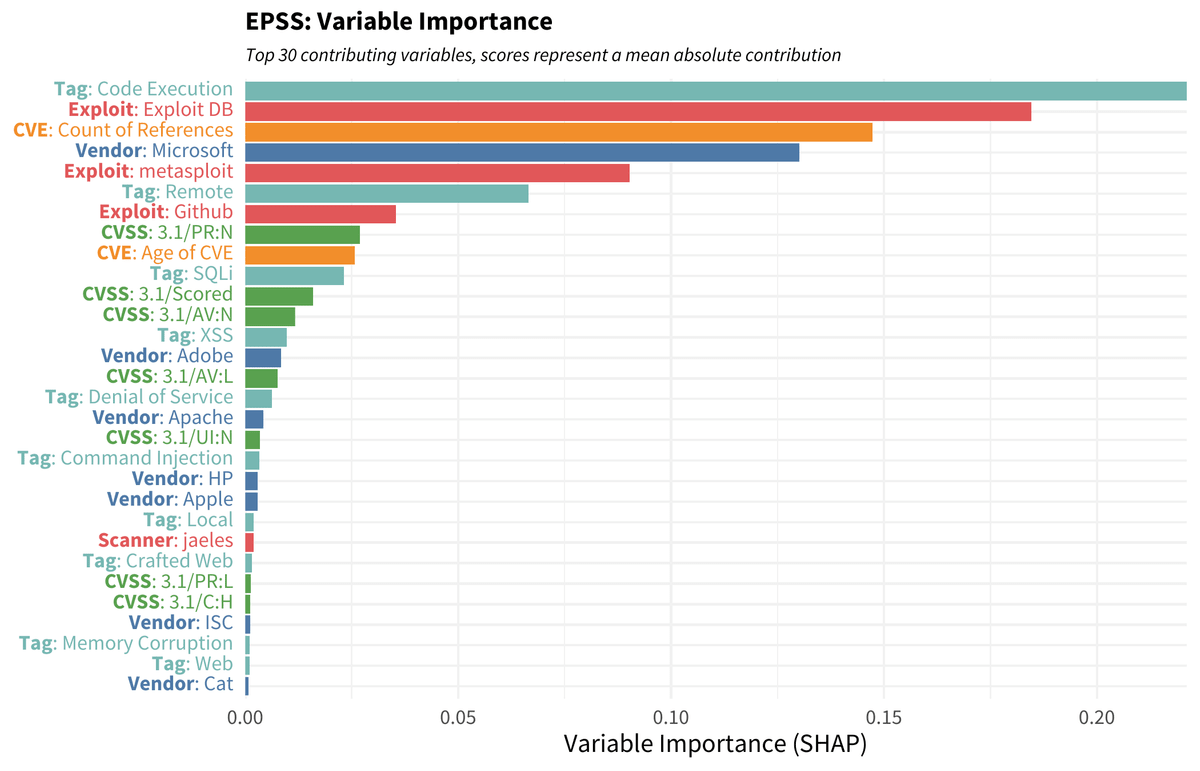
The contribution of the variables in the model was examined using the Shapley value , and the results were sorted in descending order of median value, as shown in the figure below. The higher the number of elements ranked in a vulnerability, the more likely it is to be exploited. For example, if the demonstration code for a vulnerability that allows unauthorized remote code execution in a Microsoft product is published and easily used, there is a high possibility that the vulnerability will be exploited.
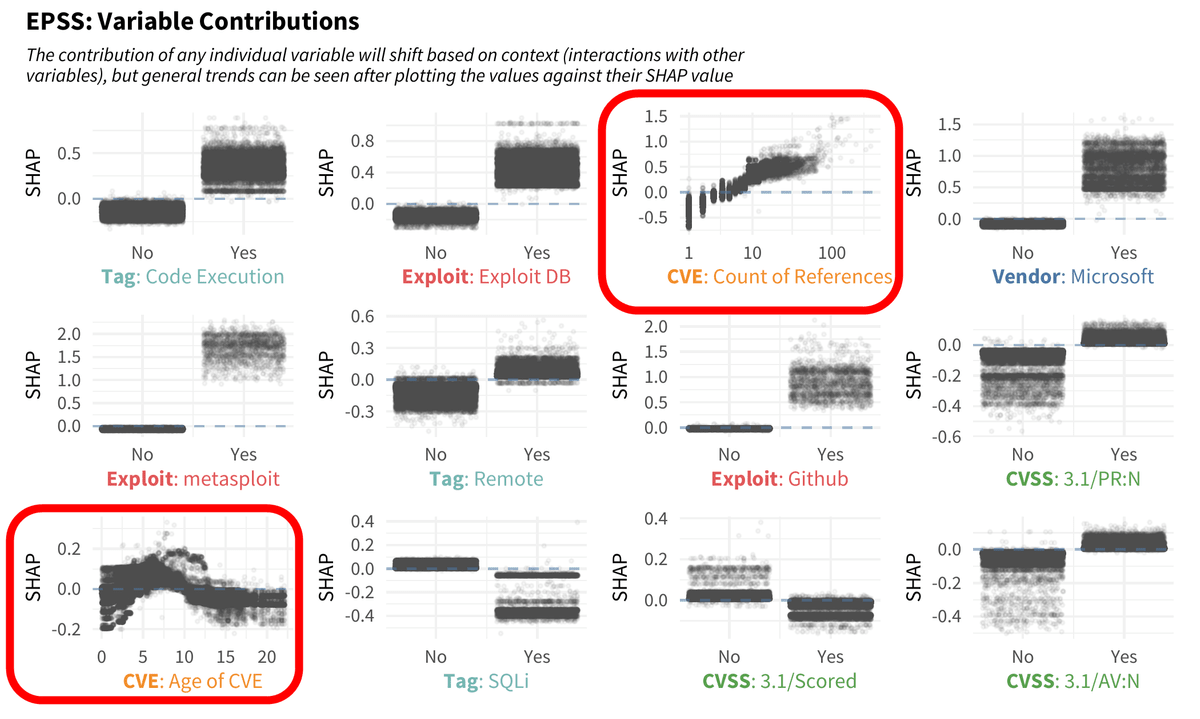
The contribution of each variable in the model is shown in the figure below. We have confirmed that vulnerabilities referenced by many CVEs have an increased risk of being exploited, and that exploitation peaks 6 to 7 years after a CVE is issued, and activity declines thereafter. Masu.
If you cannot devote sufficient resources to dealing with vulnerabilities, you can effectively protect your system by using EPSS. In addition, to use EPSS, you can download a daily updated CSV containing all CVE data , or obtain the data via API .
Related Posts: