I tried using the React library 'Tremor' that can make a nice UI quickly
Aside from Superman, who has both programming ability and UI design ability, general developers should have experienced designing UI when developing web applications. Of course, there are various UI libraries in the world to meet such demand, but this time there was a big update to the UI library for React called ' Tremor ', so what kind of UI is actually used? I tried to see if it works.
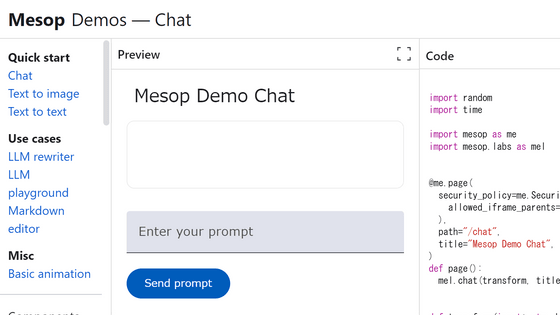
Tremor – The React library to build dashboards fast
You need to install node.js to use Tremor. From the URL below, select the installation method that matches your environment.
Installing Node.js using a package manager | Node.js
https://nodejs.org/en/download/package-manager
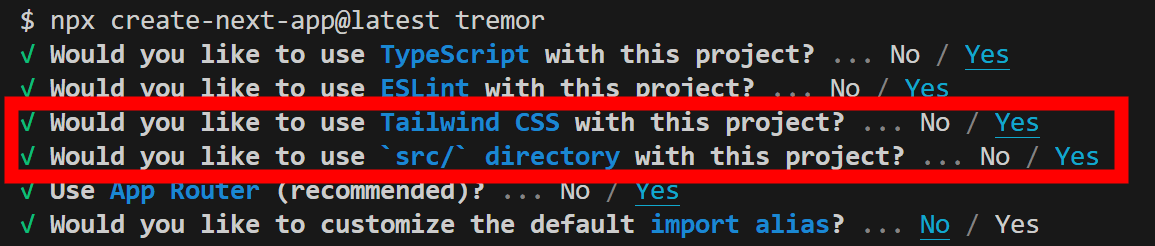
First, create a Next.js app using 'create-next-app'. It is OK if you execute 'npx create-next-app@latest app name' in the shell. This time, I named it 'tremor' to make it easier to understand. In the app settings, enter 'Yes' to the 'Tailwind CSS' and '`src/` directory' questions.
After creating the app, install tremor with the following command.
[code]cd tremor
npx @tremor/cli@latest init[/code]
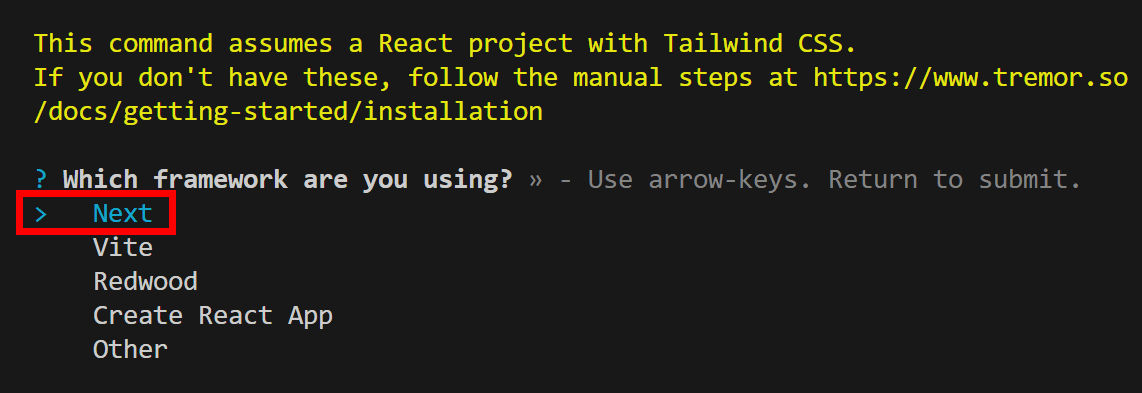
You will be asked about the framework of the application, so answer 'Next'. There seems to be other options such as 'Vite', 'Redwood', and 'Create React App'.
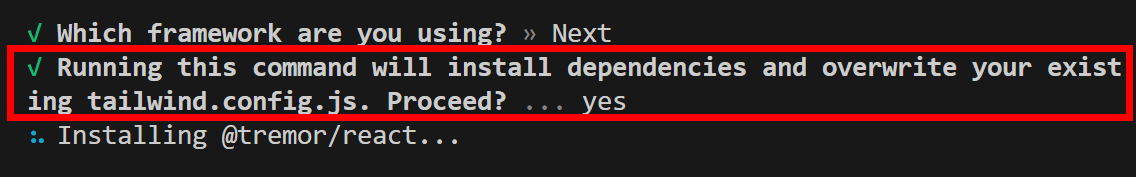
A note has been made that existing Tailwind CSS settings will be overridden. This time there is no problem, so I answered 'yes'.
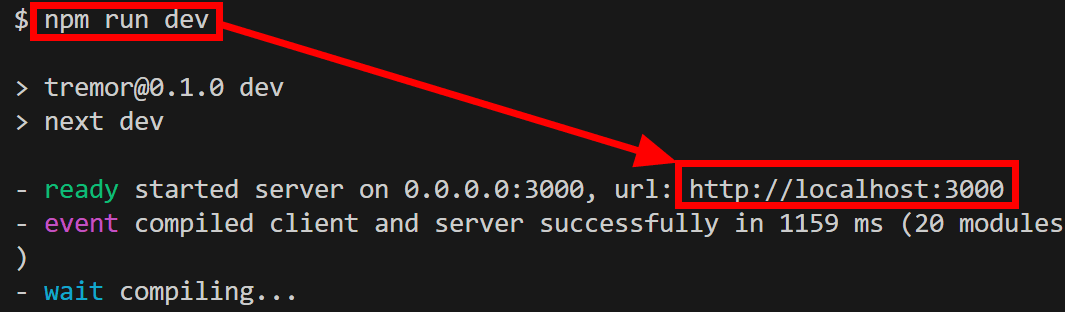
After installation, start the server by typing 'npm run dev' and access the displayed URL in your browser.
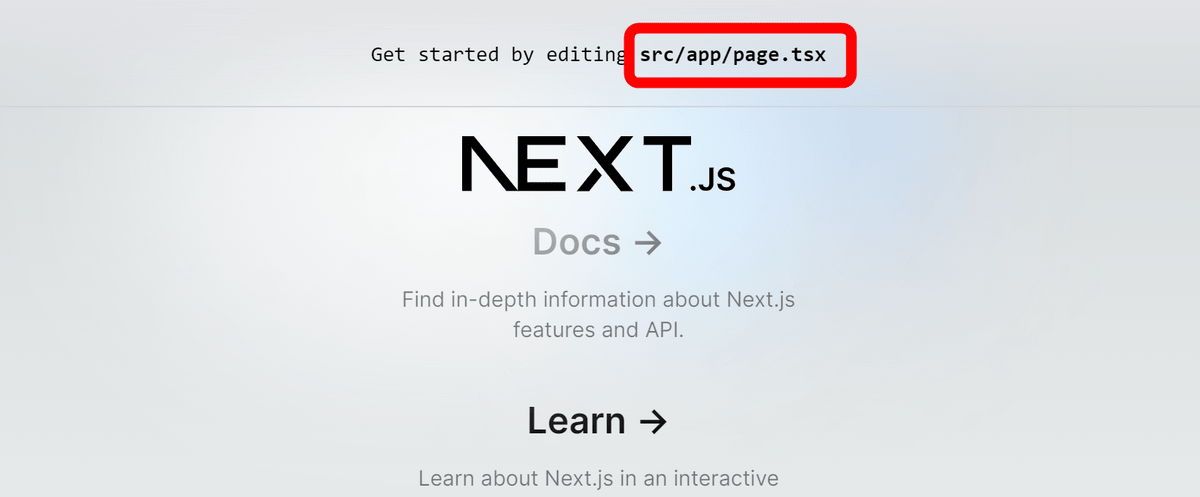
The initial screen of Next.js has opened. As you can see above, changing 'src/app/page.tsx' will change this screen.
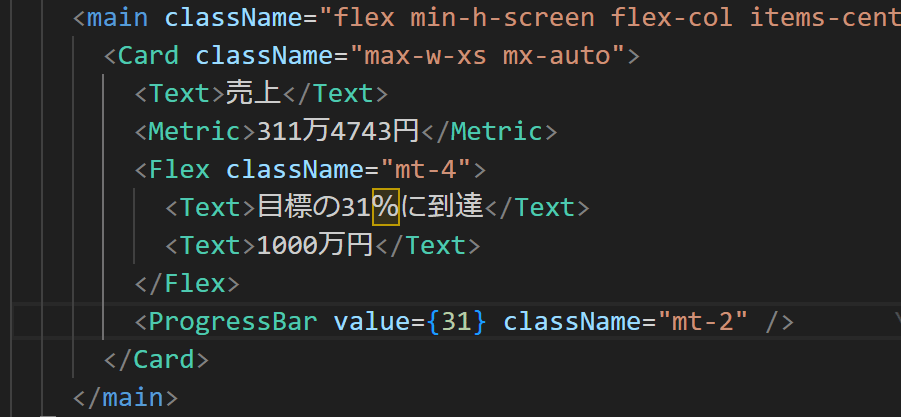
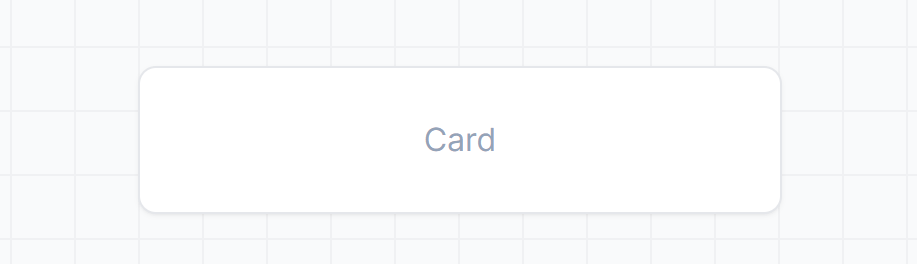
Now open 'src/app/page.tsx' and rewrite it to display only Tremor's 'Card' component.
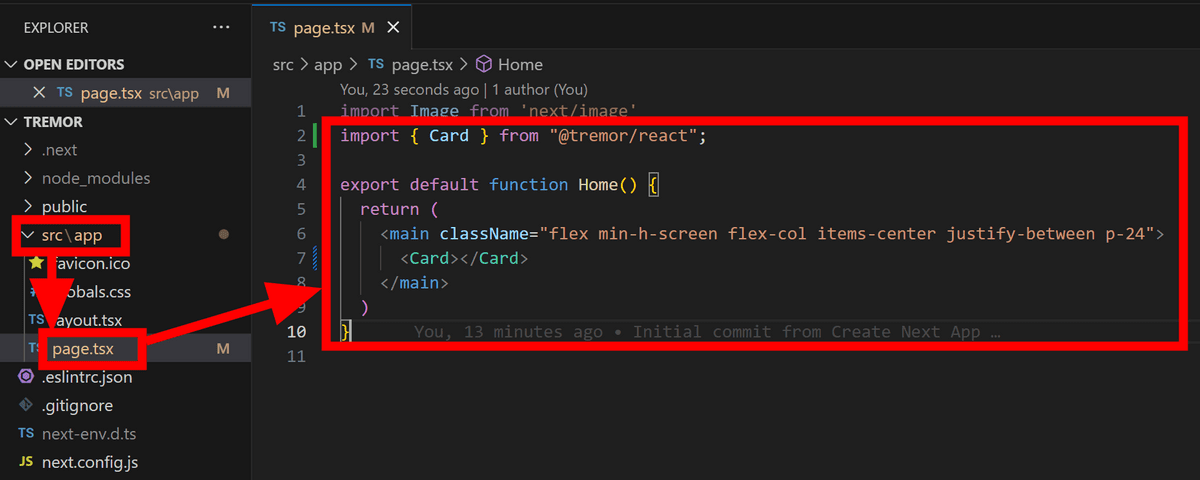
Then the browser display was automatically updated and the card was displayed. Nothing inside yet.

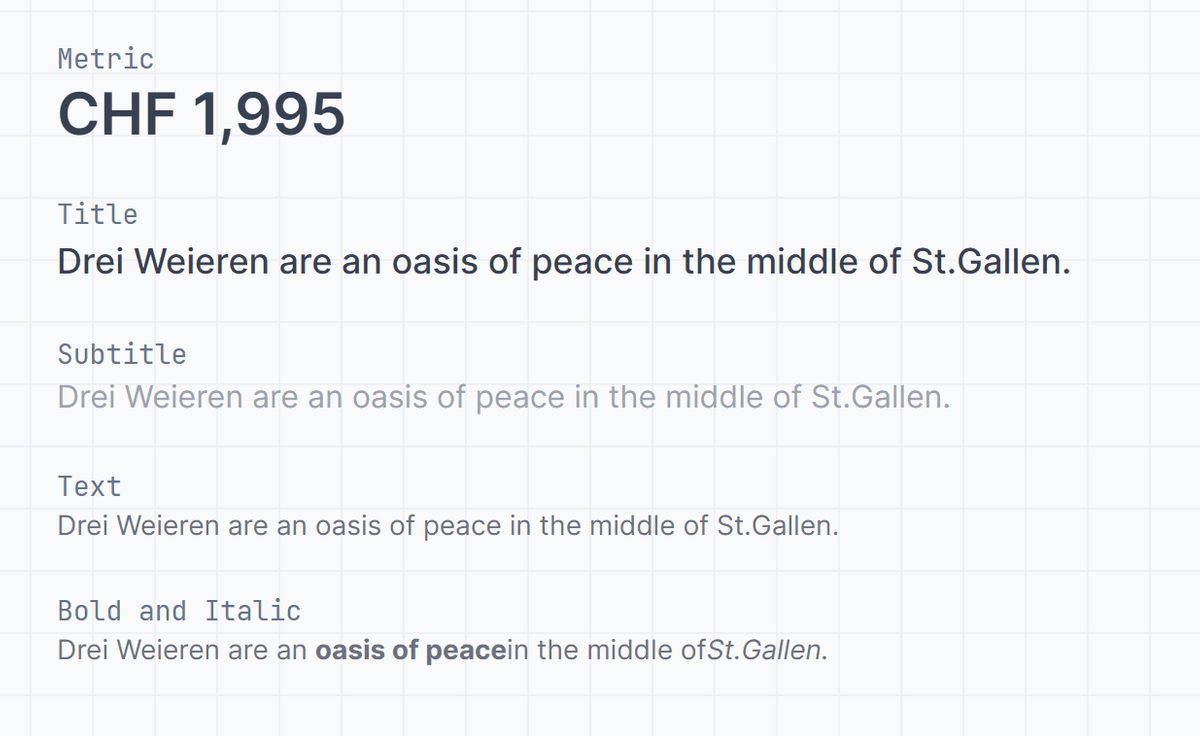
Let's put the 'Text' and 'Metric' components inside the card.
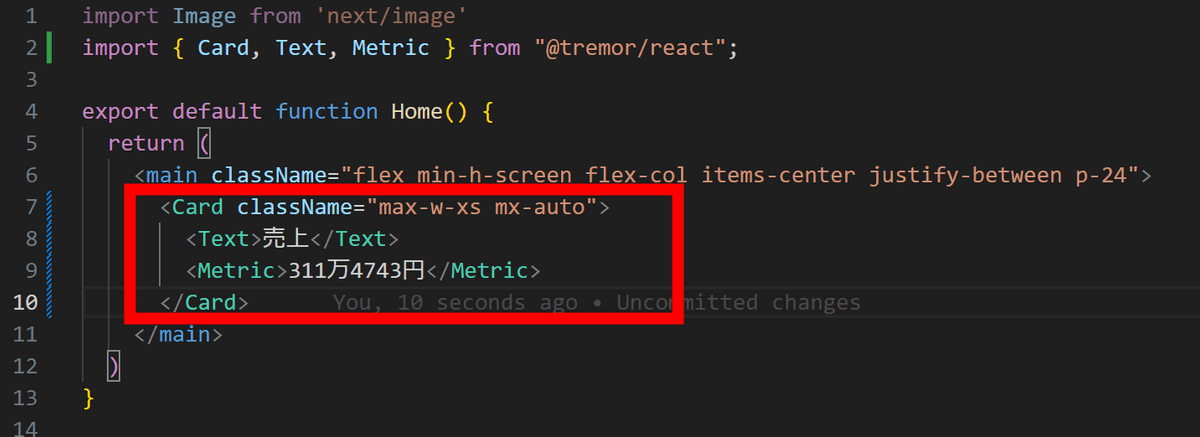
This is the only thing that makes me feel like it.

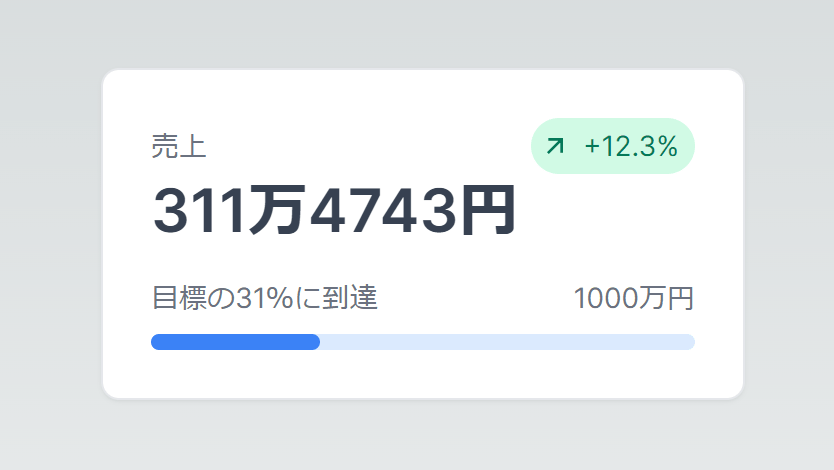
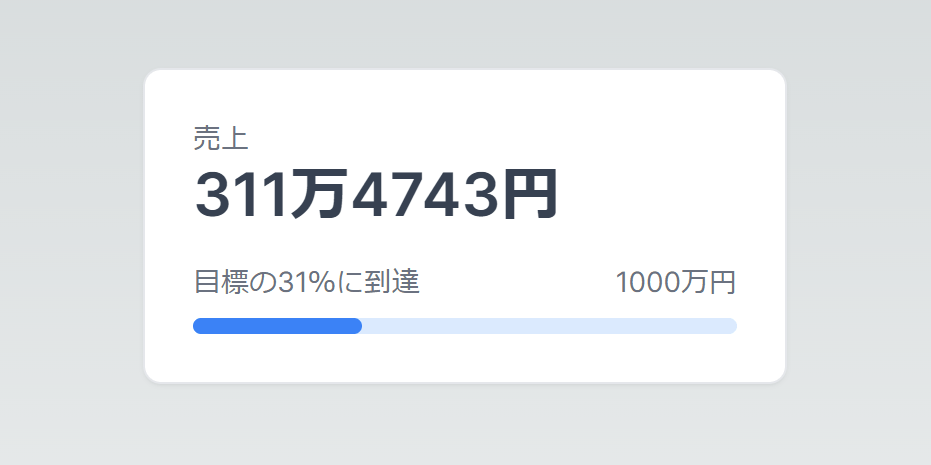
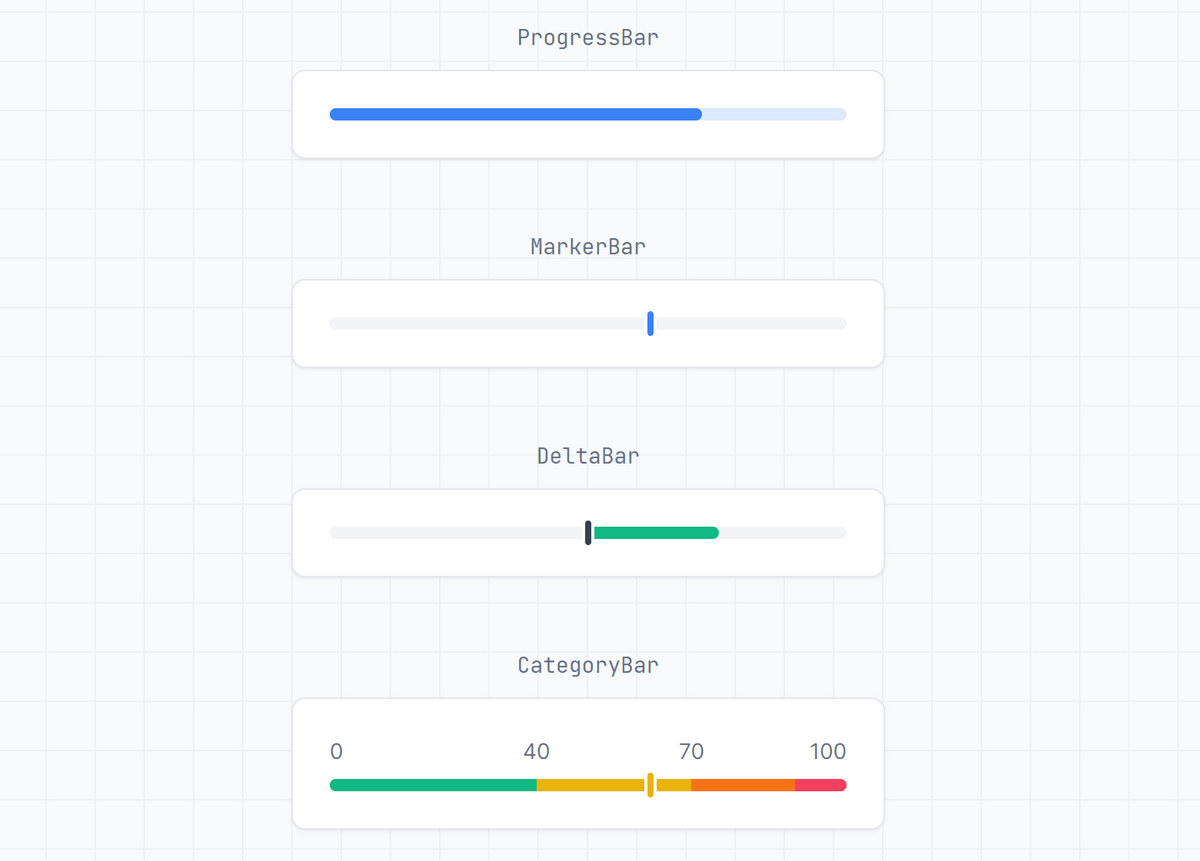
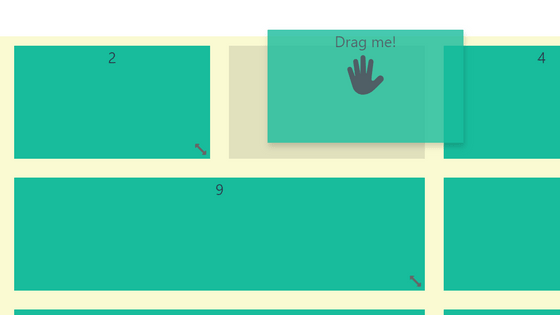
I also added text and a progress bar.
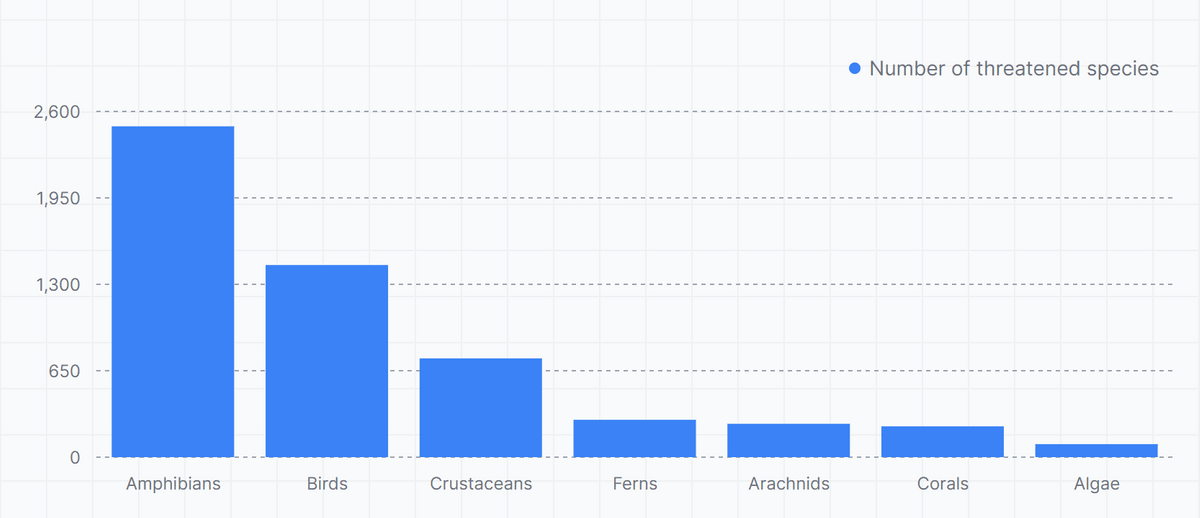
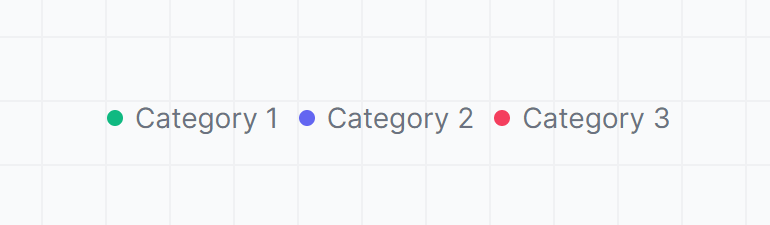
There are many components for such graphs.
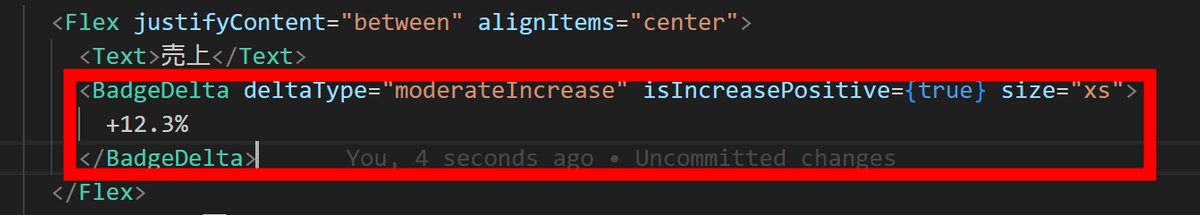
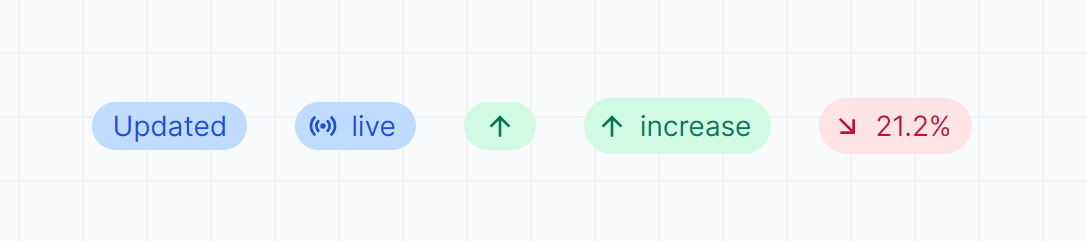
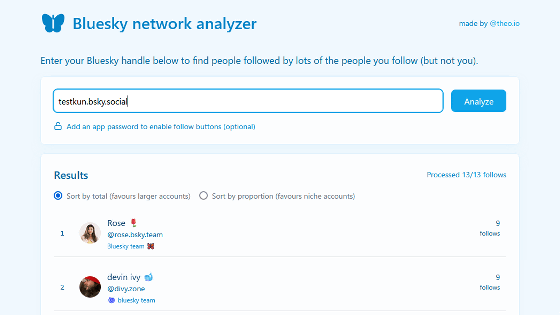
In addition, let's set the badge to be attached to the card.
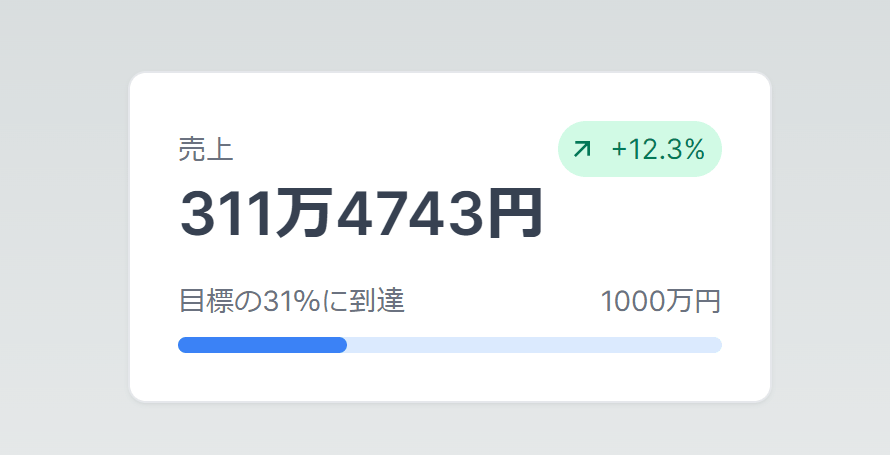
It turned out to be something like this. I was able to build a pretty nice UI almost instantly. There are quite a few components for the items displayed on the dashboard, so if you are interested, please check
◆ Components prepared at the time of article creation
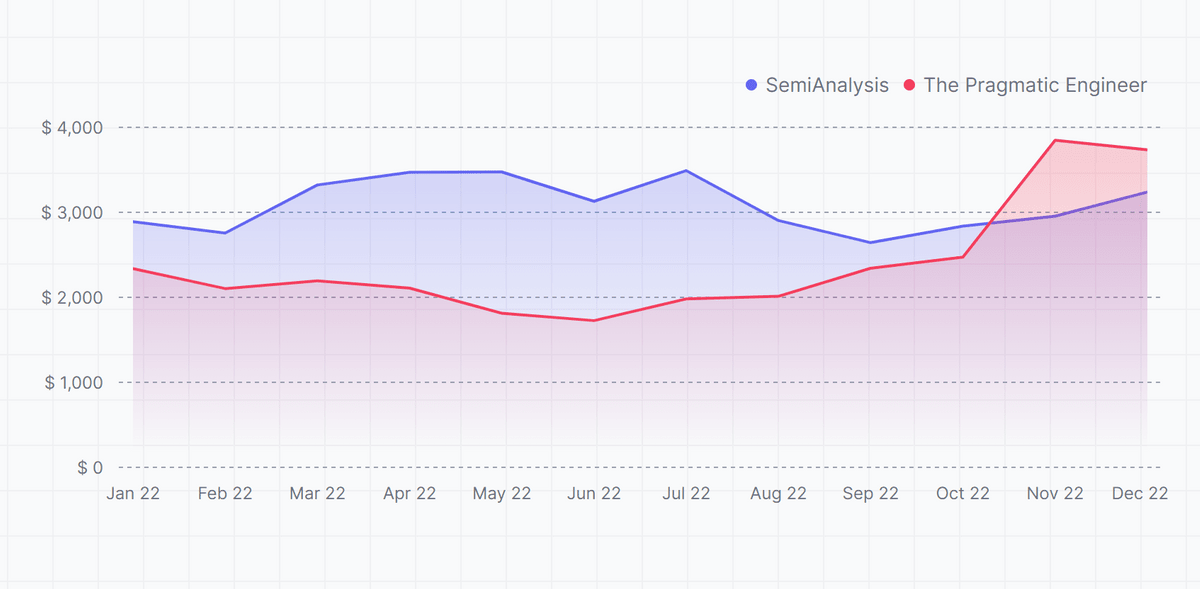
・Area chart
·bar graph
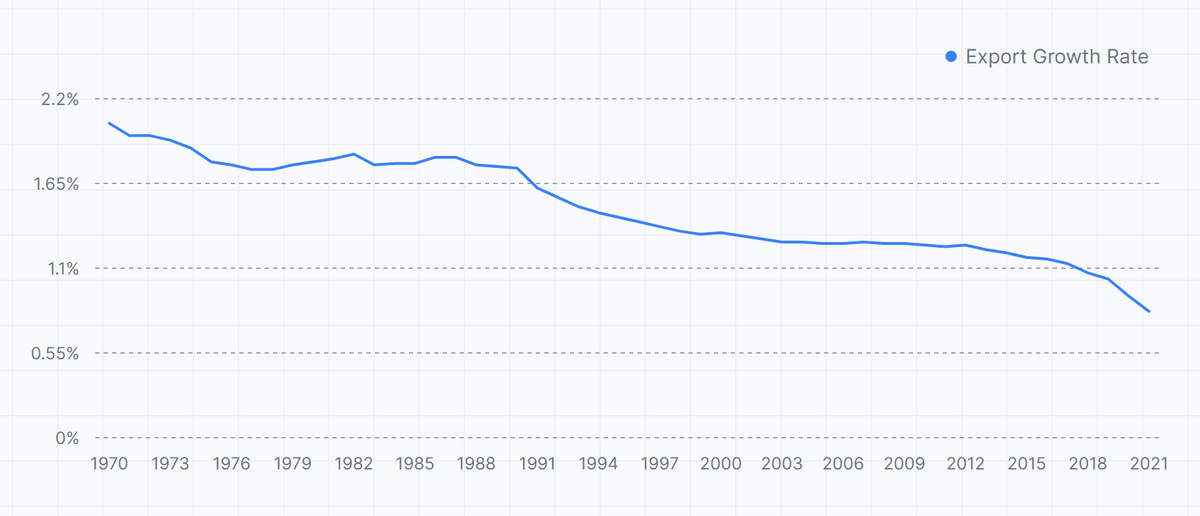
·line graph
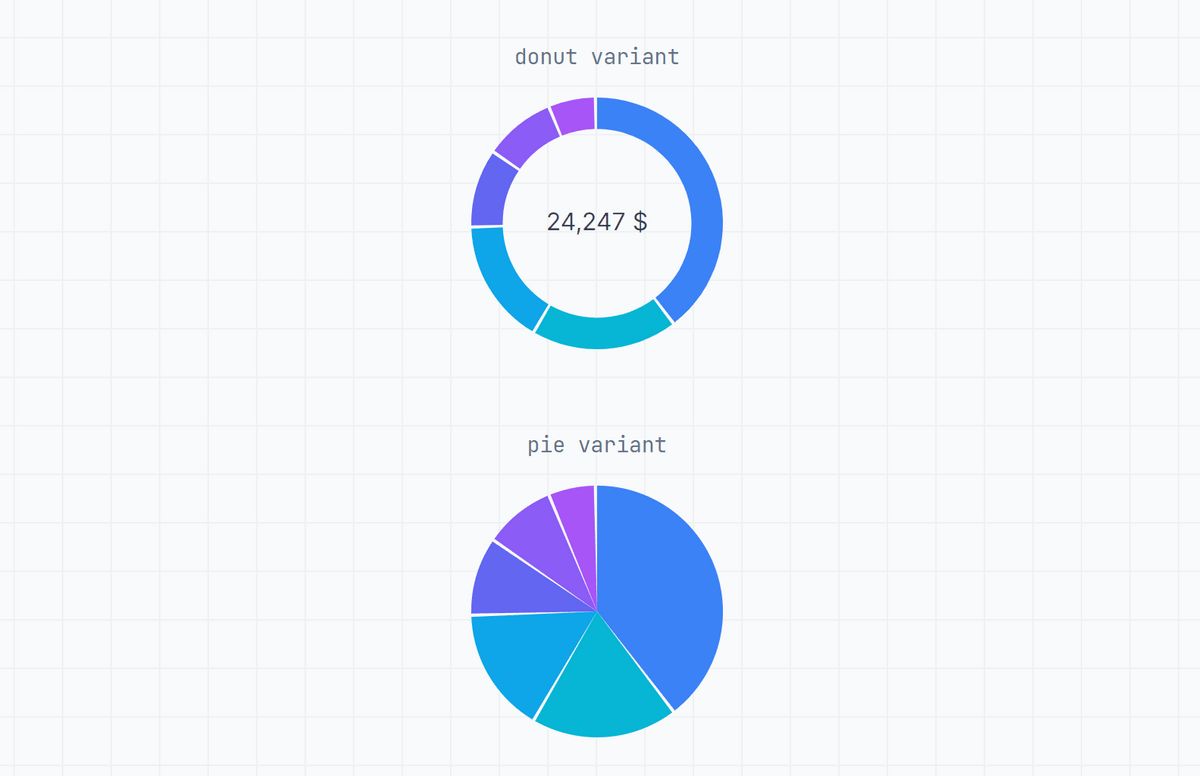
·pie chart
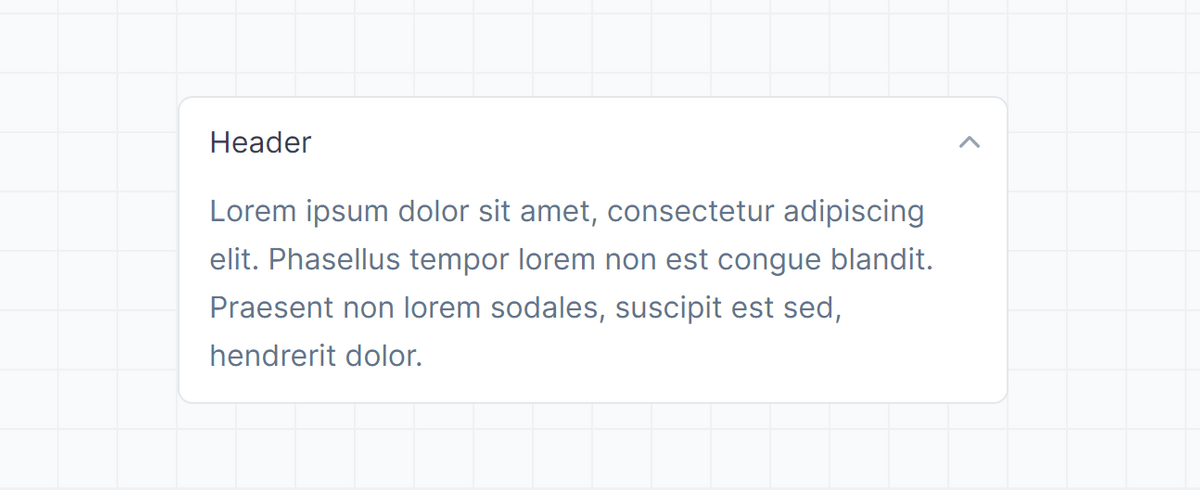
·accordion
·badge
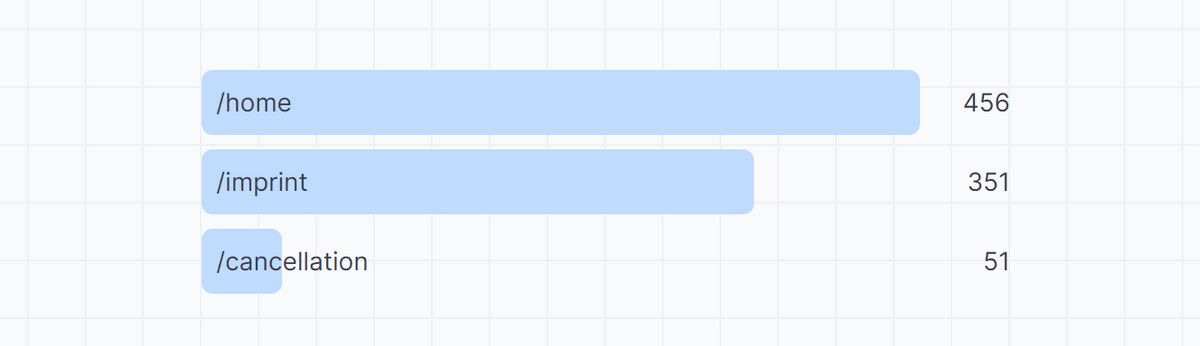
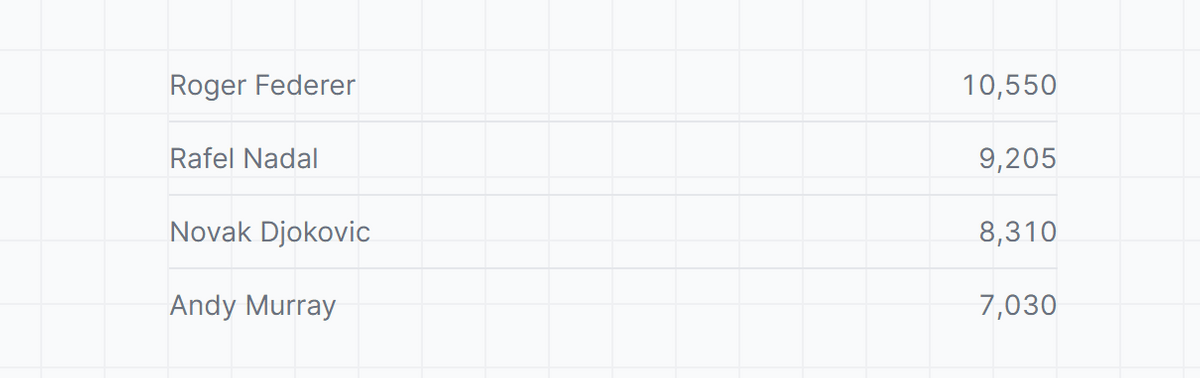
・Bar List
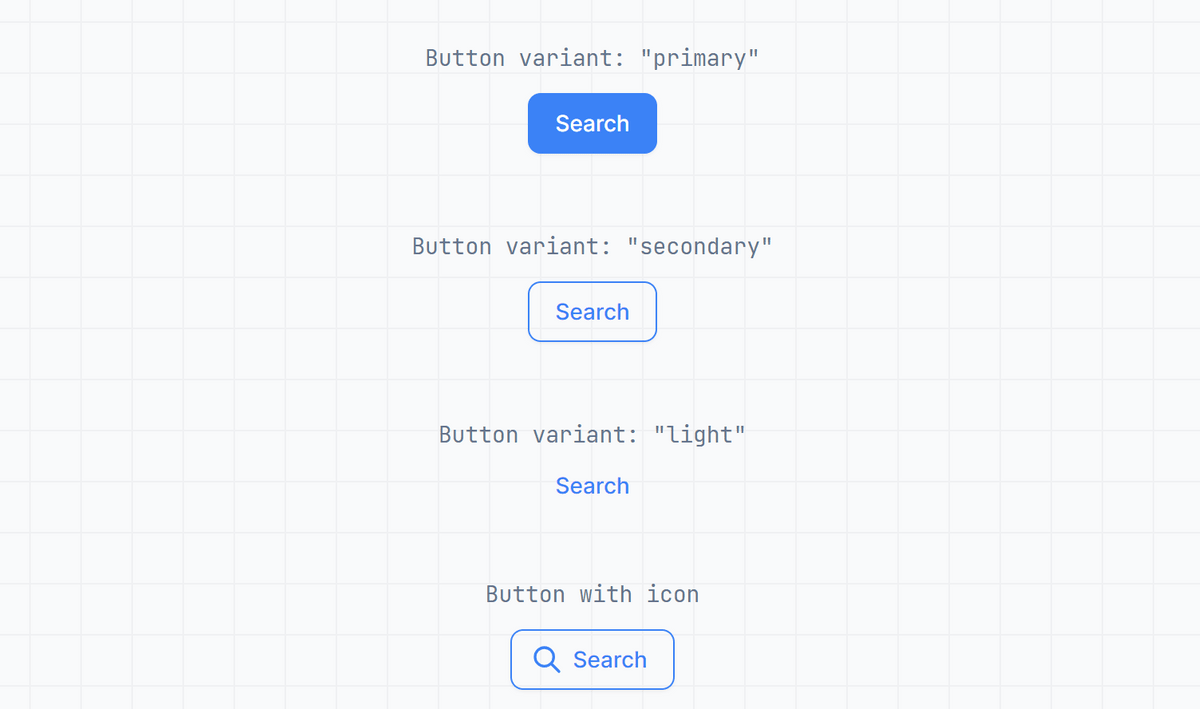
·button
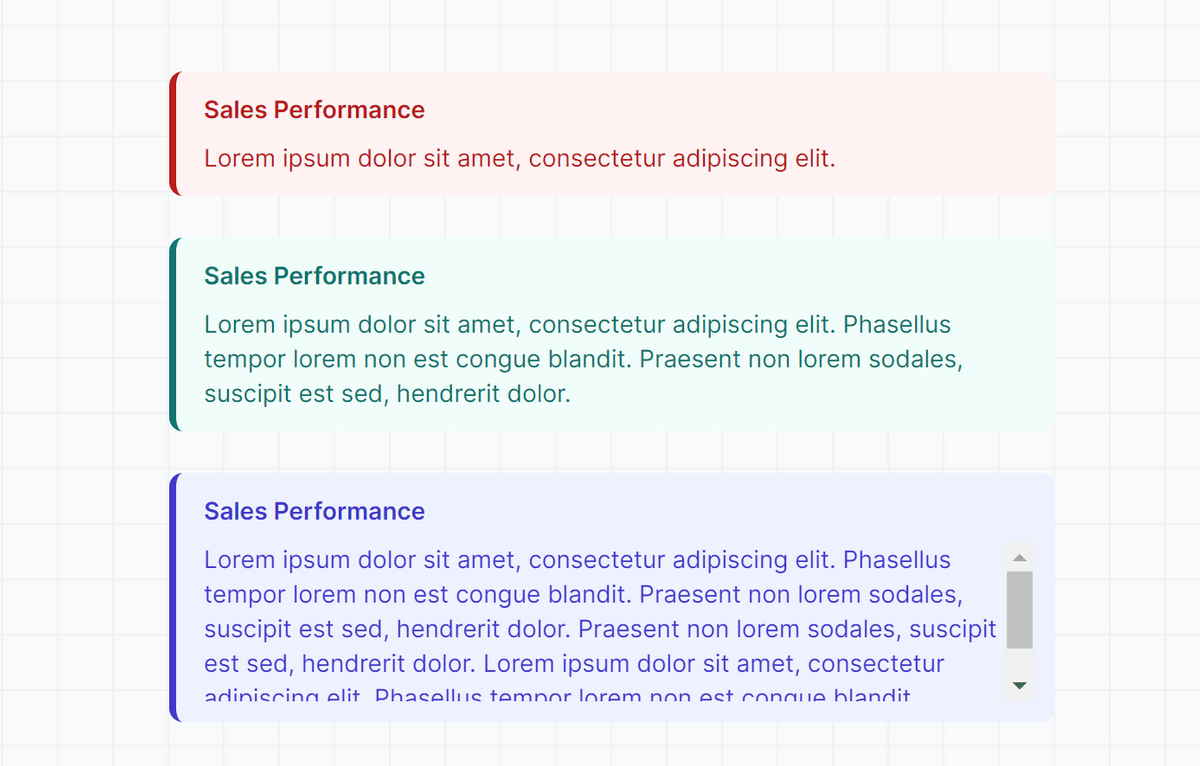
・Callouts
·card
・Data bar
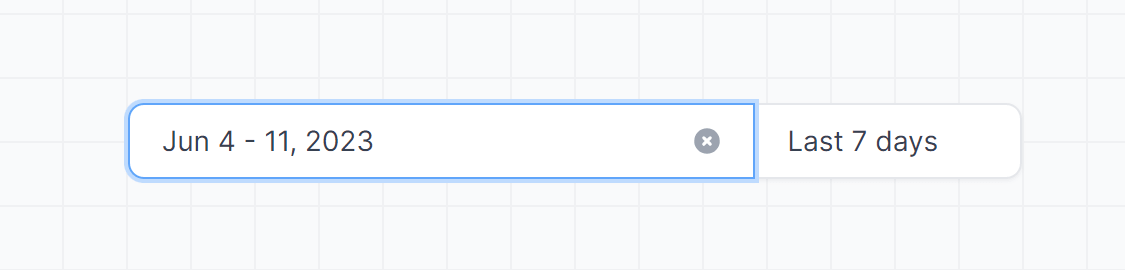
・Date picker
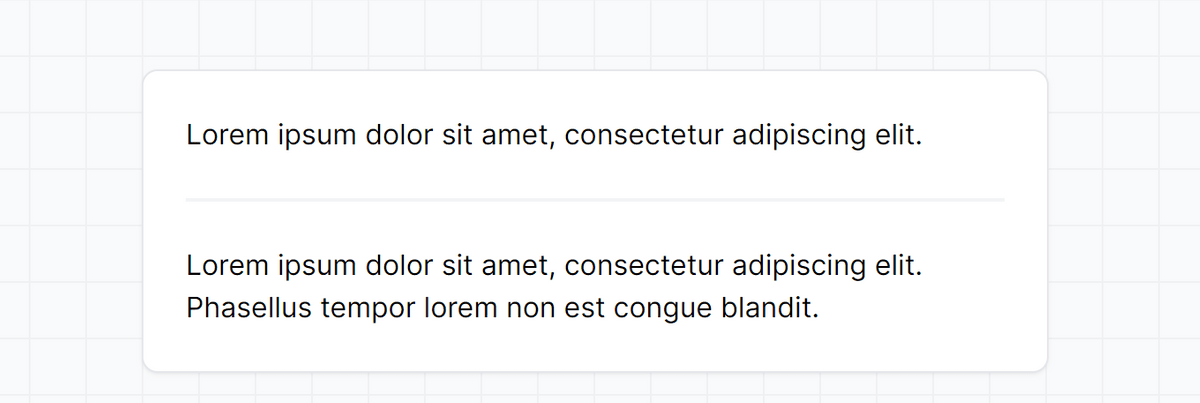
・ Kei line
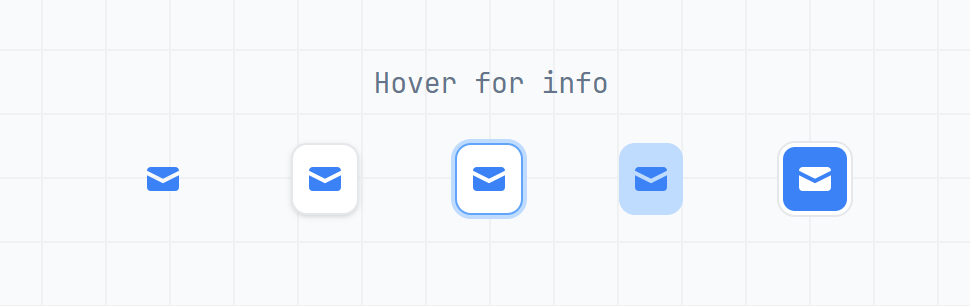
·icon
·Usage Guide
·list
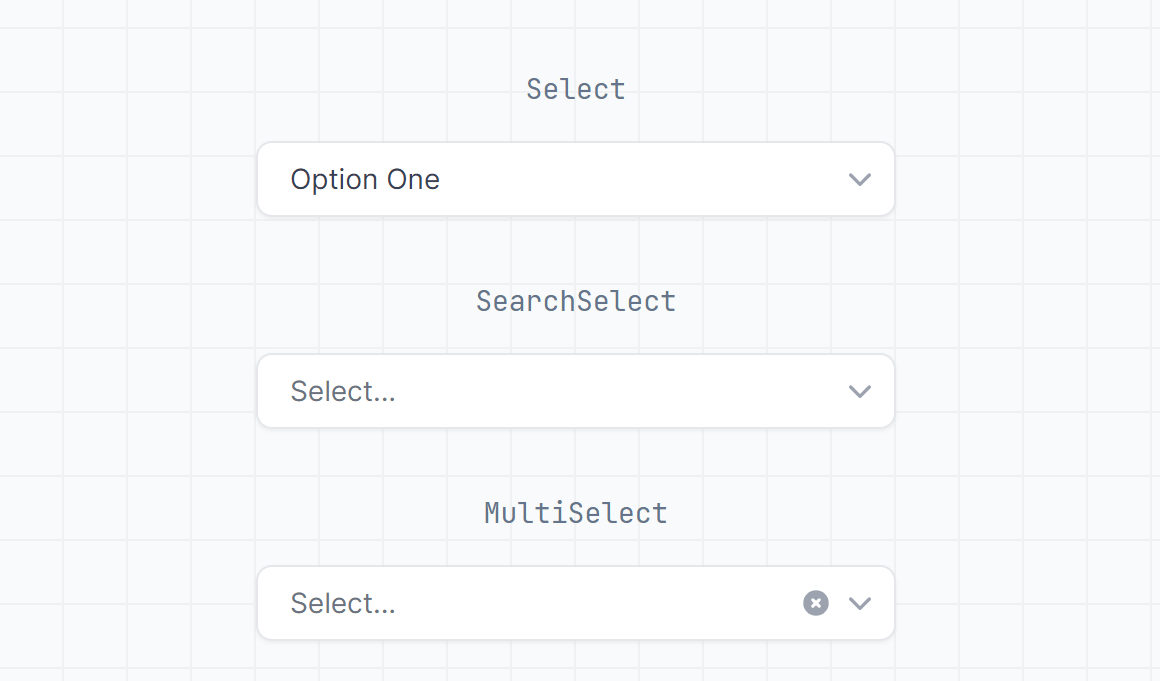
·Selection
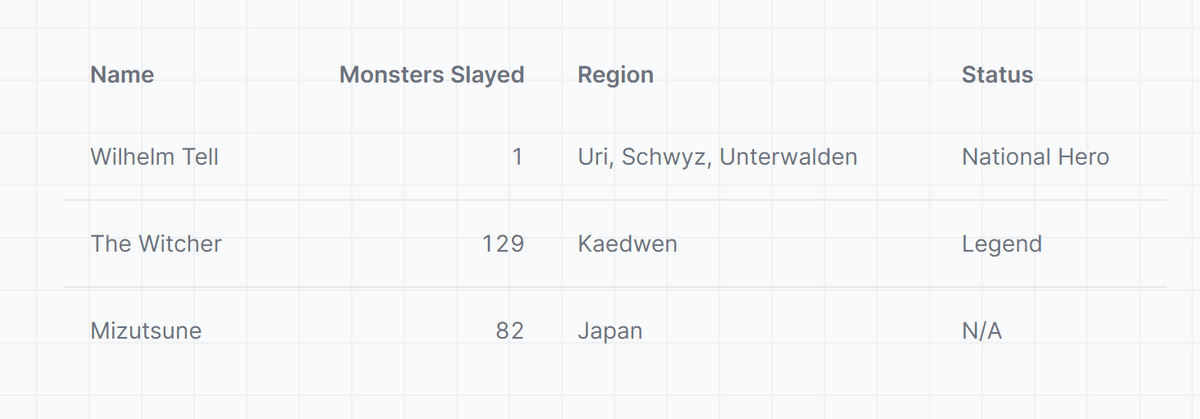
·table
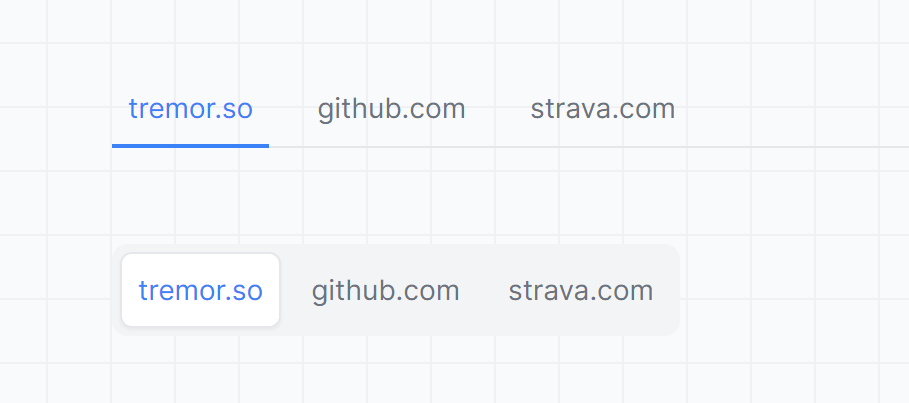
·tab
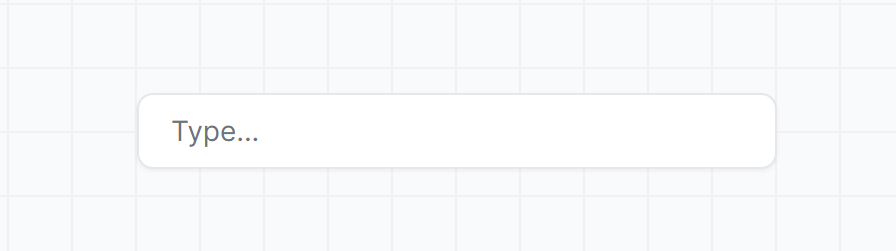
・Text input
·text
・Tracker

Related Posts:
in Review, Software, Web Application, Posted by log1d_ts