Renewable energy is at a level that can meet ``almost 100% electricity demand''
Researchers such as
A near 100 per cent renewables grid is well within reach, and with little storage | RenewEconomy
https://reneweconomy.com.au/a-near-100-per-cent-renewables-grid-is-well-within-reach-and-with-little-storage/
ANU researchers and other research teams are conducting simulations on the construction of power grids using renewable energy. It differs from other simulations in two respects. In this simulation, it seems that real-time changing power demand is simulated based on the power-related data published by OpenNEM , which summarizes the public data of the power market.
It is assumed that wind power generation, solar power generation (individuals), and solar power generation (public works), which are the basis of renewable energy, will meet 60%, 25%, and 20% of the total power demand in one year, respectively. It has been. It is calculated based on how well each generation met the electricity demand over the past seven days. The proportions total over 100% because in an optimized model of a renewable energy grid it is important to have a large amount of excess generation. The reason for this is that rather than assuming that there will be a power shortage for several months, it is better to create a power generation plan assuming that there will be a certain amount of excess power generated each month, and to review the amount of power generated according to the excess or deficiency of power generation. It seems that it is because it is excellent. In the simulation built by the ANU research team, 18% of excess power generation occurs annually. The ratio of 60% wind and 45% solar is based on a rough optimization experiment, where wind tends to record above-average output in winter and at night, so solar is the only option. It's perfect for complementing.

Further developing this ANU simulation and aiming for even higher levels of renewable energy utilization, Renew Economy is adding existing hydropower and electricity storage to the ANU simulation. However, in the Renew Economy simulation, based on hydroelectric power related data published on OpenNEM, hydroelectric power generation has a power generation capacity of 200 to 6000 MW, weekly power generation exceeds 168 GWh, and annual power generation is Ideally, it will be close to 15,000 GWh, equivalent to about 7.5% of Australia's electricity demand. He also did not set a percentage of the electricity demand that hydro would be responsible for, stating, “Minimize hydro on days when it is not needed, and reduce wind and solar on days when there is a significant shortage of electricity from demand, the amount of power generated will be increased.”
Furthermore, in the Renew Economy simulation, we have prepared other power generation methods assuming that none of the wind power, solar power, storage, and hydropower could meet the power demand. In addition, although this 'other power generation' may use power generation using renewable fuels such as biofuels, it is not considered power generation using renewable energy in this simulation.
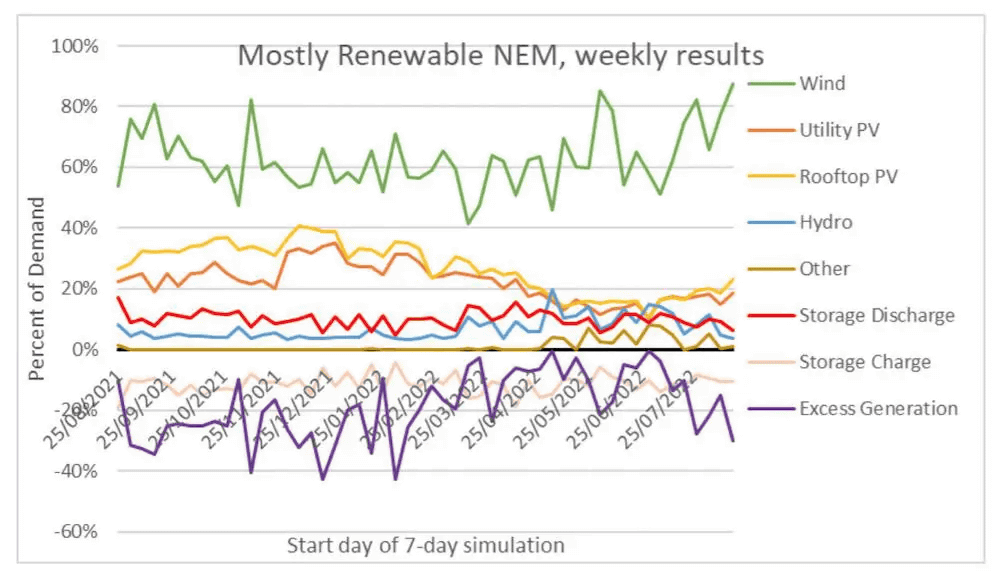
After 52 weeks of simulating how much renewable energy can meet the actual power demand, it was found that 98.8% of the power demand can be finally met with renewable energy. The graph below summarizes the results of simulating how much renewable energy can meet the power demand for one week.
The black line in the upper graph is the power demand, the yellow-green area is the amount of power generated by wind, the yellow is the amount of power generated by solar power, the light blue is the amount of power generated by hydropower, and the red is the amount of stored and used excess power. Brown represents electricity covered by other generation methods. The graph at the bottom shows the amount of stored power generated in excess. is.

Renew Economy simulations show that 98.8% of annual electricity demand could be met with renewable energy. The remaining 1.2% is covered by other power generation. Other generation peaked on the night of July 12, averaging just 4.3% capacity factor for the year. Demand for hydroelectric power is also at a very low level of 6.9%, which is below both the initial forecast of 7.5% and the actual utilization rate of hydroelectric power in Australia of 8%. In addition, 17% of total wind and solar power generation is generated in excess of demand and 11% is stored. The stored electricity was used to meet 10% of the electricity demand. Furthermore, 82% of the electricity demand is directly supplied by wind power and solar power without using storage batteries.
The graph below shows which power generation method met the power demand in a simulation over 52 weeks (12 months). Wind power generation (Wind) is responsible for the largest amount of power generation, and about 60 to 80% of electricity is always covered by wind power generation. Solar power generation (individuals: Rooftop PV) and solar power generation (public works: Utility PV) are second, followed by 'Hydro'.
The graph below shows how other power generation methods met the power demand in the past 52 weeks. For almost seven months from September to late March, demand for other generation methods was near zero. However, for most of the week from late April through August, wind, solar, storage and hydro power generation methods were not able to fully meet the weekly electricity demand.
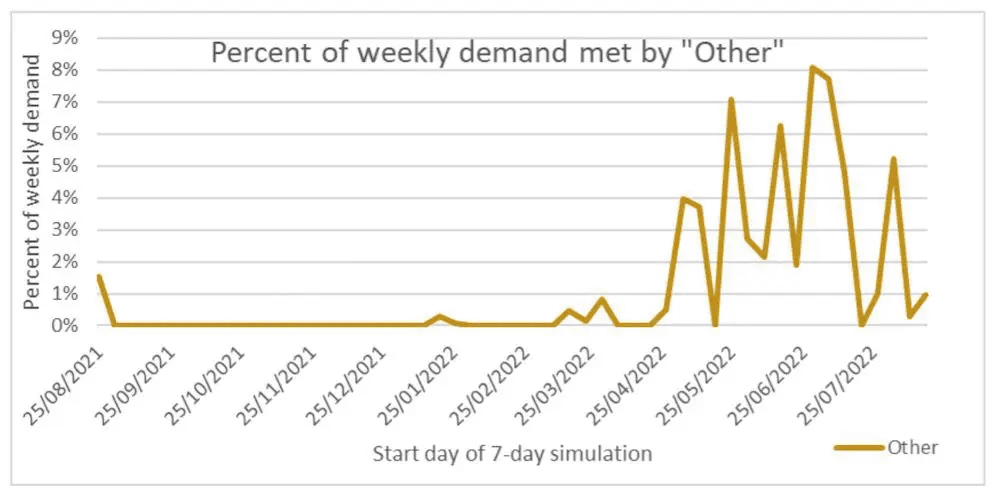
Therefore, the need for power generation methods other than renewable energy has become clear. Renew Economy points out that this clearly shows that in Australia from late autumn to winter, the power grid using renewable energy will have a difficult time. In fact, from late June to early August, photovoltaic power generation drops to about half of the annual average.
In addition, wind power generation tends to be above average during winter, but there are cases where wind power generation is significantly below average for two or three days in a row. As a result, the Renew Economy notes that there is often a demand for power that cannot be completely compensated for by existing hydroelectric power generation, and it is often difficult to meet the power demand with renewable energy alone.
Related Posts:


in Note, Posted by logu_ii