What is the actual difference in military spending between Ukraine, Russia, NATO and the United States?
by
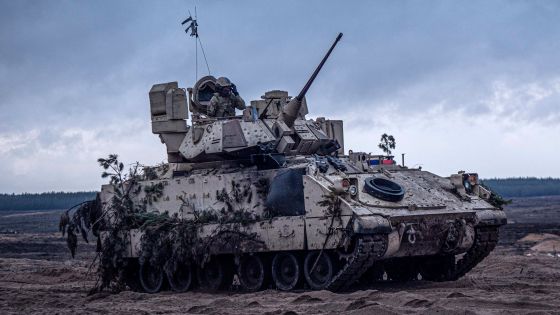
One week has passed since the invasion of Ukraine by the Russian army, which is said to have overwhelming military power, but due to the lower skill and morale of the Russian army than expected and the thorough fighting by the Ukrainian army. At the time of writing the article, the fall of the capital Kiev (Kiev) has been avoided. The economic media, The Economist, reports the actual difference in military spending considering the difference in prices for the Russian army and the Ukrainian army.
The military gap between Russia and Ukraine is vast | The Economist
https://www.economist.com/graphic-detail/2022/02/25/the-military-gap-between-russia-and-ukraine-is-vast
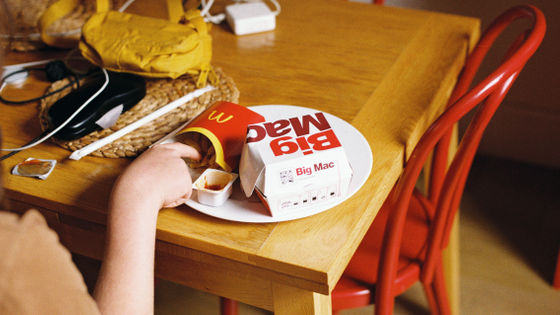
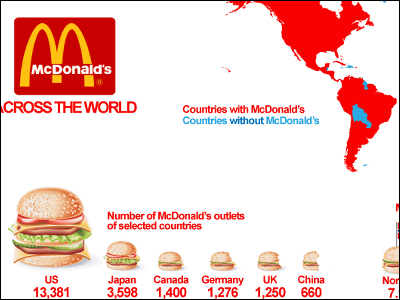
If you use the 'nominal GDP', which is the 'simply sum of the values produced' when comparing the gross domestic product (GDP) of each country, you will be affected by different price levels in each country. To solve this problem, Purchasing Power Parity (PPP) , which determines the value of a currency based on the amount of money when purchasing goods or services of equivalent value rather than the exchange rate (eg, Big Mac is $ 5 in the United States, Japan In the case of 390 yen, a concept called 1 dollar = 78 yen) has appeared, and an index called purchasing power parity GDP with PPP is used to compare economic power between countries.
When comparing military spending, in addition to the above PPP, differences in labor costs such as 'A country gives soldiers $ 100 a day and Country B gives soldiers $ 1000 a day' also have an effect. To do. 'Military purchasing power parity (military PPP) ' is an index devised to compare military spending after considering the differences in price levels and labor costs in each country.
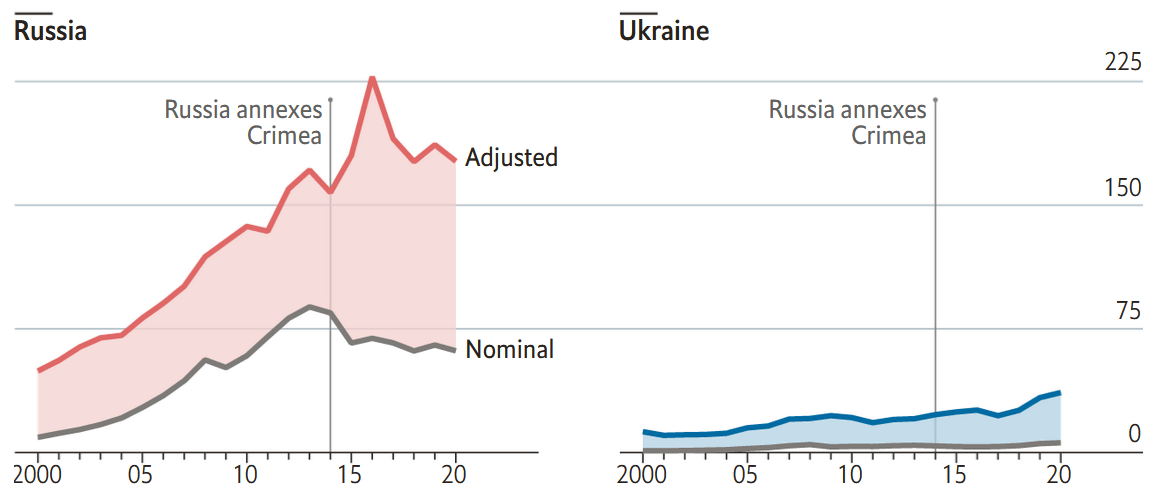
In the figure below, the horizontal axis shows the year and the vertical axis shows the military expenditure (unit: billion dollars), red is the Russian military PPP, blue is the Ukrainian military PPP, and gray is the military expenditure at face value. Represents. When comparing the military spending at face value, Ukraine's military spending is only 9.6% of Russia, but the military PPP of Ukraine is 20.6% of Russia, which is more than the image recalled by looking at the military spending at face value. You can see that the difference in military power is small.
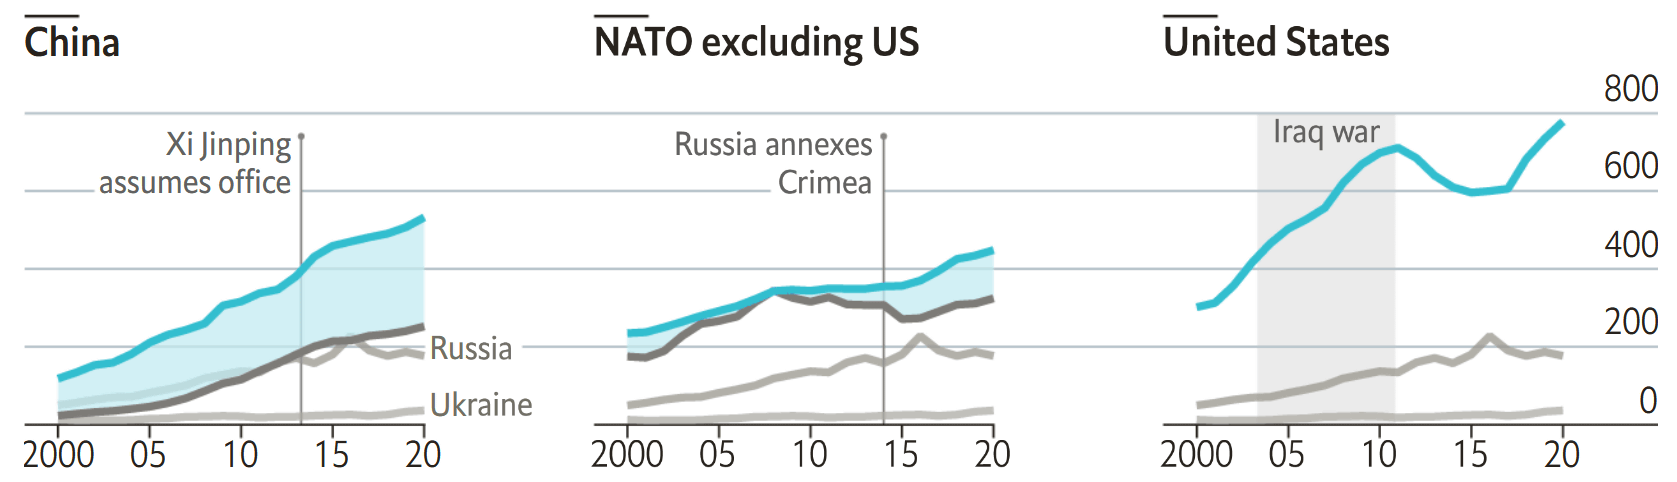
The graph below compares China, NATO (excluding the United States), and the US military PPP (light blue) with Russia and Ukraine in order from the left. Looking at the graph, we can see that NATO's military PPP excluding the United States is higher than Russia, and China and the United States alone are significantly higher than Russia.
The Economist mentioned a comparison of military PPPs, saying, 'Aid from the outside is often provided in kind and difficult to quantify.' 'Some military assets provide value over a long period of time.' 'Nuclear weapons. It states that comparisons by military PPP do not clearly show the difference in military power because some of them have value in themselves and 'leadership and fighting spirit are also important factors.'
Related Posts:


in Note, Posted by log1o_hf