'Global Internet Map' that allows you to visually experience the Internet connection status
With the development of remote work and video distribution services, international Internet connection has become indispensable in modern society.
Global Internet Map Map 2021
https://global-internet-map-2021.telegeography.com/
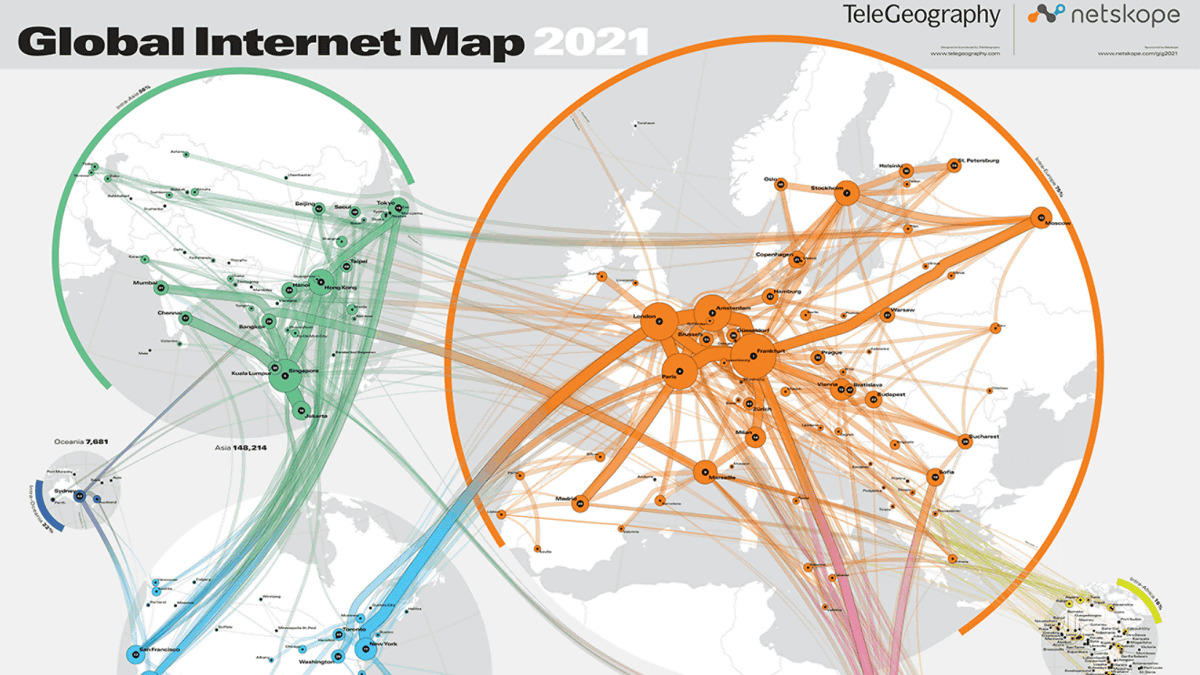
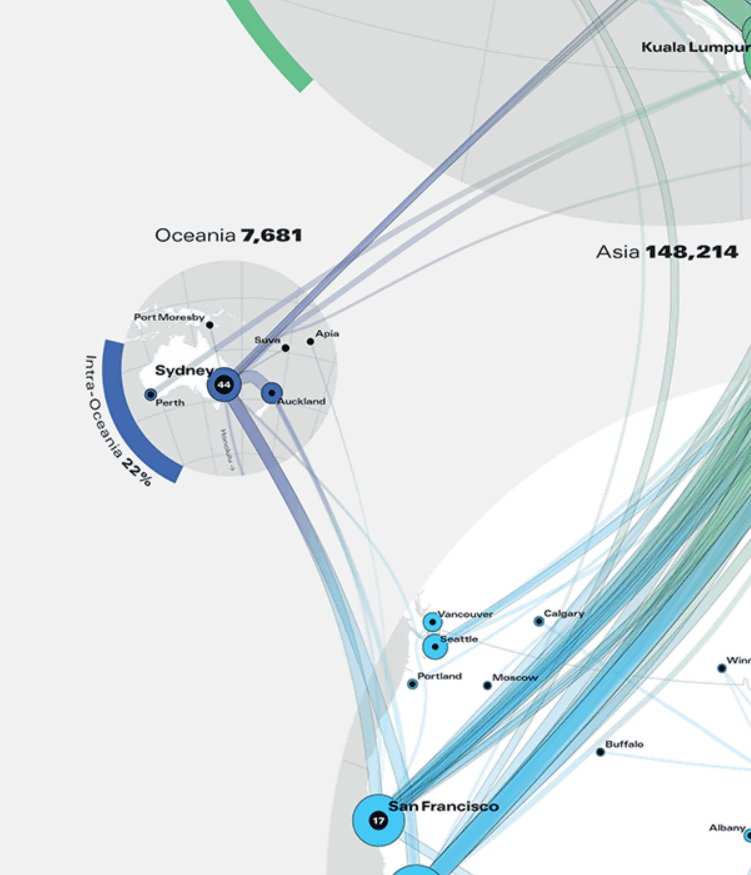
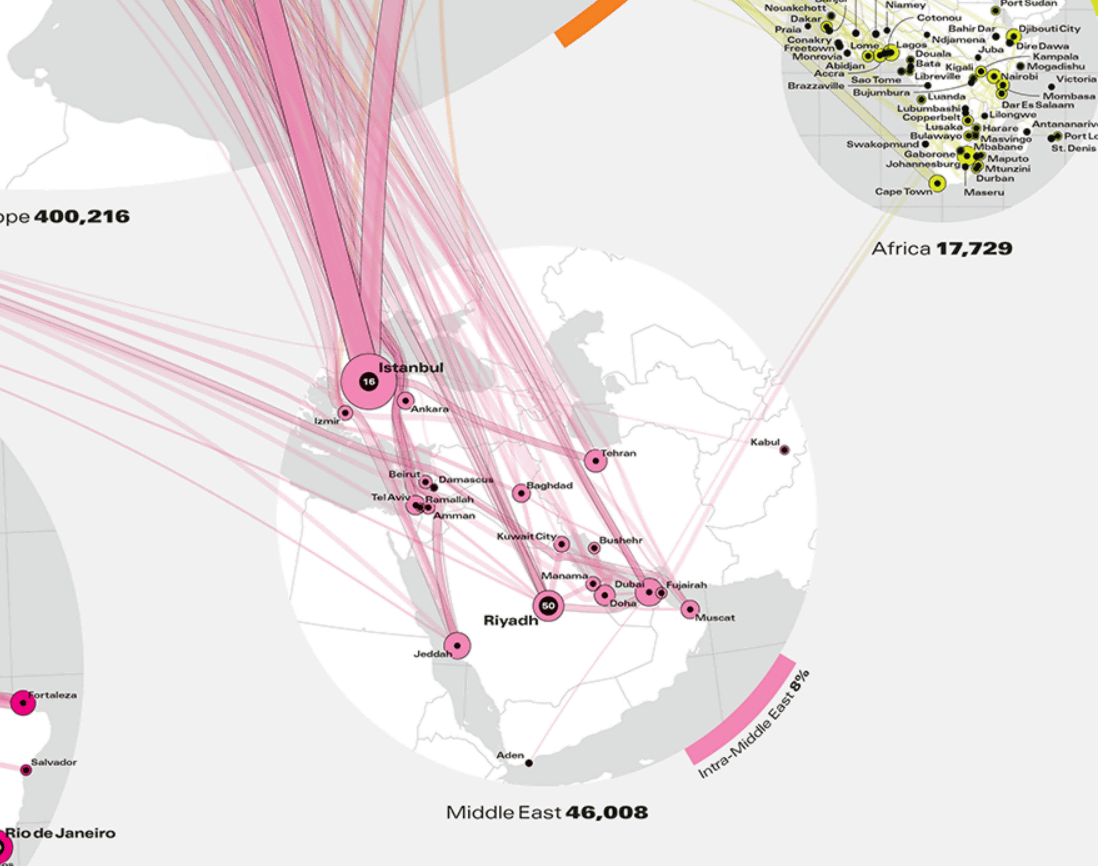
At the top of the infographic is a map showing the bandwidth of an international internet connection between big cities.
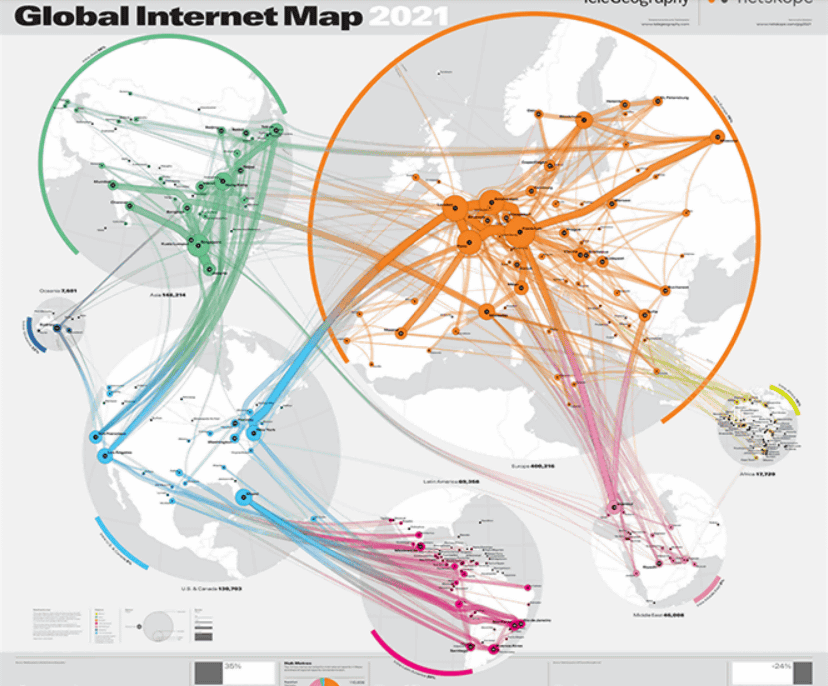
The map is divided by region, green in the upper left is Asia, blue below it is Oceania, orange in the center is Europe ...
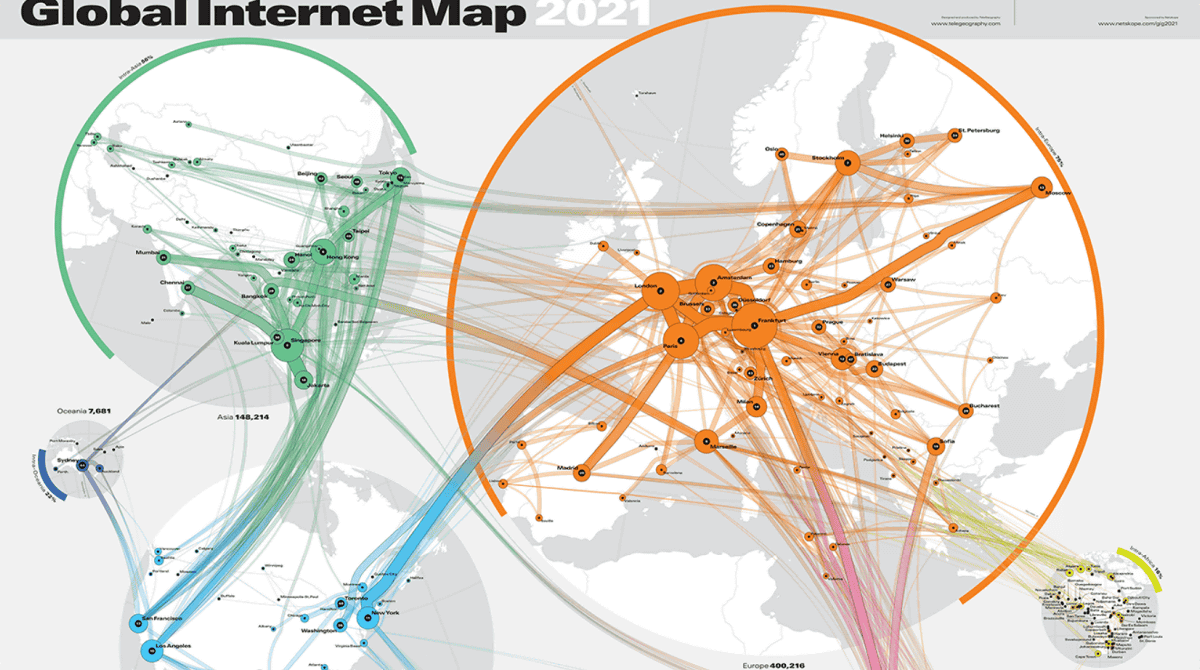
Light blue indicates North America, red indicates Latin America, pink indicates the Middle East, and yellow indicates Africa. The size of the circle represents the bandwidth of the international Internet connection in the area, and the line connecting cities across borders represents a route with a bandwidth of at least 5 Gbps. Please note that this data is from mid-2020 and is based on information from providers of international internet connection services, so it does not include routes owned by private networks.

The bandwidth of international internet connection in Asia is 148,214 Gbps, and cities such as Singapore, Jakarta, Chennai, Mumbai, Hanoi, Hong Kong, Beijing, Seoul and Tokyo have large bandwidth. 56% of the bandwidth in Asia is connected by communication within Asia, and the remaining 44% is connected to other regions.
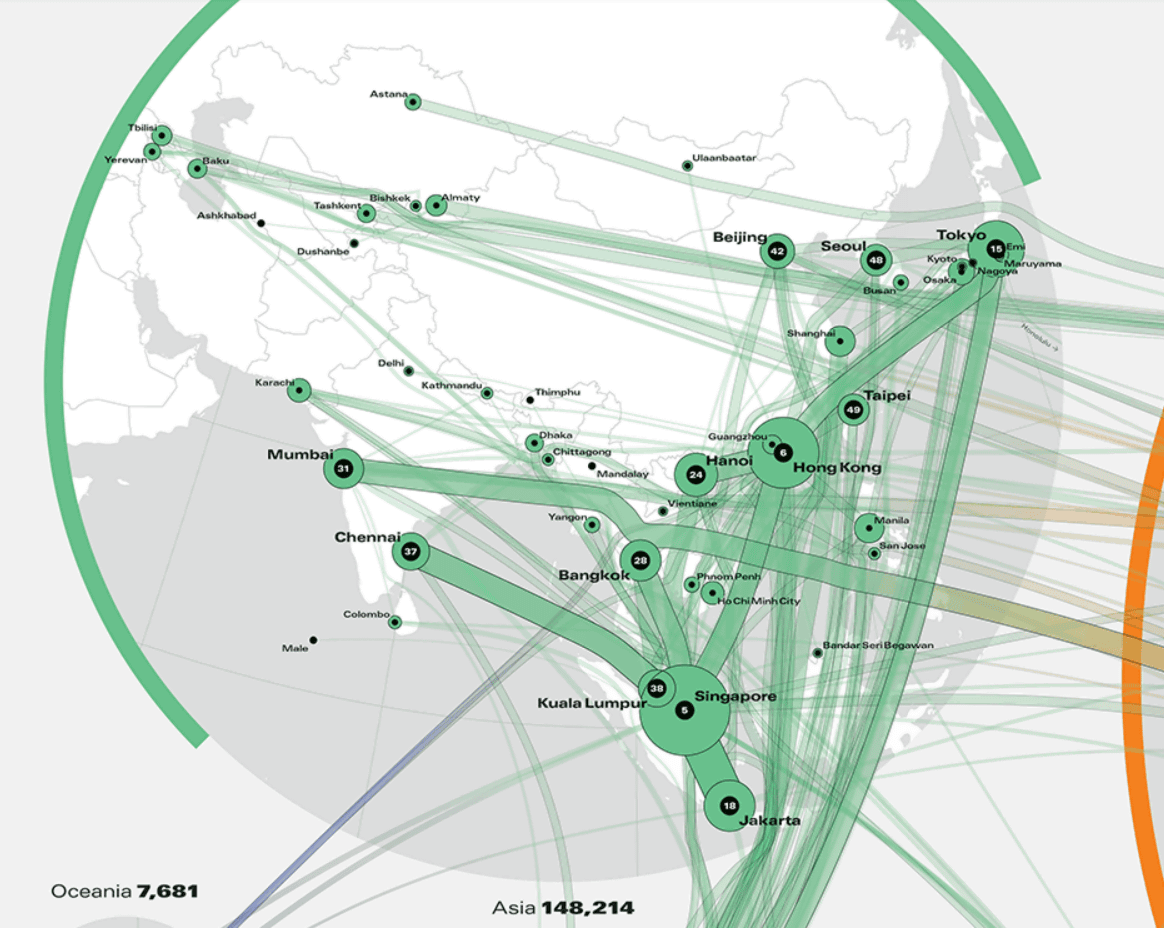
Oceania has a bandwidth of 7681 Gbps, with 22% connected to the same Oceania countries. The rest are connected to North America and Asia. Sydney has the largest bandwidth route.
The bandwidth of North America (USA / Canada) is 130,703 Gbps, of which about 9% is the bandwidth connected between the United States and Canada. The rest are connected to other regions such as Latin America, Europe, Asia and Oceania. Cities such as New York, Los Angeles, San Francisco, and Miami have particularly large bandwidth routes.
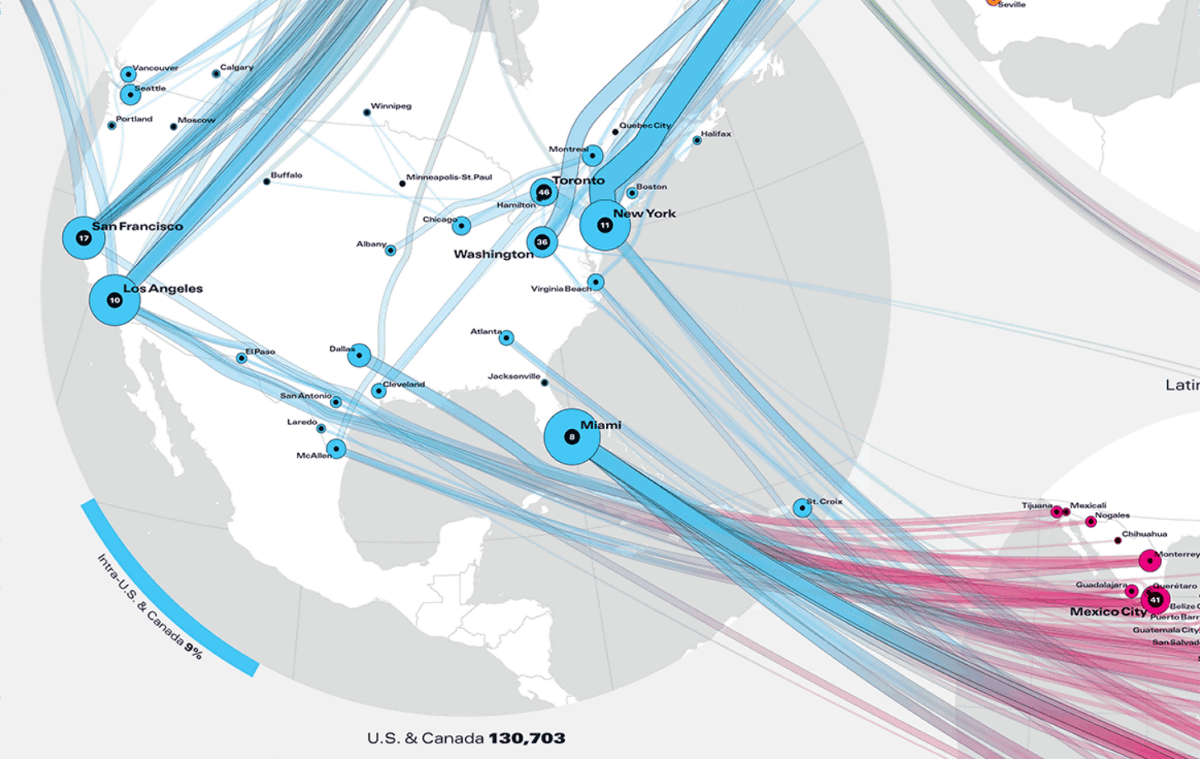
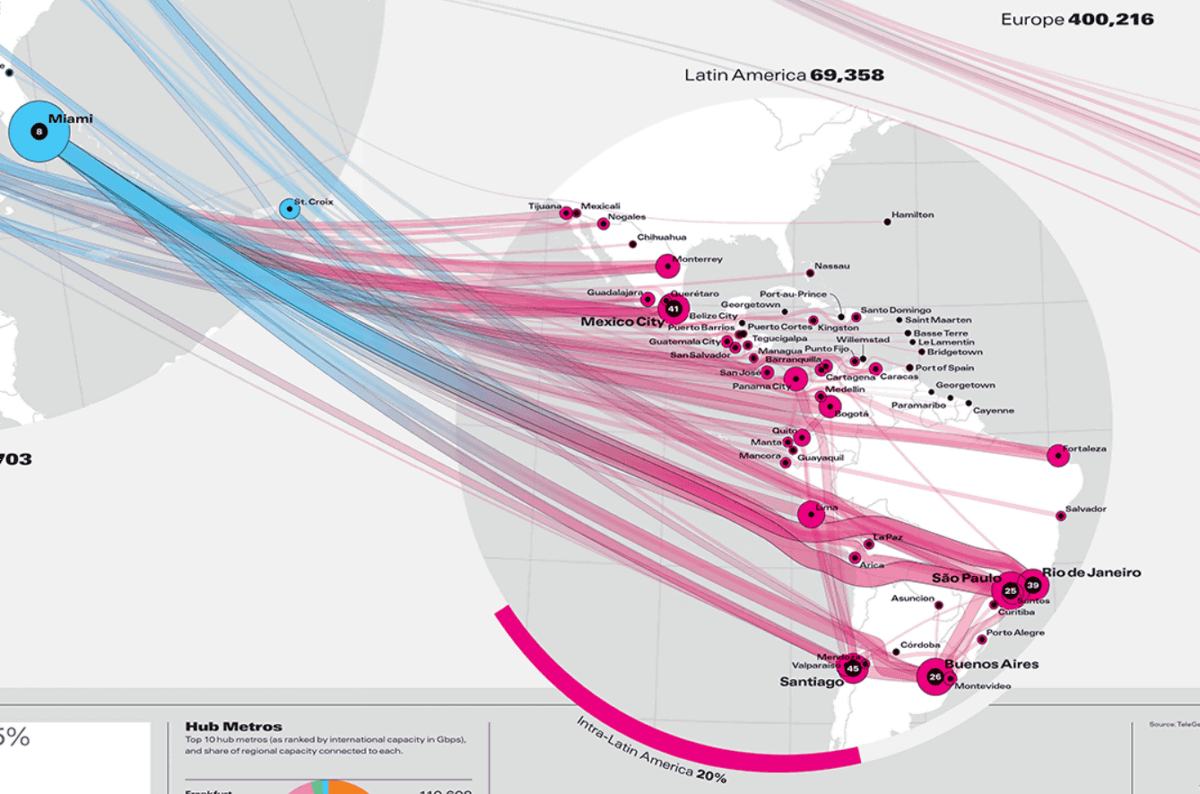
The bandwidth of Latin America is 69,358 Gbps, 20% of which is connected within the region. Infographics show that almost all routes connecting Latin America are to North America, especially to Miami. Cities such as Mexico City, San Diego, Buenos Aires, São Paulo and Rio de Janeiro have large bandwidth routes in Latin America.
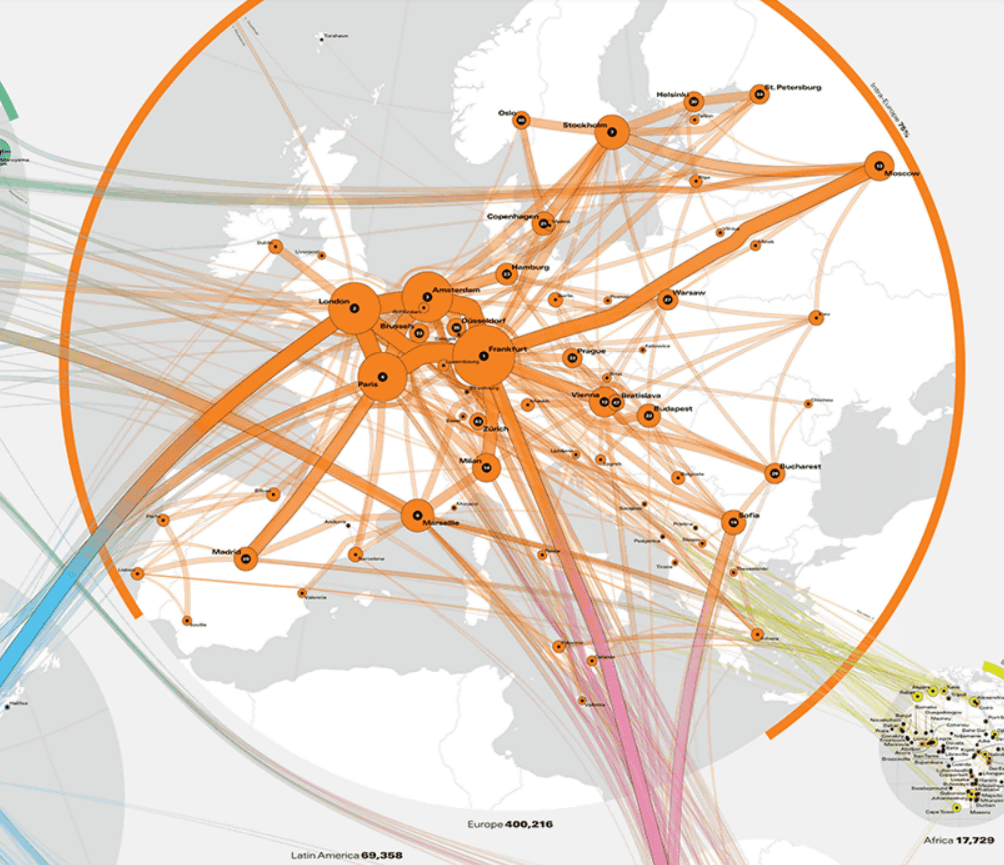
Europe has the largest circle, with a bandwidth of 400,000,216 Gbps. 75% of them are connected within Europe, and the remaining 25% are connected to North America, Africa, the Middle East, Asia, etc. Frankfurt, Paris, London and Amsterdam have particularly large bandwidth routes.
The bandwidth of Africa is 17,729 Gbps, and the ratio of connections within the region is 16%. Most of the routes are to Europe, and there are a few routes to the Middle East. The main routes are Rabat, Algiers, Alexandria, Lagos, Johannesburg and Cape Town.

Bandwidth in the Middle East is 46,008 Gbps, but connections within the region are only 8%. From Africa, it mainly starts from Istanbul and connects to Europe, and Dubai, Libya, Jeddah, etc. have routes to Asia and North America.
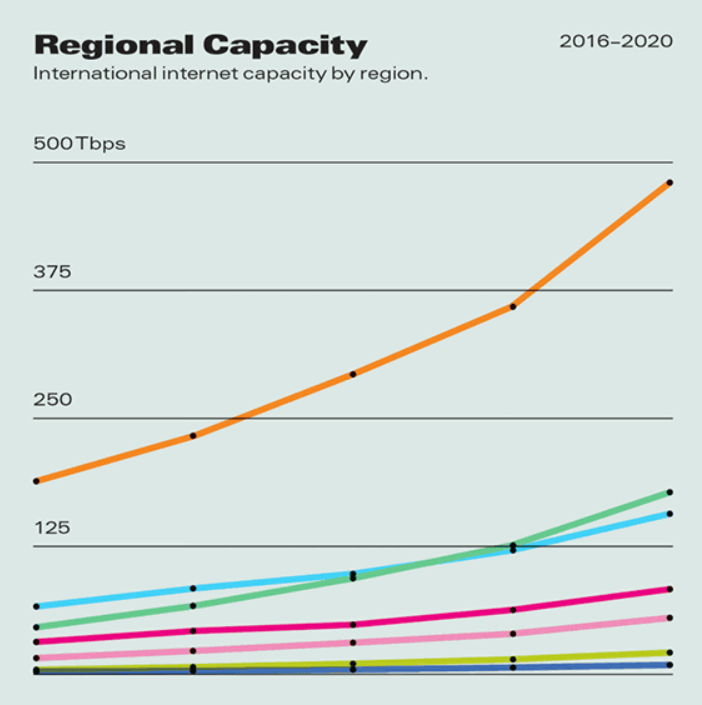
This is a graph showing how much the bandwidth available for data communication increased by region from 2016 to 2020. You can see that Europe (orange) is increasing rapidly, and that Asia (green) and North America (light blue) have nearly doubled their bandwidth compared to 2016.
The actual amount of data communication continues to increase at a rate of 30% annually from 2016 to 2020, and it is said that it has more than doubled in 2020 compared to 2016.
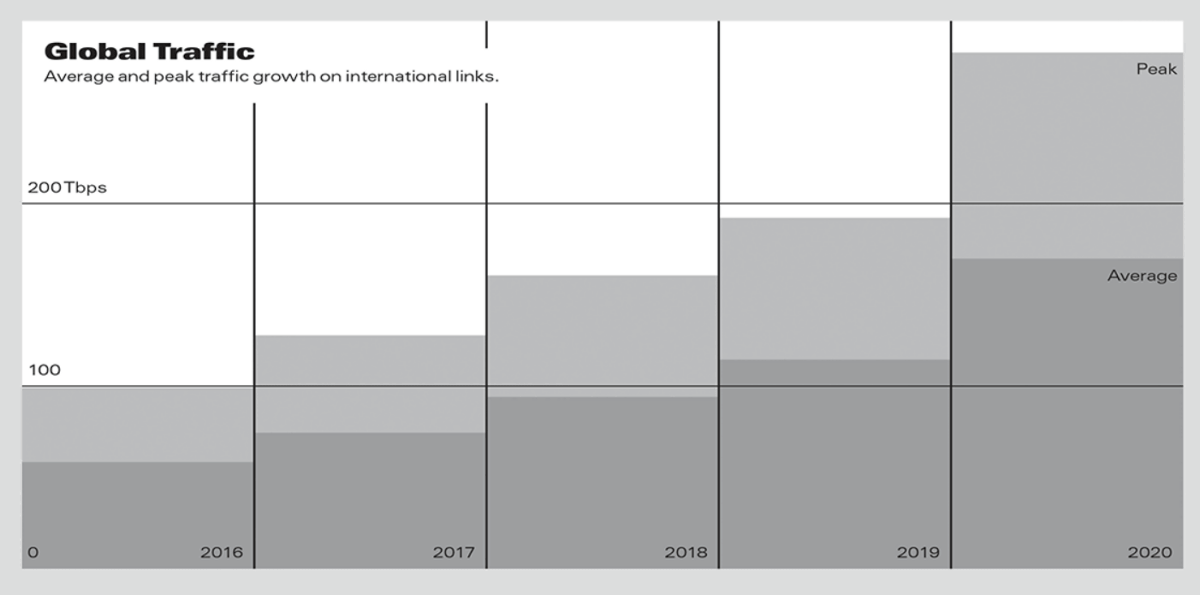
Also, here is a map showing the average
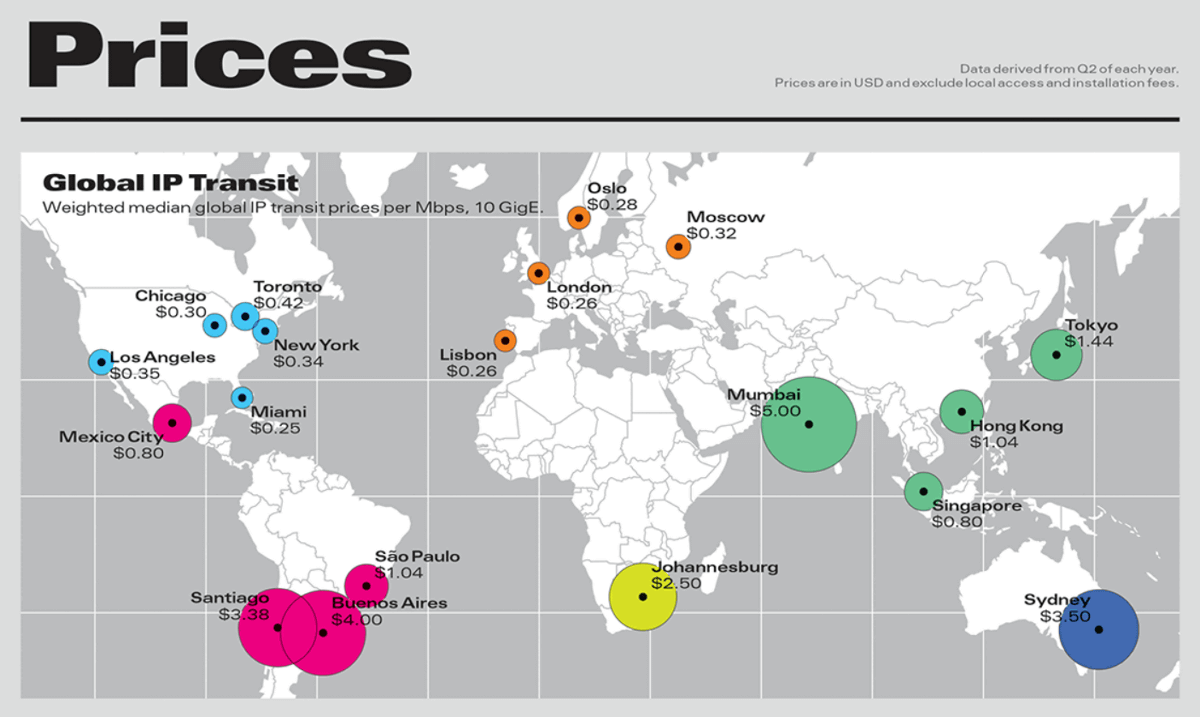
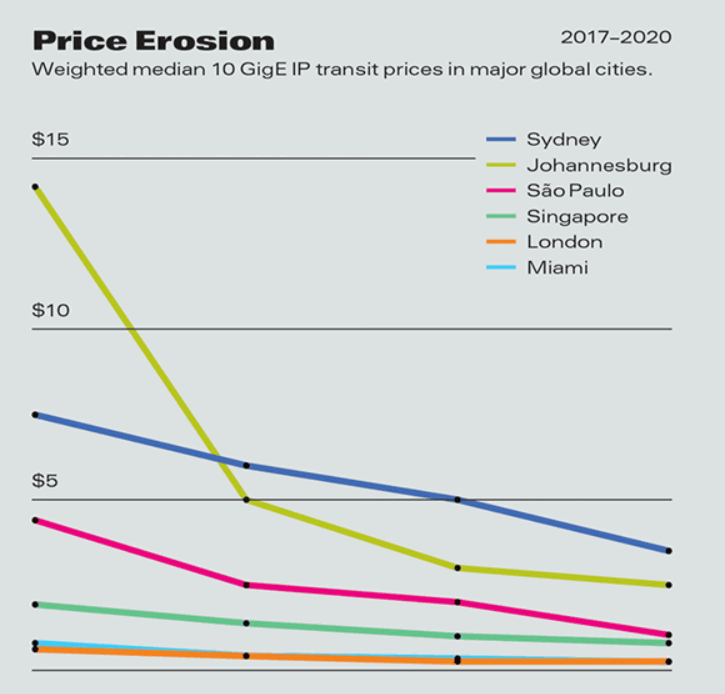
This is a graph showing how the IP transit charges per Mbps on 10 Gigabit Ethernet changed from 2017 to 2020. Prices are declining or flat in all regions, with particularly sharp price declines in Johannesburg, Sydney and São Paulo. Especially in Johannesburg, it was close to $ 14 in 2017, but it will be $ 2.5 in 2020.

Related Posts:


in Web Service, Posted by log1h_ik