What did you see as a result of recording your actions at 15-minute intervals over the course of a year?

At the beginning of the year, many people think of their New Year's aspirations to improve their lives. At the beginning of 2020, university student Ala Sawapak hopes that by recording in detail 'what I usually do', I can use the wasted time for something else. I decided to record my actions for a year every 15 minutes.
My year in data
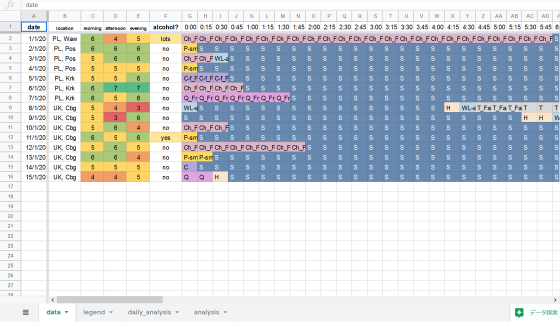
Sawapack chose Google Sheets, which can be accessed from both smartphones and computers, as a way to record his data. Then, we classify our usual behavior into the following 12 categories.
01: Sleep
02: Concentrated work (productive)
03: Work that does not require concentration (things that do not use much head)
04: Social (time spent with others)
05: Culture (reading, watching movies, etc.)
06: Human time required to live (meals, baths, etc.)
07: Other
08: Travel
09: Exercise (running, etc.)
10: Light exercise (walking, etc.)
11: Procrastination (time to procrastinate what to do and do something else (mainly SNS etc.)
12: Wait time in another category
In addition, Sawapack further categorizes several categories and creates subcategories.
◆ Work
・ University and PhD
・ Self-improvement (application for job offer, ability research, etc.)
・ Management (time to reply to emails and fill out spreadsheets, etc.)
・ Organization (meetings, extracurricular activities, etc.)
・ Learning German
◆ Culture
·Book
·movies
·documentary
·TV program
・ Others
◆ Others
·blog
・ Podcast
·news
·game
・ YouTube
・ Time to vacate
・ Others
All of this is symbolized as 'S' for sleep and 'T' for travel, color coded and recorded in a spreadsheet. According to Mr. Sawapack, 'I was satisfied with the beauty of the color coding.' Although he thought that he would get bored in a month, he said that as the amount of data increased, his motivation increased and he gradually became afraid of data loss. You can check the templates for several days from this page .

Sawapack analyzed the data for one year and sorted the categories in order of time spent. 'I'm very proud that the top three activities of the day were'sleep',' work'and'social',' says Sawapack. However, since there were many cases where multiple actions were recorded during the same time period, 16.5 days worth of 'Extra days!' Were born.

Sawapack summed up all the time spent on the work subcategories. 'Work to concentrate' is shown in the image below ...

The image below shows 'work that does not require concentration'. You can see that most of the time is spent on 'university and doctoral programs (uni & PhD)'.

'Even on days when I felt productive, knowing how little time I spent on intensive work was one of the biggest surprises of analyzing the data,' said Sawapack. I will. Although I am detained for 8 hours from 9:00 to 17:00 on work days, I spend an average of 5 to 6 hours working intensively, and spend the rest of my time chatting and coffee breaks. It was said that. It was said that there were days when the entire eight hours were concentrated, but it is impossible to continue that concentration for a long period of time, and Mr. Sawapack said, 'When it comes to intensive work, eight hours is unattainable. It is a goal, and it should not be used as a standard. '
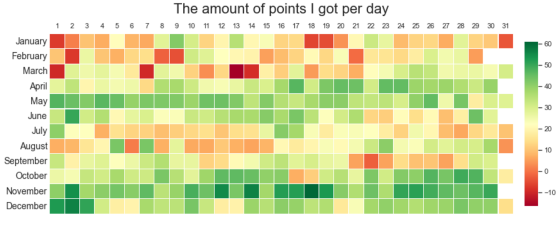
In addition, Mr. Sawapack was inspired by the article ' Score his actions ' and decided to try it himself. Regarding the analyzed data, every hour, productive time such as going to university is 4 points, culture is 3 points, work that does not need to be concentrated is 2 points, sleep is 0 points, procrastination is- I assigned points such as 4 points. As a result, it is no longer possible to divide the daily evaluation into 'good' and 'bad', and it is now possible to give a better evaluation. The following shows the total points scored by Mr. Sawapack on each day from January 1st to December 31st. The closer it is to red, the lower the score, and the closer it is to green, the higher the score. For example, the red block on the upper left shows that Sawapack's total score was 0 to -10 on January 1st. It can also be seen that the scores were relatively high in May-June and October-November of the year.

According to Sawapack, keeping track of your actions throughout the year was easier, more enjoyable and rewarding than you might have thought in advance.
Related Posts:
in Posted by log1p_kr


