A YouTube movie that is played 1000 times means it is in the top 10%.

On YouTube, movies are played 5 billion times a day, but it turns out that about 90% of them have not even reached 1000 plays.
State of YouTube 2019: Music became more valuable | Pex
Almost 90% of YouTube videos never reach 1,000 views - 9to5Google
https://9to5google.com/2020/08/10/almost-90-of-all-uploaded-youtube-videos-will-never-reach-1000-views/
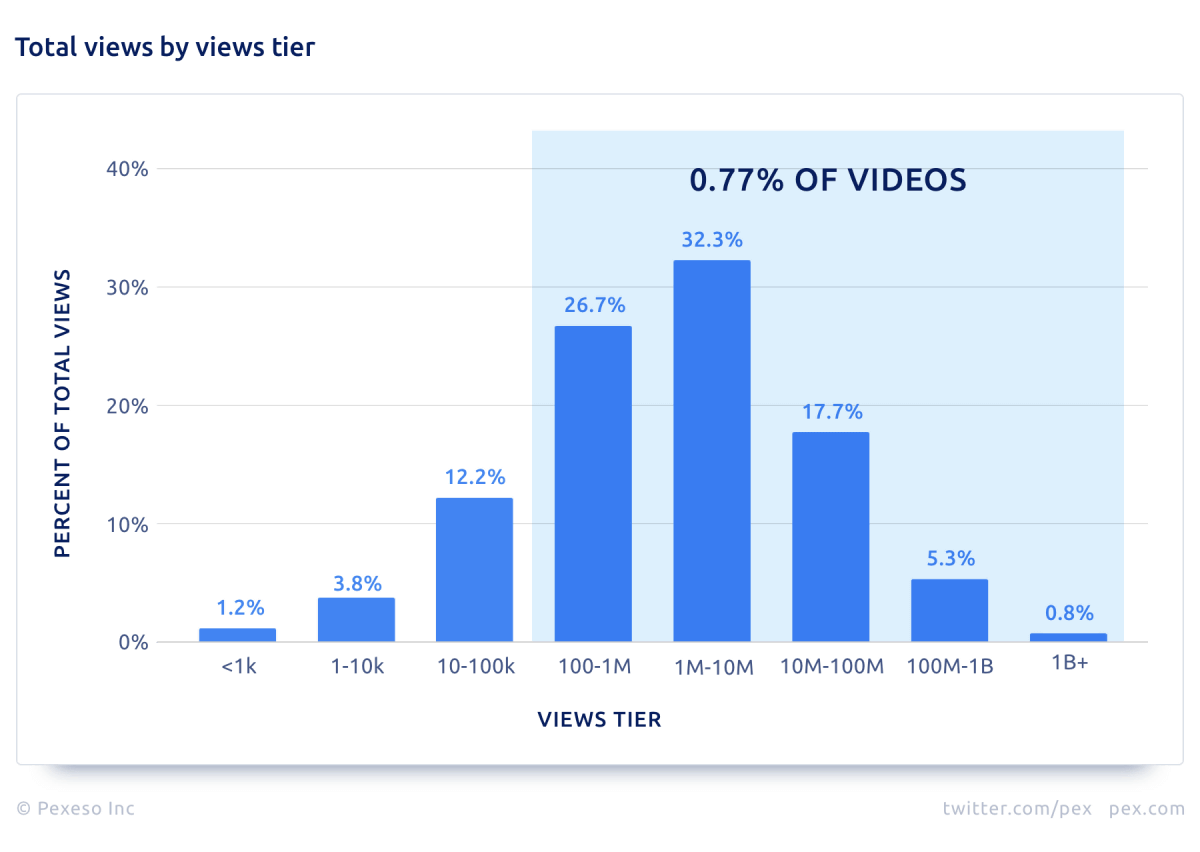
PEX , a content management platform for creators, analyzed YouTube movies from 2018 and 2019 and analyzed how YouTube is changing. The first thing we found was that 88.4% of movies uploaded to YouTube were played less than 1000 times. It was also found that 0.77% of the movies accounted for 82.83% of the total number of views.
Below, the horizontal axis shows the number of playbacks each movie belongs to, and the vertical axis shows the proportion of the total number of playbacks in each layer. Movies that have been played more than 100,000 times account for 0.77% of the total number of plays. You can see that it accounts for 82.83%.
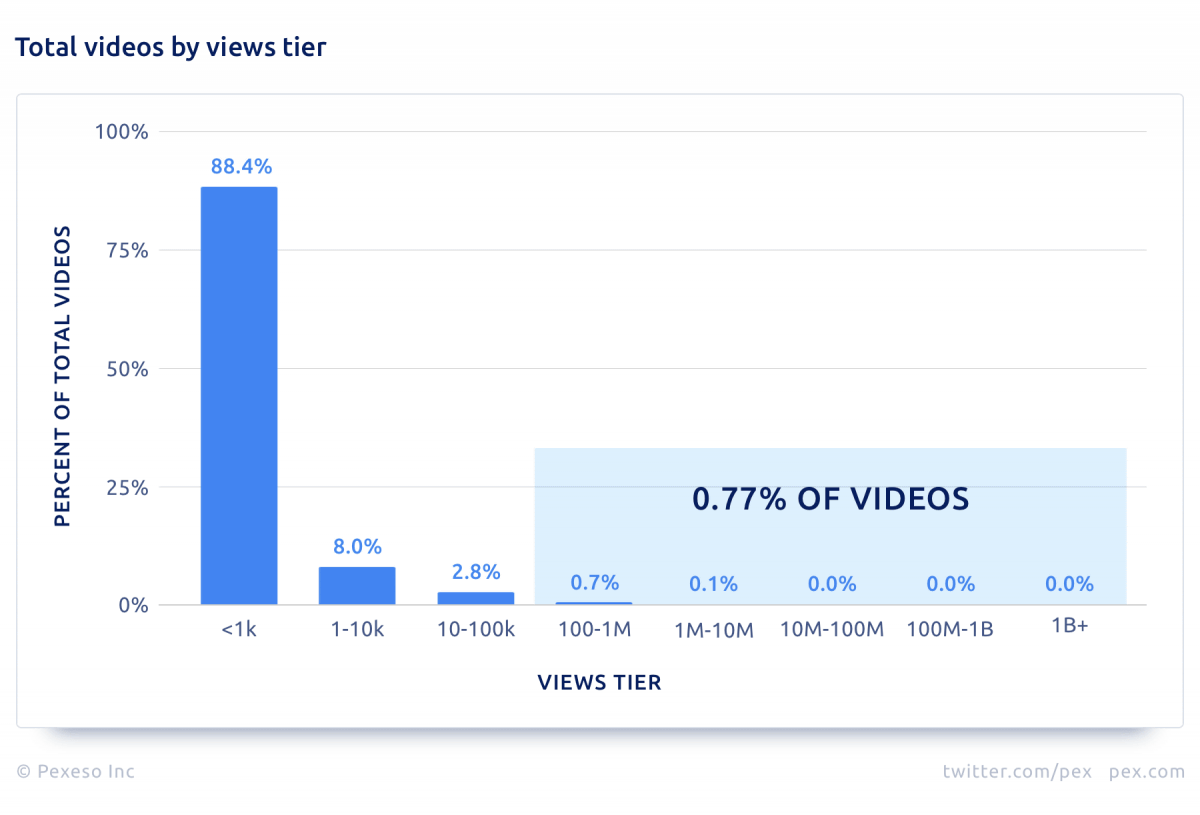
If the vertical axis is the number of posted movies on YouTube as a whole, and the horizontal axis is the playback layer to which each movie belongs, it looks like this. It is clearly shown that 88.4% of videos have less than 1000 views.
When looking at each category, ``Movies with the highest number of plays'' overwhelmingly belong to the music category. Below, the vertical axis shows the proportion each category occupies, and the horizontal axis shows the number of views each movie belongs to. Red is games, blue is blogs, light blue is other, yellow is entertainment, green is movies and anime, and orange is It's music. 83% of movies that reach 1 billion views are in the music category, 1.5% in entertainment, and only 0.5% in games.

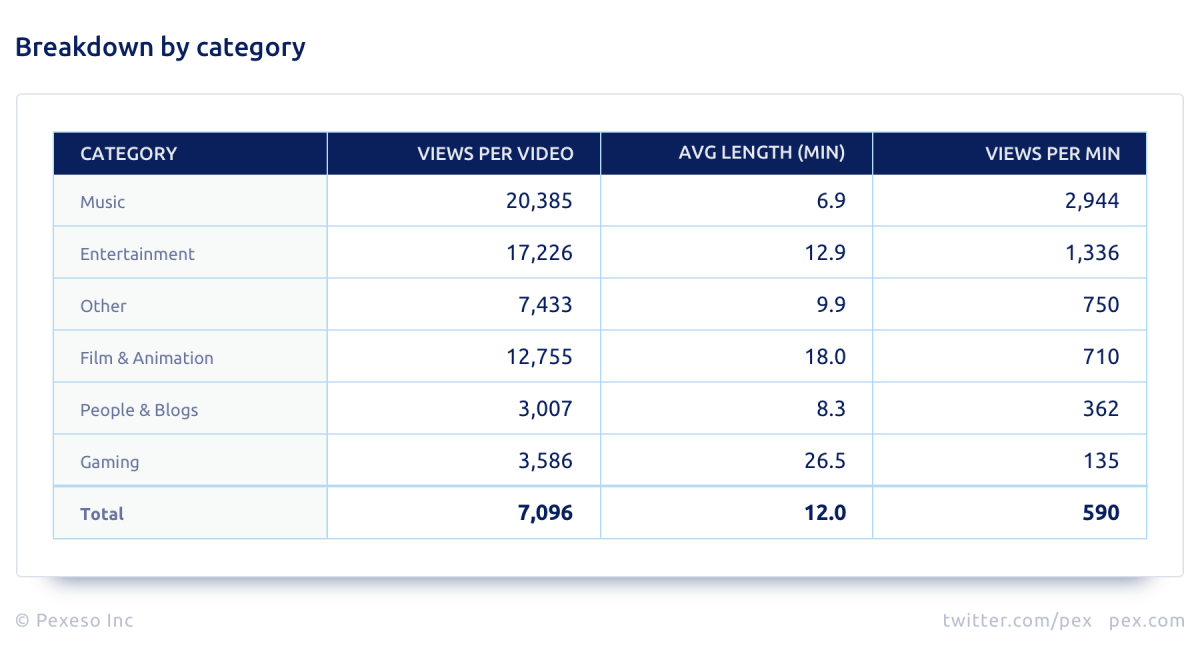
The music category is played an average of 2,944 times per minute, twice as much as entertainment and 22 times more than games.
Our 2018 analysis showed that gaming-related videos have skyrocketed over the past few years, and our 2019 data continues this trend. In the graph below, the vertical axis shows the proportion of each category in all content, and the horizontal axis shows the fiscal year from 2006 to 2022, and the trend is as you can see from the graph.
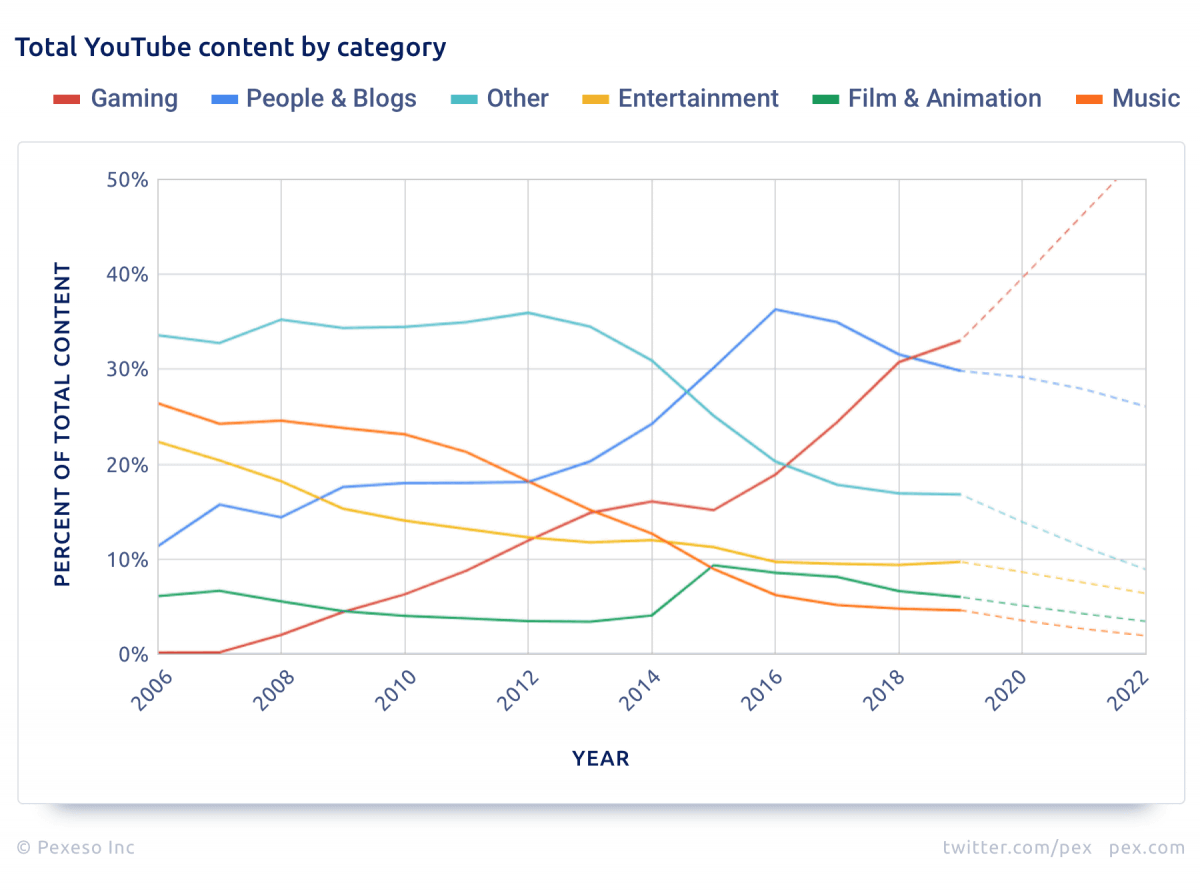
It is expected that the number of game-related videos will continue to increase in the future, but at the same time, it is also shown that the game category is dominated by movies that have been viewed less than 1000 times.
Related Posts:


in Web Service, Posted by darkhorse_log