'CNN Explainer' that can understand the image identification process of deep learning method 'CNN' by animation
Words such as 'AI' and 'machine learning' are becoming more common, but some people find it difficult to understand how they work. Polo Club , an AI research team at the Georgia Institute of Technology, has released a web application called ' CNN Explainer ' that allows you to visually understand a convolutional neural network (CNN) , which is a typical model for machine learning.
CNN Explainer
https://poloclub.github.io/cnn-explainer/
The movie actually operating CNN Explainer is as follows.
Demo Video 'CNN Explainer: Learning Convolutional Neural Networks with Interactive Visualization'-YouTube
CNN is a classifier in machine learning and is an algorithm used to identify patterns of data such as images and videos using neural networks. The basic components for understanding CNN are as follows.
-Tensor : A multidimensional array. In CCN, it is a three-dimensional value except for the output layer.
-Neuron : A function that can take multiple inputs and obtain a single output.
- layer: same hyper parameters have a set of neurons of the same operation. Hyperparameters are parameters in the algorithm that humans decide in advance.
Kernel weights and biases : Unique values for each neuron, adjusted during the training stage of the model so that the classifier model can adapt to the problem and data set provided.
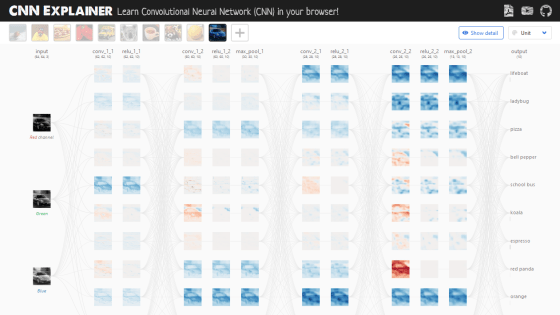
When you visit the CNN Explainer website, you will see a screen showing how the sample image is processed by CNN. While operating this screen, you will understand the movement of CNN.
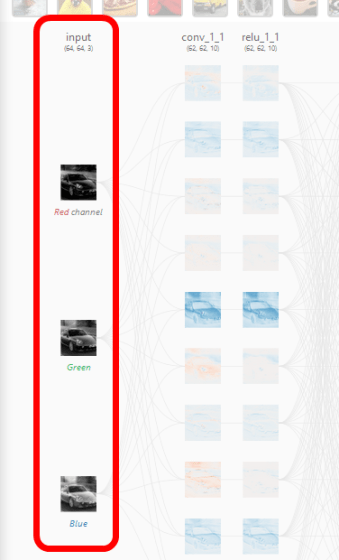
In CNN Explainer, CNN processing moves from left to right, so the leftmost processing is the first processing in CNN. In the leftmost input layer, RGB images classified into three channels of red, green and blue are input.
Clicking on one of the layer images represented by 'conv_1_1'...
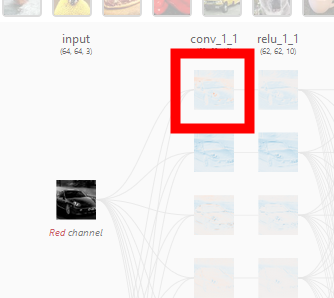
The processing of the 'convolutional layer' in CNN was developed on the screen along with the animation. Click on the red frame to see more details.
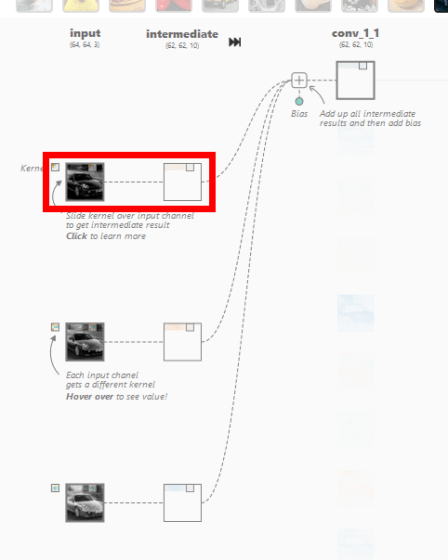
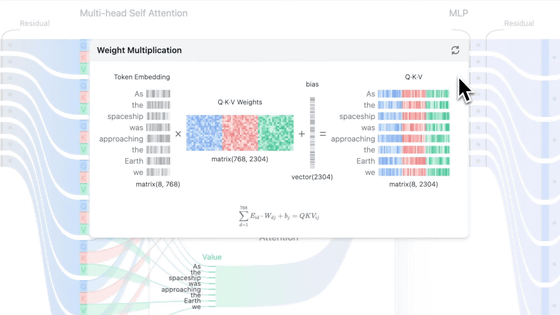
When I clicked on it, a screen showing the output for the input and the calculation process was displayed. In the convolutional layer of CNN, the dot product , which is the sum of the products of each element, is calculated for the multidimensional array, which is a value unique to the neuron called the kernel, and the multidimensional array (window) that has the same size as the kernel that represents a part of the image By calculating, it outputs the numerical value that extracted the features of that window. In the image below, the three-dimensional kernel [-0.3, -0.21, 0.07; -0.19, 0.1, -0.01; -0.04, -0.02, 0.08] and [0.18, 0.17, 0.18; 0.7, 0.17, 0.16; 0.16, 0.16, 0.16] is the dot product with the three-dimensional window [-0.09], which is the extracted value of the window feature.

In addition, the kernel moves pixel by pixel and continues to compute the dot product with the corresponding window element. This movement is called stride. The image data of 62x62 pixels is extracted from the image data of 64x64 pixels through the stride of the kernel. 
The above processing is performed for each of the red, blue, and green inputs, and the intermediate results are added together with the bias, and the two-dimensional tensor is output at the convolutional layer. This output is called a feature map, and similar processing is performed on other neurons in the convolutional layer. Since CNN Explainer outputs 10 feature maps from 3 inputs corresponding to red, blue, and green, it is explained that there are 3×10=30 kernels. 
The size of the kernel and the number of pixels to stride are hyperparameters that humans set. There are three main CNN hyperparameters, each of which has a description.
-Padding : A space in which the kernel can move beyond the feature map, and is a parameter that improves accuracy. It is described that zero padding is commonly used to set zero in the space of interest.

-Kernel size : The length of one side of the kernel. It is a parameter that greatly affects the image classification process of CNN, and although appropriate values differ depending on the type of image and data set, generally it is better to be smaller.

Stride : The number of pixels the kernel moves at one time. If the stride is small, more data will be extracted, so more features will be learned and the output size will increase. Conversely, a larger stride limits the feature extraction and reduces the size of the output.

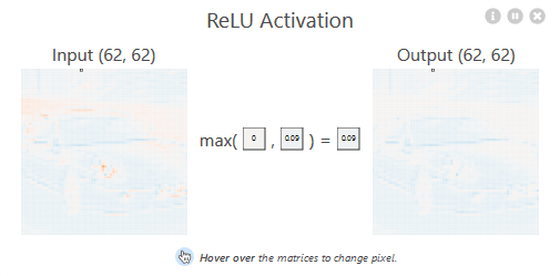
The feature map output by the convolutional layer is processed by the 'ReLU layer' using the normalized linear function (ReLU) .

ReLU is a non-linear activation function that supports the accuracy of CNN, and without ReLU, the performance of CNN will deteriorate. ReLU is expressed by the following formula and graph. In other words, it is a function that compares the input value with 0 and outputs the larger value.

To check the processing of the ReLU layer in detail, click the red frame part of CNN Explainer.

The processing of the ReLU layer is displayed in a popup. The feature map output from the convolutional layer is used as input, and the calculation by the ReLU function is performed for each element.
In the CNN Explainer model, after passing through two convolutional layers and ReLU layers respectively, processing by the pooling layer is performed. The pooling layer has the purpose of gradually reducing the spatial spread of the network and reducing the network parameters and computational complexity.

Click the red frame to check the details of the pooling layer in CNN Explainer.

The pooling type of CNN Explainer is Max-Pooling, which calculates the maximum value of the numbers in the kernel in the input value, strides the kernel, and repeats the calculation of the maximum value. In CNN Explainer, 60x60 data has been reduced to 30x30.

In CNN Explainer, another set of processing of the above convolutional layer → ReLU layer → pooling layer is performed.

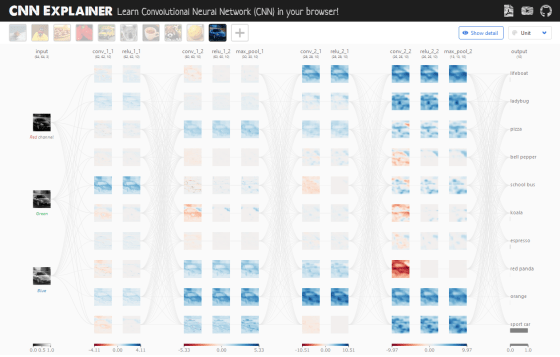
The discrimination result of the selected image can be confirmed in the rightmost column. If you selected the image of a blue sports car, a gray bar was displayed under 'sport car'. This means that the image has been identified as likely to be a sports car. Click the red frame to check the details.

The 'smoothing layer' that converts the 3D feature map extracted so far into 1D values is displayed. The smoothing layer is a layer that transforms the feature map by the softmax function, which is the final processing of CNN.

Click 'softmax' to display the processing of the softmax function.

Before the calculation by the softmax function, the total value of the probabilities of each classification is not 1. The calculation by the softmax function is a process to set the sum of the probabilities output by CNN to 1.

The specific calculation formula is as follows. The probability of a classification divided by the sum of the probabilities of all classifications.

The probability that the entered image corresponds to the selected classification is displayed above the classification name when you click the classification.

The source code of CNN Explainer is published on GitHub, and it can be installed from npm. If you hosted CNN Explainer yourself, you can upload any image you like and categorize it.
poloclub/cnn-explainer: Learning Convolutional Neural Networks with Interactive Visualization.
https://github.com/poloclub/cnn-explainer
Related Posts:


in Software, Review, Web Application, Posted by darkhorse_log